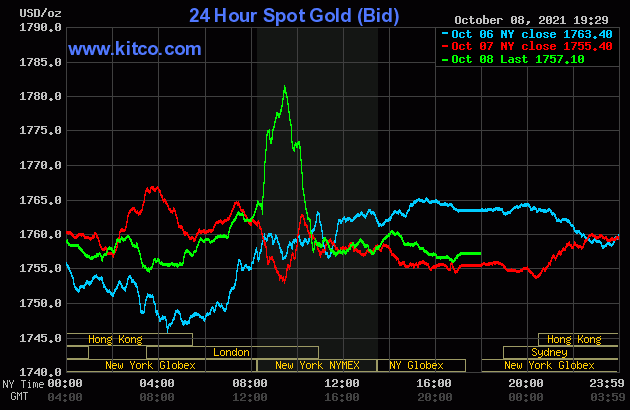
The gold price had a quiet and uneven up/down move between 8:15 a.m. China Standard Time on their Friday morning -- and until around 8:35 a.m. in London. It didn't do much from there until it began to head higher starting minutes after 10 a.m. BST, then went vertical at 8:30 a.m. EDT when the jobs report came out. But that price spike ran into serious opposition right away -- and it was capped and hammered lower starting at 9:30 a.m. in New York. All the price damage that mattered was in by around 10:45 a.m. EDT...fifteen minutes before the London close -- and its tiny rally attempt after that lasted until 2 p.m. in after-hours trading -- and it was sold quietly lower until trading ended at 5:00 p.m. EDT.
The low and high ticks in gold were reported by the CME Group as $1,753.60 and $1,782.40 in the December contract. The October/December price spread differential in gold at the close yesterday was only $1.10...December/February was $2.00 -- and February/April was $1.70 an ounce.
Gold was closed on Friday afternoon in New York at $1,757.10 spot, up only $1.70 on the day -- and about 26 bucks off its Kitco-recorded high tick. Net volume was pretty enormous at a bit over 223,500 contracts -- and there was a bit over 17,500 contracts worth of roll-over/switch volume on top of that...almost all of it into the first three delivery months of the New Year.
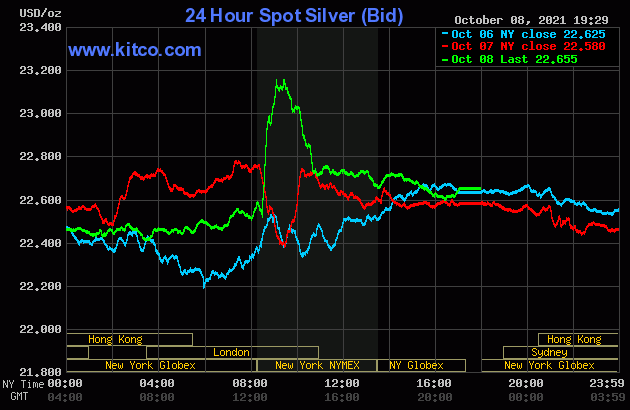
The silver price crept very quietly and a bit unevenly lower until around 8:35 a.m. in London on their Friday morning -- and from that juncture it began to crawl higher. Like gold, it blasted higher at 8:30 a.m. in New York -- and you know the rest.
The low and high ticks in silver were recorded as $22.435 and $23.22 in the December contract. The December/March price spread differential in silver at the close yesterday was 5.0 cents...March/May was 4.6 cents -- and May/July was 3.5 cents an ounce.
Silver was closed in New York on Friday afternoon at $22.655 spot, up 7.5 cents from Thursday -- and 62 cents off its Kitco-recorded high tick. Net volume was pretty heavy at a bit under 66,000 contracts -- and there was a bit over 4,400 contracts worth of roll-over/switch volume in this precious metal...virtually all of it into the New Year.
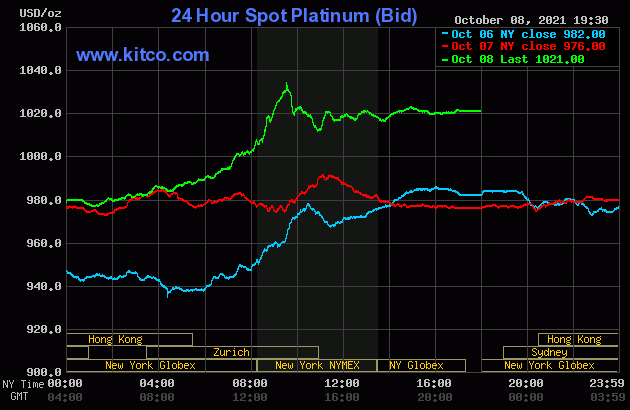
Platinum had a very quiet up/down move in Far East trading on their Friday -- and that lasted until around 1 p.m. or so China Standard Time on their Friday afternoon. It began to head quietly higher from there -- and the rally gathered even more strength very shortly after 12 o'clock noon in Zurich. But, like silver and gold, someone put a fork in the price very shortly after the equity markets opened in New York -- and it was sold lower until the 11 a.m. EDT Zurich close. It crawled quietly and a bit unevenly higher from that point until 3 p.m. in the thinly-traded after-hours market -- and didn't do a thing after that. Platinum was closed at $1,021 spot, up 45 bucks on the day -- and 23 dollars off its Kitco-recorded high tick.
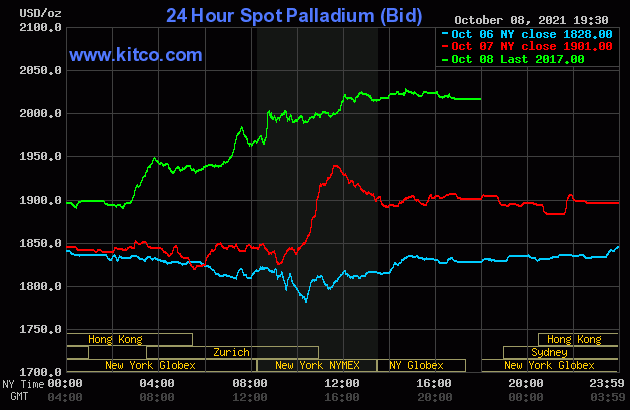
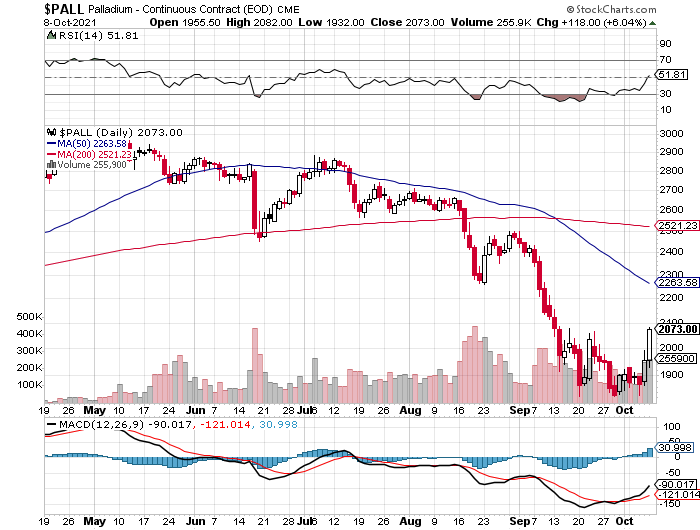
Palladium traded pretty flat until a very few minutes before the Zurich open -- and its uneven rally continued until noon in New York -- and it didn't do a whole heck of a lot after that. Palladium finished the Friday session at $2,017 spot, up $116 dollars from Thursday's close -- and 14 bucks off its Kitco-recorded high tick of the day.
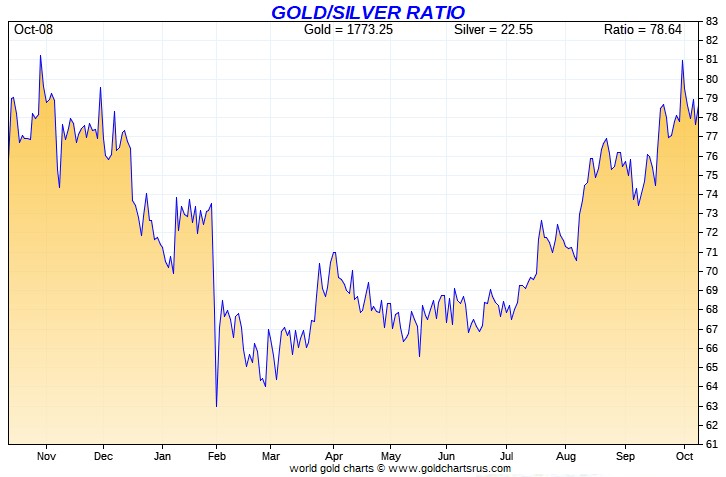
Based on the kitco.com spot closing prices in silver and gold posted above, the gold/silver ratio worked out to 77.6 to 1 on Friday...compared to 77.7 to 1 on Thursday.
I don't know about you, but it's amazing to me that we can have such engineered price moves as we had yesterday, but the gold/silver ratio barely changes. I guess it's not too much of a stretch to say that there's some sort of algorithm involved in keeping it that way...as everything else is managed these days, so why not that as well.
However, maybe it's just me looking for black bears in dark rooms that aren't there.
And here's Nick's 1-year Gold/Silver Ratio chart, updated with the last five days of data. Click to enlarge.
![]()
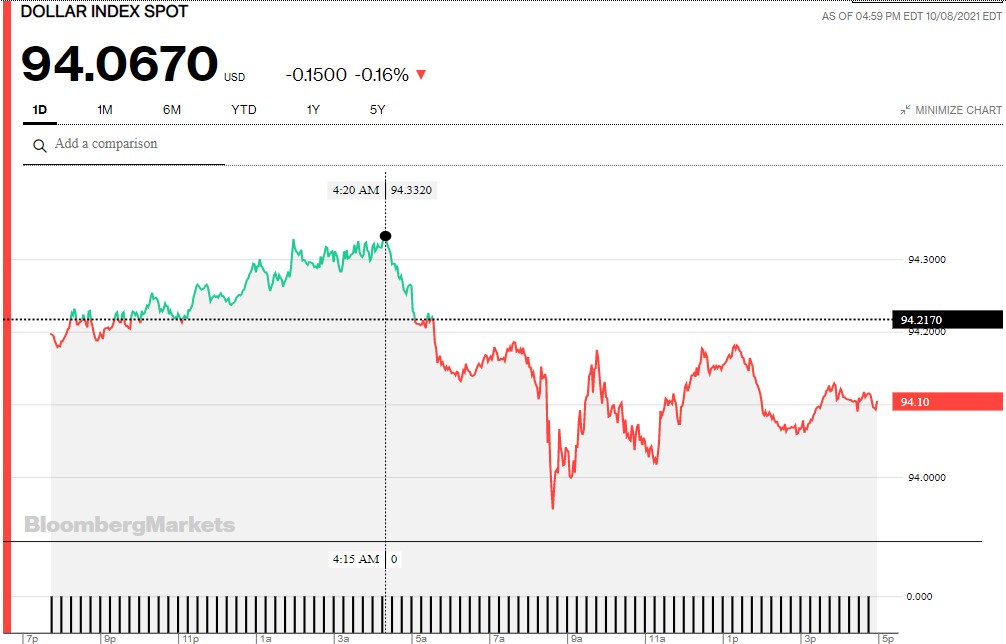
The dollar index closed very late on Thursday afternoon in New York at 94.217 -- and then opened lower by 2 basis points once trading commenced around 7:45 p.m. EDT on Thursday evening, which was 7:45 a.m. China Standard Time on their Friday morning. It began to head quietly and unevenly higher from there in a saw-tooth pattern, the likes of which I'd never seen before. The rally topped out at 9:20 a.m. in London...about twenty minutes before silver and gold's low of the day were set. It took two steps lower from that point -- and its low tick was printed at 8:38 a.m. in New York. It appeared to get saved at that juncture -- and then rallied for a bit over an hour, before wandering very unevenly sideways until trading ended at 5:00 p.m. EDT.
The dollar index finished the Friday trading session in New York at 94.067...down 15 basis points from its close on Thursday -- and a bit over 3 basis points below its indicated spot close on the DXY chart below.
And here's the DXY chart for Friday, thanks to Bloomberg as always -- and the above-mentioned discrepancy should be noted. Click to enlarge.
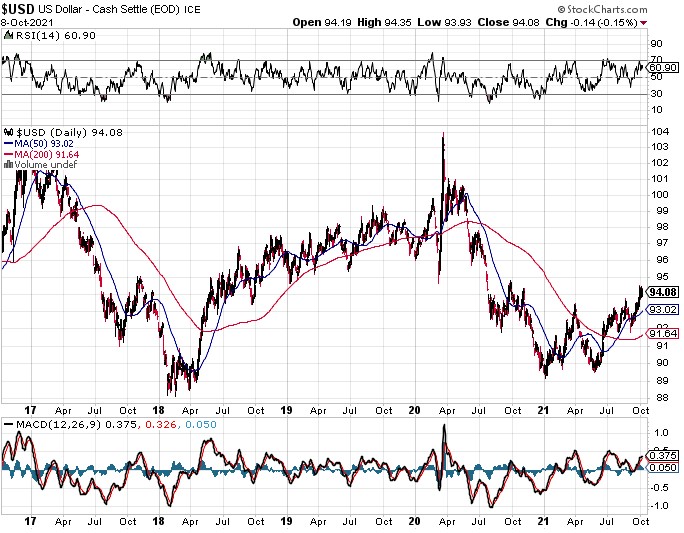
Here's the 5-year U.S. dollar index chart that appears in this spot in every Saturday column, courtesy of the fine folks over at the stockcharts.com Internet site. The delta between its close...94.08...and the close on the DXY chart above, was about 1 basis point above its spot close on Friday. Click to enlarge as well.
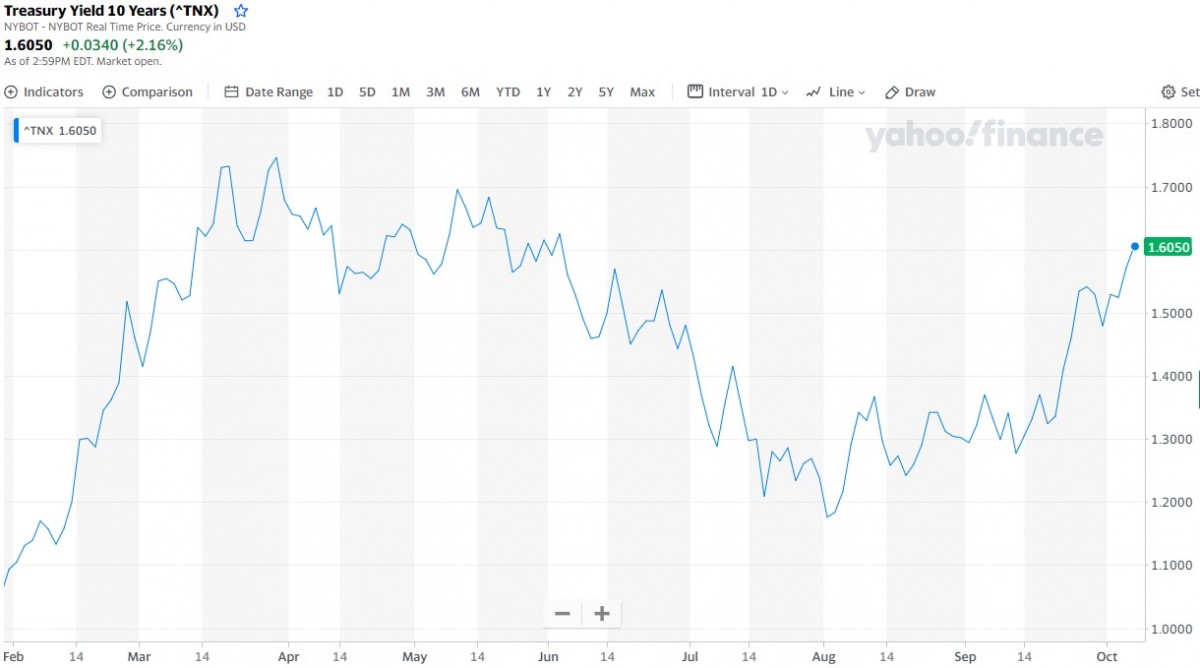
U.S. 10-Year Treasury: 1.6050%...up 0.0340 (+2.16%)...as of 2:59 p.m. EDT.
Here's the one-year 10-year U.S. Treasury chart, courtesy of yahoo.com as always -- and as I keep pointing out, you can see where the Fed began yield curve control in March. But that upward bias that started at the beginning of August, has become far more pronounced in recent weeks. Click to enlarge.
![]()
The gold stocks blasted higher at the 9:30 open in New York on Friday morning -- and with the engineered price decline in gold that followed minutes later, the shares followed. The HUI closed up by only 0.69 percent -- and a bit over 2 percentage points off its high.

Ditto for the silver equities, as Nick Laird's Intraday Silver Sentiment/Silver 7 Index closed higher by only 0.55 percent. Click to enlarge if necessary.
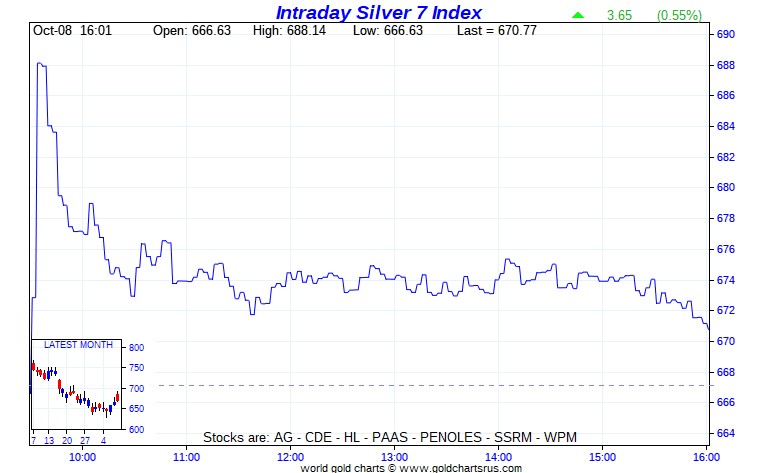
Computed manually, the above index closed up 0.72 percent.
And here's Nick's 3-year Silver Sentiment/Silver 7 Index chart, updated with Friday's candle. Click to enlarge as well.
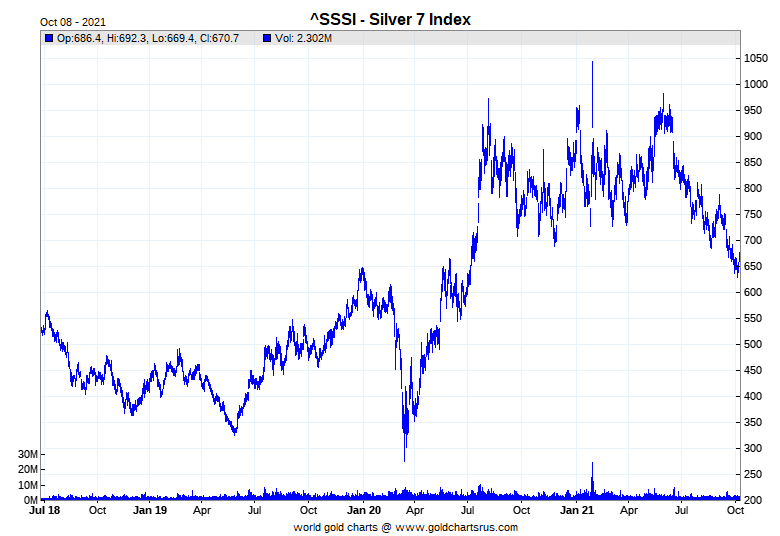
The 'star' was First Majestic Silver, as it closed up 1.89 percent -- and the dog was Coeur Mining, as it closed down 0.48 percent on the day.
Here's some silver eye candy from the reddit.com/Wallstreetsilver crowd -- and it comes to us courtesy of reader Anthony Harnett -- and is linked here. If that's not enough for you, there's more linked here.
![]()
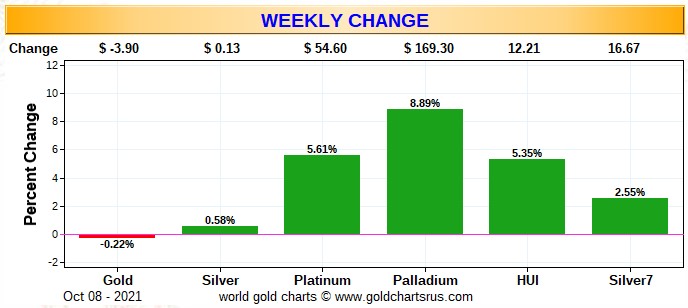
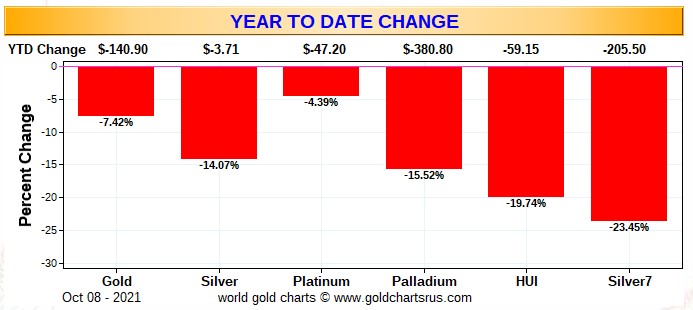
Here are two of the usual three charts that show up in every Saturday missive. They show the changes in gold, silver, platinum and palladium in both percent and dollar and cents terms, as of their Friday closes in New York — along with the changes in the HUI and the Silver 7 Index.
Here's the weekly chart -- and only gold finished in the red -- and it, only by a whisker. As you know, platinum and palladium have been allowed to outperform. The gold shares certainly did better than their silver cousins. Click to enlarge.
The month-to-date chart is not available this week -- and that's because of the way Nick's program works go generate the data for it. The month-to-date chart is the weekly chart above, plus one day...last Friday, which was the first trading day of the month -- and his month-to-date program doesn't work with that configuration for some reason. It will return in its usual spot next Saturday.
Here's the year-to-date chart -- and it's still wall-to-wall ugly. The silver equities are 'outperforming' their golden brethren when compared to the performances of their underlying physical metals. However -- and as I pointed out in this spot last week, that's very cold comfort indeed. Click to enlarge.
As Ted Butler has mentioned on many occasions, the short positions of the Big 8 commercial traders in general -- and the Big 4/8 short commercial traders/banks in particular, are the sole reason that precious metal prices aren't at the moon already, as just about every other group of traders in the COMEX futures market, including the commercial traders in the Swap Dealer category, are net long against them in three of the four precious metals...the exception being palladium.
In the COT discussion further down, the commercial net short position decreased by a very smallish and negligible amount in silver -- and was mainly due to the small traders selling long positions. The short position in gold increased by a very decent amount.
But as far as the Big 8 commercial traders are concerned, overall they've made little progress in their attempts to reduce their monstrous short position in gold, silver and platinum. They're certainly down from their highs of earlier this year, but are still obscene and grotesque.
The CME Daily Delivery Report showed that 931 gold and zero silver contracts were posted for delivery within the COMEX-approved depositories on Tuesday.
In gold, the sole short/issuer was Deutsche Bank -- and the tallest hog at the trough as a long/stopper as always, was JPMorgan, picking up 686 contracts in total...78 for its own account -- and the other 608 contracts for clients. Goldman and Australia's Macquarie Futures were in very distant second and third place, stopping 57 and 53 contracts for their respective client accounts.
The link to yesterday's Issuers and Stoppers Report is here.
Month-to-date there have been an enormous 13,828 gold contracts issued/reissued and stopped -- and that number in silver is 1,746 contracts. In platinum so far in October, there have been a pretty hefty 2,487 contracts issued and stopped -- and that number in palladium is 1 contract.
The CME Preliminary Report for the Friday trading session showed that gold open interest in October increased by 102 contracts, leaving 3,500 still open, minus the 931 contracts mentioned a few paragraphs ago. Thursday's Daily Delivery Report showed that 18 gold contracts were actually posted for delivery on Monday, so that means that 102+18=120 more gold contracts just got added to the October delivery month. Silver o.i. in October fell by 145 contracts, leaving 127 still around. Thursday's Daily Delivery Report showed that 195 silver contracts were actually posted for delivery on Monday, so that means that another 195-145=50 silver contracts were added to October.
Total gold open interest at the close yesterday only rose by 720 COMEX contracts, which I was certainly happy to see -- and total silver o.i. increased by only 417 contracts. Both numbers are subject to slight revisions by the time the final numbers are posted on the CME's website later on Monday morning CDT. I'll have more on this in The Wrap.
There was a withdrawal from GLD yesterday, the first since Friday of last week, as 47,972 troy ounces of gold was reported taken out. There was also a withdrawal from SLV, as an authorized participant removed 1,018,402 troy ounces of silver.
In other gold and silver ETFs and mutual funds on Planet Earth on Friday, net of any changes in COMEX, GLD & SLV inventories, there was a net 138,838 troy ounces of gold removed -- and all of that, plus more...166,350 troy ounces in total...was taken out of Xetra-Gold. In silver, there was a net 1,008,884 troy ounces removed -- and all of that, plus a tiny bit more, came out of iShares/SVR.
There was another tiny sales report from the U.S. Mint yesterday, they sold 3,000 troy ounces of gold eagles -- and that was all.
Month-to-date the mint has sold 84,500 troy ounces of gold eagles -- 12,500 one-ounce 24K buffaloes -- and 500,000 silver eagles.
There was very little activity in gold over at the COMEX-approved depositories on the U.S. east coast on Thursday. Nothing was reported received -- and only 5,093 troy ounces was shipped out.
The 'out' activity involved three different depositories -- and the two biggest were Brink's, Inc...as they parted with 2,893.590 troy ounces/90 kilobars. They were followed by JPMorgan, as they shipped out 2,100 troy ounces.
There was some paper activity -- and all of it was from the Registered category and back into Eligible as usual...14,467.950 troy ounces/450 kilobars over at Manfra, Tordella & Brookes, Inc. -- and the remaining 7,716.240 troy ounces/240 kilobars made that trip over at Brink's, Inc.
The link to Thursday's COMEX activity in gold is here.
In silver, the only 'in' activity was 1,001 troy ounces/one good delivery bar that ended up at Delaware. There was one truckload shipped out....600,070 troy ounces...and that departed Manfra, Tordella & Brookes, Inc. There was no paper activity. The link to all this is here.
There was a bit of activity over at the COMEX-approved gold kilobar depositories in Hong Kong on their Thursday. Nothing was shipped out, but 100 kilobars arrived at Brink's, Inc. -- and 50 were dropped off at Loomis International. The link to that, in troy ounces, is here.
![]()
Here are the usual two 20-year charts that show up in this space every Saturday. They show the total amount of physical gold and silver held in all know depositories, ETFs and mutual funds as of the close of business on Friday.
For the week just past, there was a net 244,000 troy ounces of gold removed -- and in silver, there was a net 2,903,000 troy ounces of silver removed as well. Click to enlarge.
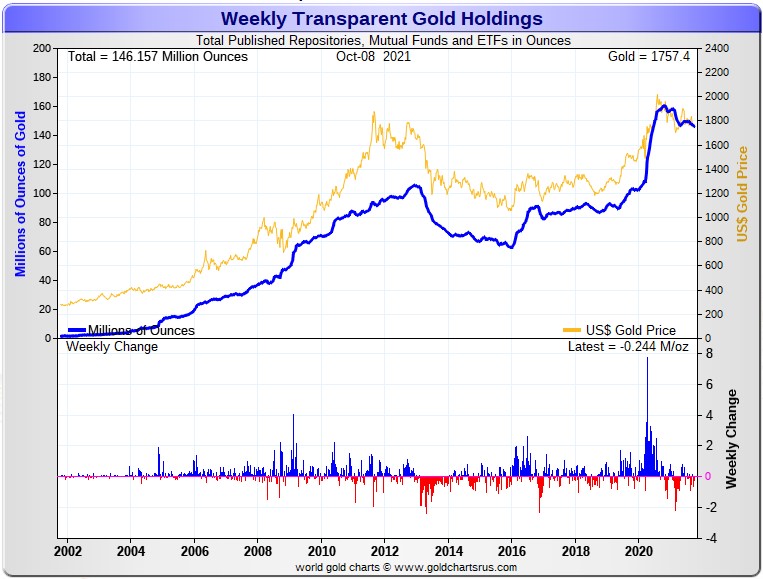
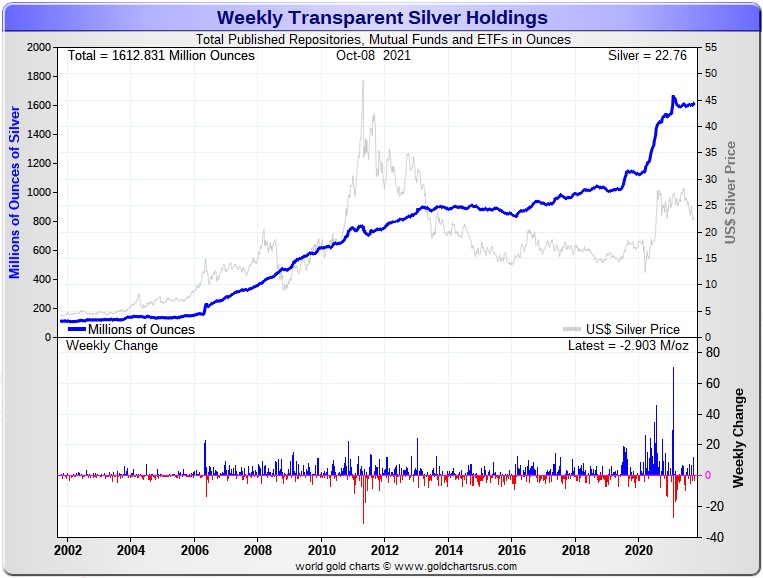
As I mention just about every week, looking at the above two charts, one would never know that eye-watering engineered price declines had ever occurred in silver and gold since mid June, as there's little sign of it in gold -- and quite the opposite in silver.
And considering the price activity over that time period, the above charts continue to show how tightly held the physical precious metals are...especially silver -- and that's despite the punishment handed out by the Big 8 commercial shorts over the last four months.
As I keep repeating, these two precious metals are being held by the strongest of hands...including ours.
![]()
The Commitment of Traders Report, for positions held at the close of COMEX trading on Tuesday, showed a bit of a decrease in the Commercial net short position silver -- and somewhat larger increase in the commercial net short position than I was expecting.
In silver, the Commercial net short position declined by 870 COMEX contracts, or 4.4 million troy ounces.
They arrived at that number by reducing their long position by 629 contracts, but they also reduced their short position by 1,499 contracts -- and it's the difference between those two numbers that represents their change for the reporting week.
Under the hood in the Disaggregated COT Report it was all Managed Money traders, as they increased their net long position by 1,120 contracts...mostly by reducing their gross short position by 1,099 contracts.
The other two groups of traders both decreased their net long positions...the Other Reportables by 1,446 contracts -- and the Nonreportable/small traders by 544 contracts.
Doing the math: 1,446 plus 544 minus 1,120 equals 870 COMEX contracts, the change in the Commercial net short position.
The Commercial net short position in silver now sits at 27,778 contracts, or 138.9 million troy ounces...down from the 143.2 million troy ounces that they were short in last week's COT Report.
The Big 8 are short 292.8 million troy ounces in this week's COT Report, down from the 302.1 million troy ounces they were short in last week's COT Report.
But as Ted has pointed out over the last several weeks, because the short position in silver is now so large, that two or possibly three Managed Money traders currently inhabit the Big 8 category...which up until three weeks ago, had only contained traders in the Commercial category. For that reason, the true short position of the Big 8 traders that matter, the big banks and investment houses, can't be computed with complete accuracy.
But the bumped commercial traders haven't disappeared, as the commercial trader that was squeezed out of the Big 4, is now in the '5 through 8' category -- and the one or two of the '5 through 8' that got bumped out by a Managed Money trader are sitting in the #9 and #10 spots on the short side. They will return to their usual positions in the Big 8 category on the next decent rally when these two or three Managed Money traders start short covering in earnest. We may have seen the start of that in early morning trading in New York yesterday morning.
As far as Ted's silver raptors are concerned, the commercial traders other than the Big 8...who are all mega net long the COMEX futures market in silver, they were sellers this past reporting week, as they decreased their net long position by around 5.0 million troy ounces/1,000 COMEX contracts.
From the numbers posted a few paragraphs ago, the Big 8 traders are short about 217 percent of the Commercial net short position. But, as I just pointed out above, this number is somewhat flawed -- and that's for the simple reason that the Big 8 are not all commercial traders now.
But even allowing for that fact, the Big 8 commercial traders have a short position just slightly below 200 percent of the Commercial net short position in silver, which is still outrageous and obscene.
Here's the 3-year COT chart for silver, courtesy of Nick Laird as always -- and this week's change barely registers. Click to enlarge.
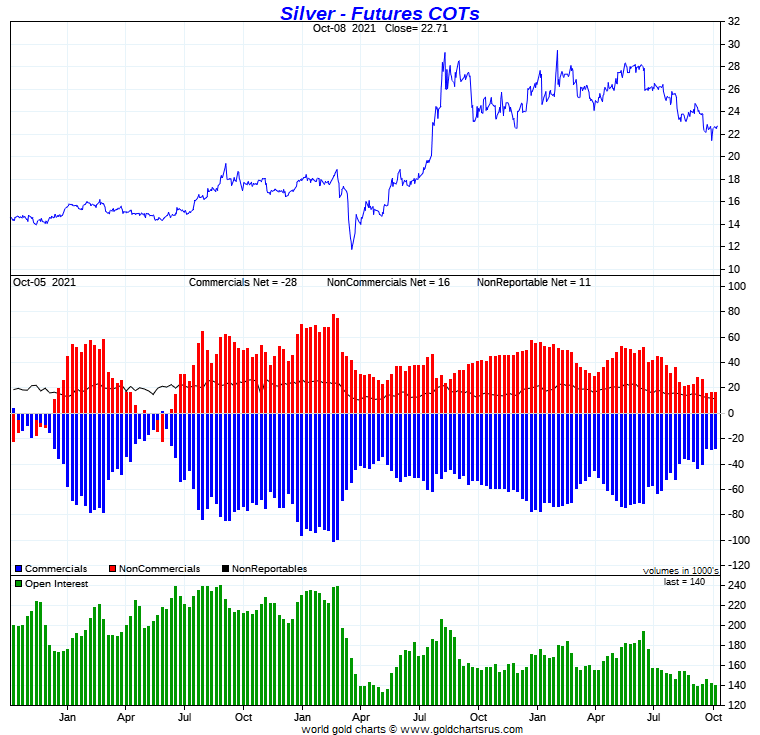
As for how much Friday's/yesterday's price action in silver changed things from a COMEX futures market perspective, that remains to be seen. Ted figures that the big rally was mostly Managed Money traders covering short positions -- and his raptors, the small commercial traders other that the Big 8 shorts, were selling long positions for profits. We won't know for sure until next Friday's COT Report -- and there are still two more reporting days left before the cut-off.
But the bigger question is...who were the sellers that capped its price and then drove it back to unchanged on the day? That won't be know until next Friday, either.
The Swap Dealers in the commercial category are still net long the COMEX futures market in silver for the third week in a row, leaving the Producer/Merchants in the commercial category, which includes all of the Big 8 commercial shorts, holding the bag on the short side. The Swap Dealers actually increased their net long position by a bit more during this reporting week as well.
And as I pointed out further up, those two or three Managed Money traders that now inhabit the Big 8 short category, will be gone in a New York minute on any decent price rally....which may have started yesterday. When that happens in earnest, the Big 8 will all be commercial traders once again -- as the two or three commercial traders bumped in this week's report will return to their usual spots.
When I spoke to Ted on the phone yesterday, he didn't feel that the commercial traders in silver were that actively involved in Friday's price action. But my question to him was...who caused the silver price to get capped and then turned sharply lower? He was of the opinion that it was possibly Managed Money traders on both sides of the price move.
But the set-up for a big rally in silver, based on the wildly bullish set-up in the COMEX futures market, is still very much intact.
As always, how big the rally is, depends entirely on what the Big 4/8 commercial traders do or don't do when the next serious rally is allowed to get under way. Will they or won't they go short again?
That's still all that matters going forward -- and for that reason, I wasn't a happy camper after the morning COMEX trading session in New York was over.
In gold, the commercial net short position increased by a fairly hefty 13,551 COMEX contracts, or 1.36 million troy ounces of the stuff.
They arrived at that number by decreasing their long position by 9,844 COMEX contracts -- and they also increased their short position by 3,707 contracts. It's the sum of those two numbers that represents their change for the reporting week.
Under the hood in the Disaggregated COT Report, it was all Managed Money traders, plus a whole bunch more, as they increased their net long position by a whopping 23,305 COMEX contracts...mostly by reducing their gross short position by 15,483 contracts, which Ted was none too happy to see on such a small price rally during the reporting week.
Of course the other two categories did the opposite, as they had to do in order to make the numbers balance. The Other Reportables decreased their net long position by a rather hefty 9,122 contracts -- and the Nonreportable/small traders decreased their net long position by 632 contracts.
Doing the math: 23,305 minus 9,122 minus 632 equals 13,551 COMEX contracts, the change in the commercial net short position.
The commercial net short position in gold now stands at 20.37 million troy ounces, up from the 19.02 million troy ounces they were short in last week's COT Report...which is still a bullish number.
The short position of the Big 8 traders is 22.59 million troy ounces, up 1,930,000 troy ounces from the 21.89 million troy ounces they were short in last week's COT Report.
But the headline commercial net short position increased by only 1,360,000 troy ounces, so that means that Ted's raptors, the small commercial traders other than the Big 8, had to have sold 1,930,000 minus 1,360,000 equals 300,000 troy ounces/3,000 COMEX contracts to make these numbers balance -- and that's what they did.
Their selling had the mathematical effect of increasing the commercial net short position by that amount...something I mentioned might happen in my Friday column.
Don't forget that despite their small size, Ted's raptors are still commercial traders in the commercial category.
From the above numbers, the Big 8 traders are short 22.59/20.37=111 percent of the commercial net short position in gold...down from the 115 percent they were net short in last week's COT Report, which means that Ted's raptors are still net long the COMEX futures market in gold -- and have been for the last five weeks in a row.
Here's Nick Laird's 3-year COT chart for gold, updated with Friday's data -- and the weekly change should be noted. Click to enlarge.
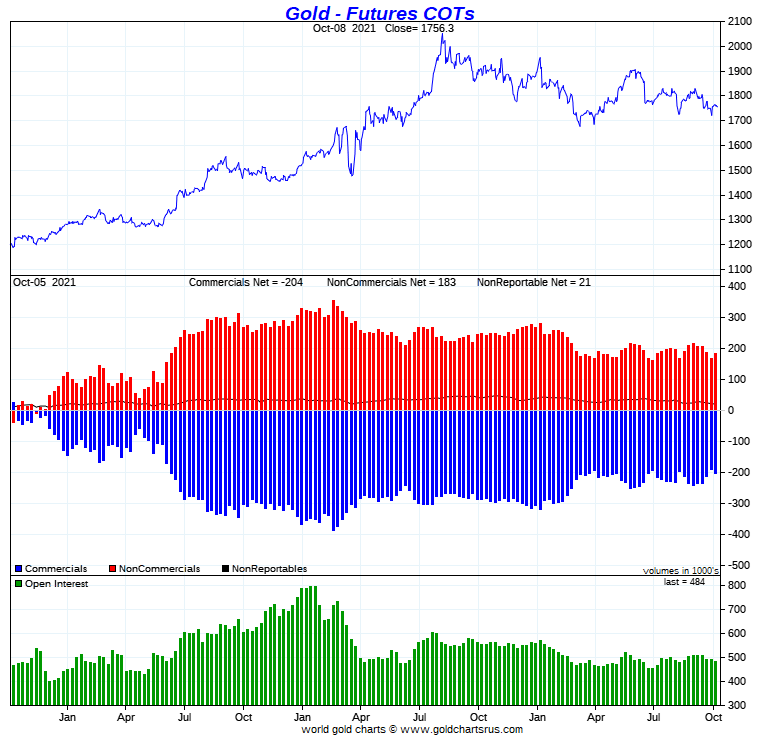
I certainly wasn't happy to see such a big increase in the commercial net short position in gold, but it is what it is and, like in silver on Friday, it was most likely Managed Money traders buying and Ted's raptors selling for profit that drove the price up on the jobs report yesterday.
But as to which group of sellers it was that responsible for its plunge back to almost unchanged on the day, that's open for debate, just like it is for silver. I'm just hoping that it wasn't the Big 4/8 shorts -- and that won't be known until next Friday's COT Report comes out.
Ted said that looking at the changes in the Big 4 longs in gold, he felt that his gold 'whale'...most likely John Paulson...stood pat with their long position, which he thinks is 35,000 contracts, or a bit more. Because of that long position, the commercial net short position in gold should actually be reduced by that much, as that position isn't going anywhere any time soon, as he's in for the long haul.
So, like in silver, gold is also set up for a big move to the upside at some point. When that happens, we'll find out if the Big 4/8 traders are about to put their heads back in the lion's mouth yet again.
In the other metals, the Managed Money traders in palladium increased their net short position by a further 189 COMEX contracts during the last reporting week -- and are now net short the palladium market by 2,483 COMEX contracts. Only the Swap Dealer category is net long palladium at the moment. In platinum, the Managed Money traders increased their net short position by by a further but paltry 344 contracts during the reporting week. They are net short the platinum market by 8,080 COMEX contracts. They, along with the Big 4/8 traders in the Producer/Merchant category, are the only categories that are net short platinum right now. The other three are mega net long, including the rest of the commercial traders in the Swap Dealer category. In copper, the Managed Money traders decreased their net long position by 3,302 COMEX contracts -- and are net long copper by 25,656 COMEX contracts...about 641 million pounds of the stuff -- and about 14 percent of total open interest...down about 2 percentage points from last week.
![]()
Here’s Nick Laird’s “Days to Cover” chart, updated with the COT data for positions held at the close of COMEX trading on Tuesday, October 5. It shows the days of world production that it would take to cover the short positions of the Big 4 — and Big '5 through 8' traders in each physically traded commodity on the COMEX.
[NOTE: As discussed in the COT Report on silver, the Big 8 traders are no longer all commercial traders/bullion banks, as there is most likely one Managed Money trader in the Big 4 category -- and one, maybe two, Managed Money traders in the '5 through 8' category...according to Ted. So keep that in mind as you read what follows...but in the overall, it doesn't change things much]
I consider this to be the most important chart that shows up in the COT series -- and it deserves a minute of your time. Click to enlarge.
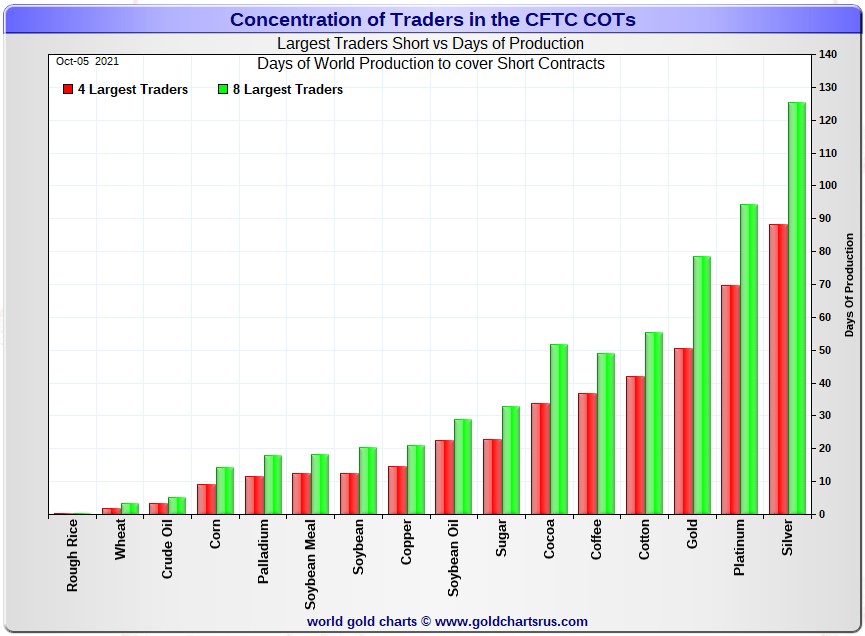
In it, the Big 4 traders are short about 88 days of world silver production which is down about 3 days from the prior week's report. The ‘5 through 8’ large traders are short an additional 37 days of world silver production...down about 1 day from the prior week's COT Report for a total of about 125 days that the Big 8 are short...and down about 4 days from last week's COT report. [In the prior reporting period they were short 129 days of world silver production.]
That 125 days that the Big 8 are short, represents around four months of world silver production, or 292.8 million troy ounces of paper silver held short by the Big 8.
In the COT Report above, the Commercial net short position in silver was reported by the CME Group at 138.9 million troy ounces. As mentioned in the previous paragraph, the short position of the Big 4/8 traders is 292.8 million troy ounces. So the short position of the Big 4/8 traders is larger than the total Commercial net short position by 292.8-138.9=153.9 million troy ounces...down 5.0 million troy ounces/1,000 COMEX contracts from last week's report.
The reason for the difference in those numbers...as it always is...is that Ted's raptors, the 28-odd small commercial traders other than the Big 8, are net long that amount...153.9 million troy ounces.
Another way of stating this [as I say every week in this spot] is that if you remove the Big 8 shorts from the commercial category, the remaining traders in the commercial category are mega net long the COMEX silver market. It's the Big 8 against everyone else...a situation that has existed for almost five decades in silver, platinum and palladium -- and now in gold for the last five weeks as well.
But don't forget that this Big 8 short position is no longer all commercial traders. But even adjusting for that, I doubt that the numbers shown above would be materially different, as the Big 8 commercial traders [the only ones that matter] are still mega short -- and the rest of the smaller commercial traders in silver, Ted's raptors above, would still be mega long.
As per the first paragraph above, the Big 4 traders in silver are short around 88 days of world silver production in total. That's about 22 days of world silver production each, on average...down 1 day from last week's COT Report. The four big traders in the '5 through 8' category are short 37 days of world silver production in total, which is a bit under 9.5 days of world silver production each, on average...down a bit from last week's COT Report.
The Big 8 traders are short 41.9 percent of the entire open interest in silver in the COMEX futures market, which is down a tiny amount from the 42.5 percent they were short in last week's COT report. And once whatever market-neutral spread trades are subtracted out, that percentage would be something just under the 50 percent mark. In gold, it's 46.7 percent of the total COMEX open interest that the Big 8 are short, which is up a bit from the 44.6 percent they were short in last week's COT Report -- and something approaching the 55 percent mark once their market-neutral spread trades are subtracted out.
In gold, the Big 4 are short 50 days of world gold production, up one day from last week's COT Report. The '5 through 8' are short 28 days of world production -- also up one day from last week's report...for a total of 78 days of world gold production held short by the Big 8 -- and obviously up 2 days from the prior COT Report. Based on these numbers, the Big 4 in gold hold about 64 percent of the total short position held by the Big 8...unchanged from the prior week's COT Report.
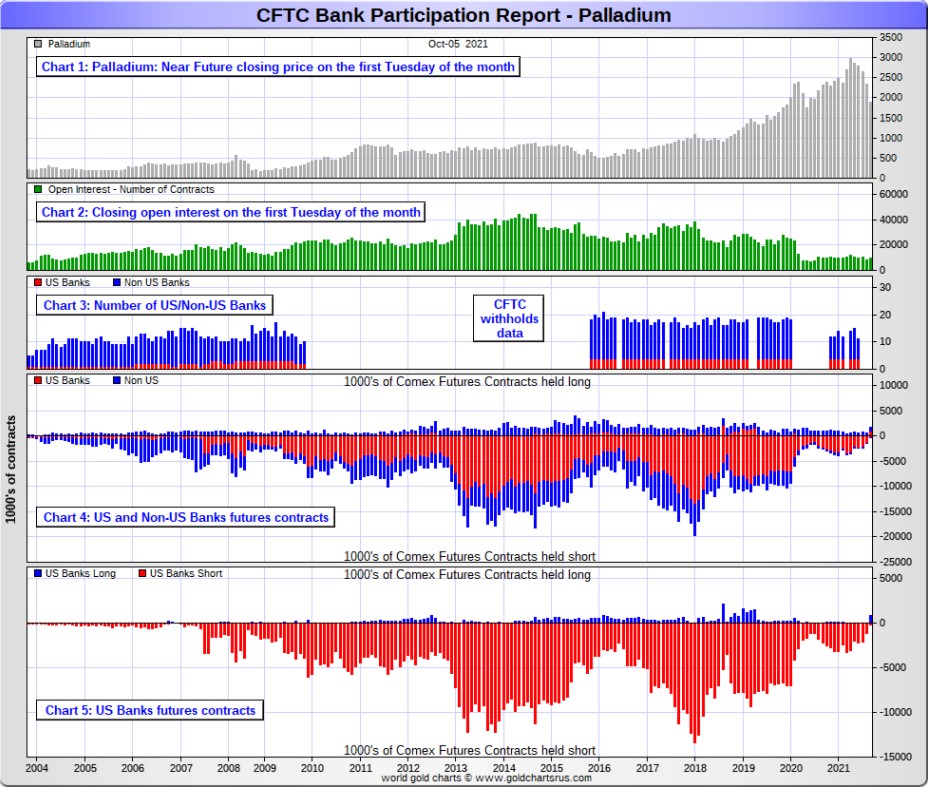
The "concentrated short position within a concentrated short position" in silver, platinum and palladium held by the Big 4 commercial traders are about 70, 74 and 61 percent respectively of the short positions held by the Big 8...the red and green bars on the above chart. Silver is down about once percentage point from last week's COT Report...platinum is also down about one percentage point from a week ago -- and palladium is down about 2 percentage points week-over-week, which is the lowest number I've ever seen in palladium. The reason for that is in today's Bank Participation Report.
Well, the Big 4/8 commercial traders are still firmly stuck on the short side in both gold and silver, even though they improved their situation in silver by a tiny bit during the reporting week.
The situation regarding the Big 4/8 commercial shorts in silver, gold [and platinum] continues to be beyond obscene, twisted and grotesque -- and as Ted correctly points out ad nauseam, its resolution will be the sole determinant of precious metal prices going forward.
![]()
The October Bank Participation Report [BPR] data is extracted directly from yesterday's Commitment of Traders Report. It shows the number of futures contracts, both long and short, that are held by all the U.S. and non-U.S. banks as of Tuesday’s cut-off in all COMEX-traded products. For this one day a month we get to see what the world’s banks are up to in the precious metals. They’re usually up to quite a bit -- and they certainly were this past month.
[The October Bank Participation Report covers the time period from September 7 to October 5 inclusive.]
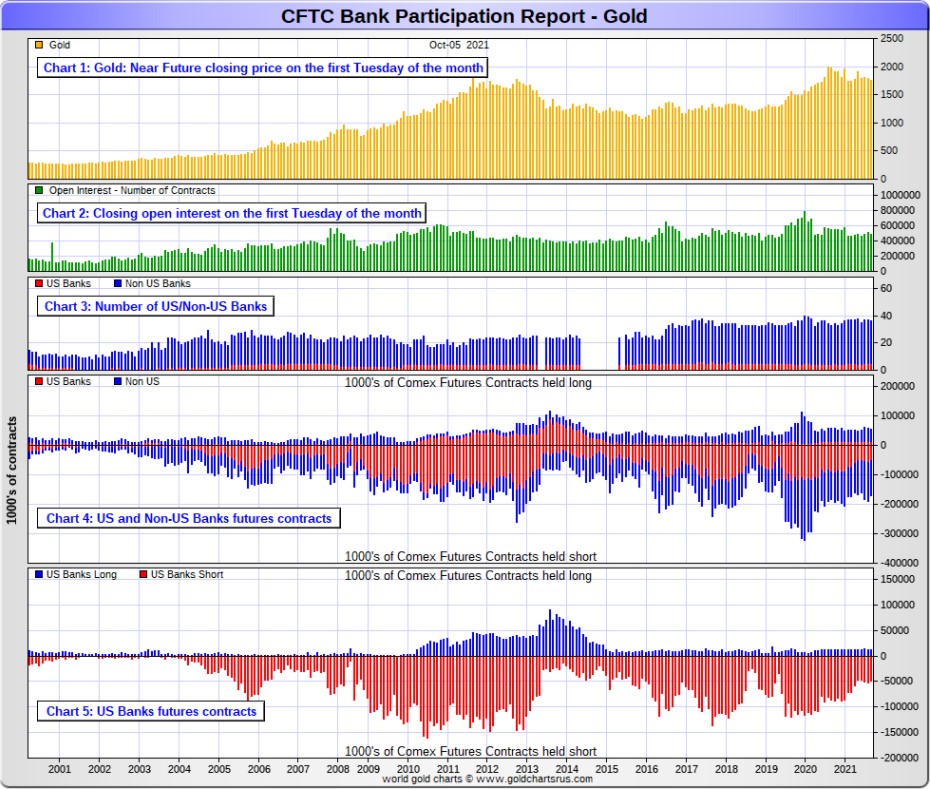
In gold, 5 U.S. banks are net short 35,832 COMEX contracts in the October BPR. In September’s Bank Participation Report [BPR] these same 5 U.S. banks were net short 41,284 contracts, so there was a decrease of 5,452 COMEX contracts...the first monthly decrease since June.
Citigroup, HSBC USA, Bank of America and Morgan Stanley would most likely be the U.S. banks that are short this amount of gold. I still have some suspicions about the Exchange Stabilization Fund as well, although if they're involved, they are most likely just backstopping these banks.
Also in gold, 31 non-U.S. banks are net short 80,389 COMEX gold contracts. In September's BPR, 32 non-U.S. banks were net short 90,674 contracts...so the month-over-month change shows a big drop of 10,285 COMEX contracts...the first monthly decrease since July.
At the low back in the August 2018 BPR...these same non-U.S. banks held a net short position in gold of only 1,960 contacts -- and they've been back on the short side in an enormous way ever since.
I suspect that there's at least two large banks in this group, one of which would be HSBC, Barclays and Deutsche Bank. I also have my suspicions about Scotiabank/Scotia Capital, Dutch Bank ABN Amro, French bank BNP Paribas, plus Australia's Macquarie Futures as well. Other than that small handful, the short positions in gold held by the vast majority of non-U.S. banks are immaterial and, like in silver, have always been so.
As of this Bank Participation Report, 36 banks [both U.S. and foreign] are net short 24.1 percent of the entire open interest in gold in the COMEX futures market, which is down a bit from the 26.0 percent that 37 banks were net short in the September BPR.
Here’s Nick’s BPR chart for gold going back to 2000. Charts #4 and #5 are the key ones here. Note the blow-out in the short positions of the non-U.S. banks [the blue bars in chart #4] when Scotiabank’s COMEX short position was outed by the CFTC in October of 2012. Click to enlarge.
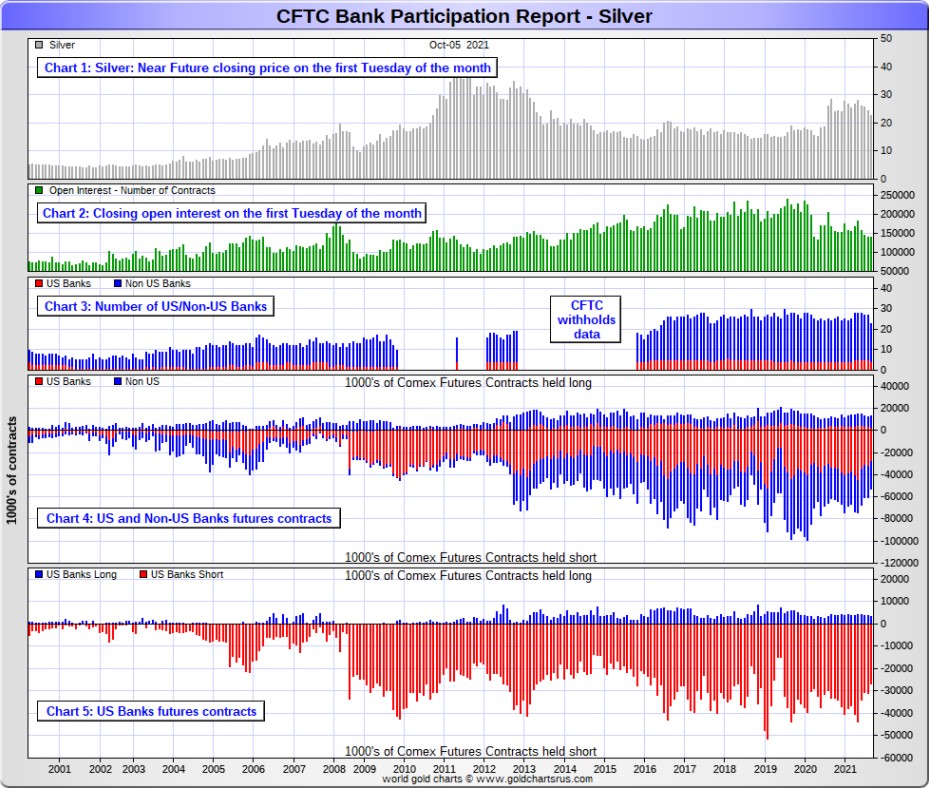
In silver, 4 U.S. banks are net short 23,579 COMEX contracts in October's BPR. In September's BPR, the net short position of 5 U.S. banks was 27,397 contracts, so the short position of the U.S. banks decreased by 3,818 contracts month-over-month.
As in gold, the four biggest short holders in silver of the five U.S. banks in total, would be Citigroup, HSBC USA, Bank of America and most likely Morgan Stanley...and NOT Goldman Sachs. And, like in gold, I'm starting to have my suspicions about the Exchange Stabilization Fund's role in all this...although, also like in gold, not directly.
Also in silver, 19 non-U.S. banks are net short 16,707 COMEX contracts in the October BPR...which is down 3,516 contracts from the 20,223 contracts that 22 non-U.S. banks were short in the September BPR.
I would suspect that HSBC and Barclays holds a goodly chunk of the short position of these non-U.S. banks...plus some by Canada's Scotiabank/Scotia Capital still. I'm not sure about Deutsche Bank. I also suspect that a number of the remaining non-U.S. banks may actually be net long the COMEX futures market in silver. But even if they aren’t, the remaining short positions divided up between these other 16 or so non-U.S. banks are immaterial — and have always been so.
As of October's Bank Participation Report, 23 banks [both U.S. and foreign] are net short 28.9 percent of the entire open interest in the COMEX futures market in silver—down a very decent amount from the 34.2 percent that 27 banks were net short in the September BPR. And much, much more than the lion’s share of that is held by Citigroup, HSBC, Bank of America, Barclays -- and Scotiabank -- and possibly one other non-U.S. bank...all of which are card-carrying members of the Big 8 shorts.
I'll point out here that Goldman Sachs has no derivatives in the COMEX futures market in any of the four precious metals.
Here’s the BPR chart for silver. Note in Chart #4 the blow-out in the non-U.S. bank short position [blue bars] in October of 2012 when Scotiabank was brought in from the cold. Also note August 2008 when JPMorgan took over the silver short position of Bear Stearns—the red bars. It’s very noticeable in Chart #4—and really stands out like the proverbial sore thumb it is in chart #5. But as of March of 2020...they're out of their short positions, not only in silver, but the other three precious metals as well. Click to enlarge.
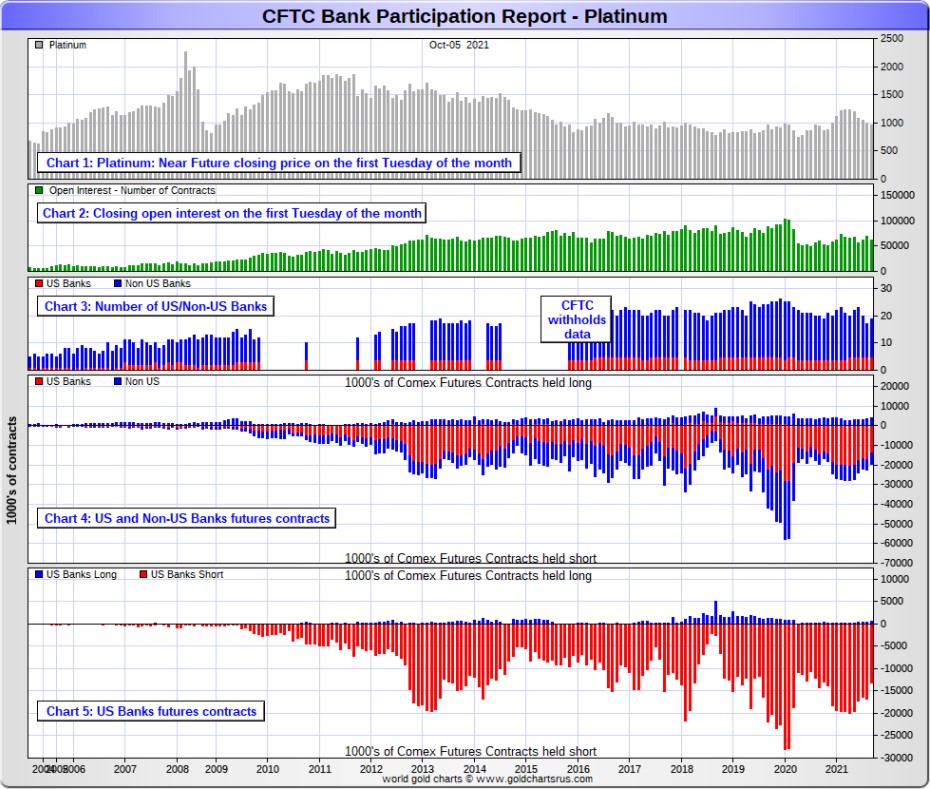
In platinum, 5 U.S. banks are net short 12,516 COMEX contracts in the October Bank Participation Report, which is down big from the 16,227 COMEX contracts that these same 5 U.S. banks were short in the September BPR.
[At the 'low' back in July of 2018, these U.S. banks were actually net long the platinum market by 2,573 contracts] So they have a loooong way to get to even getting back to market neutral...if they ever intend to, that is.
Also in platinum, 14 non-U.S. banks are net short 3,158 COMEX contracts in the October BPR, which is a negligible change from the 3,089 COMEX contracts that 12 non-U.S. banks were net short in the September BPR. This is the third month in a row that there have been no material changes in platinum by the non-U.S. banks in the COMEX future market.
[Note: Back at the July 2018 low, these same non-U.S. banks were net short only 1,192 COMEX contracts.]
And as of October's Bank Participation Report, 19 banks [both U.S. and foreign] are net short 25.2 percent of platinum's total open interest in the COMEX futures market, which is down a decent amount from the 28.0 percent that 17 banks were net short in September's BPR.
But it's the U.S. banks that are on the short hook big time -- and the real price managers. They have little chance of delivering into their short positions, although a very large number of platinum contracts have already been delivered during the last 12 months or so. But that fact, like in both silver and gold, has made no difference whatsoever to their short positions held. Their short positions in the COMEX futures market in this precious metal is as equally dire as it is in the other two precious metals...silver and gold...particularly the former.
The reason that they'll never improve their short positions in a big way is the same reason as in gold and silver...the Managed Money traders flatly refuse to go short big time like they used to in the past...although they are net short around 8,000 COMEX contracts at the moment, which is not a large amount on an historical basis.
Here's the Bank Participation Report chart for platinum. Click to enlarge.
In palladium, '3 or less' U.S. banks are now net long 706 COMEX contracts in the October BPR, which is a eye-opening change from the 1,210 contracts that these '3 or less' U.S. banks were net short in the September BPR.
Also in palladium, '9 or more' non-U.S. banks are net long 600 COMEX palladium contracts—up from the 219 contracts that these same '9 or more' non-U.S. banks were net long in the September BPR. These non-U.S. banks have been net long by a bit in palladium for the last nineteen months in a row -- and have now been joined by the U.S. banks on the long side.
And as I've been commenting for almost forever now, the COMEX futures market in palladium is a market in name only, because it's so illiquid and thinly-traded. Its total open interest at Tuesday's cut-off was only 9,705 contracts...compared to 62,109 contracts of total open interest in platinum...139,763 in silver -- and 483,789 COMEX contracts in gold.
As of this Bank Participation Report, 12 banks [both U.S. and foreign] are now net long 13.5 percent of the entire COMEX open interest in palladium...compared to the 11.6 percent of total open interest that these same 12 banks were net short in September's BPR.
And because of the small numbers of contracts involved, along with a tiny open interest, these numbers are pretty much meaningless.
But, having said that, for the last twenty-one months in a row, the world's banks have not been involved in the palladium market in a material way -- and for the first time ever, they are now net long in unison in this precious metal. Who would have thunk that!
Here’s the palladium BPR chart. Although the world's banks are now net long this precious metal, it remains to be seen if they return as big short sellers again at some point like they've done in the past. Click to enlarge.
Excluding palladium now -- and for obvious reasons, only a small handful of the world's banks/investment houses, most likely four or so in total -- and mostly U.S-based, except for HSBC, Barclays and maybe Deutsche Bank...continue to have meaningful short positions in the other three precious metals. It's a near certainty that they run this price management scheme from within their own in-house/proprietary trading desks...although it's pretty much a given that their clients are short these metals as well.
The futures positions in silver and gold that JPMorgan holds are immaterial -- and have been since March of last year. According to Ted, they're long a bit in gold -- and market neutral in silver. It's the next Big 8 shorts et al. that are on the hook in everything precious metals-related. But as I just mentioned, it's most likely only the Big 4, or maybe the Big 2 now...as the concentration data is so stark...as per the above 'Days to Cover' chart.
And as has been the case for over a year now, the short positions held by the Big 4/8 traders/banks is the only thing that matters -- and how it is ultimately resolved [as Ted said earlier] will be the sole determinant of precious metal prices going forward.
The Big 4 shorts continue to have an iron grip on precious metal prices. That will continue until they voluntarily give it up...or are told to step aside, as it now appears that there's no chance that they will ever get overrun. If that possibility had ever existed in reality, it would have happened already.
I have an average number of stories, articles and videos for you today.
![]()
CRITICAL READS
September’s jobs creation comes up short with gain of just 194,000
The U.S. economy created jobs at a much slower-than-expected pace in September, a pessimistic sign about the state of the economy though the total was held back substantially by a sharp drop in government employment.
Nonfarm payrolls rose by just 194,000 in the month, compared with the Dow Jones estimate of 500,000, the Labor Department reported Friday. The unemployment rate fell to 4.8%, better than the expectation for 5.1% and the lowest since February 2020. Click to enlarge.
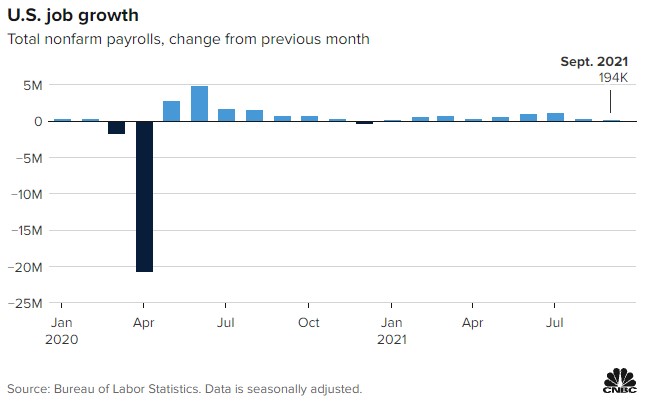
The headline number was hurt by a 123,000 decline in government payrolls, while private payrolls increased by 317,000.
The drop in the jobless rate came as the labor force participation rate edged lower, meaning more people who were sidelined during the coronavirus pandemic have returned to the workforce. A more encompassing number that also includes so-called discouraged workers and those holding part-time jobs for economic reasons declined to 8.5%, also a pandemic-era low.
“This is quite a deflating report,” said Nick Bunker, economic research director at job placement site Indeed. “This year has been one of false dawns for the labor market. Demand for workers is strong and millions of people want to return to work, but employment growth has yet to find its footing.”
This CNBC news item put in an appearance on their Internet site at 8:30 a.m. EDT on Friday morning -- and was updated a bit over two hours later. I thank Swedish reader Patrik Ekdahl for sending it our way -- and another link to it is here. The Zero Hedge spin on this, courtesy of reader B.R., is headlined "Payrolls Huge Miss: Just 194K Jobs Added in September, Even as Unemployment Rate Tumbles, Wages Rise" -- and linked here.
Fantasy Investing and Other Modern Money Madness -- Bill Bonner
We end the week as we began it… with our gast flabbered by the news.
The week was dominated by the debt ceiling hoax… in which one party earnestly tried to save the nation… while the other was determined to send it into a dark spiral of default and catastrophe.
At least, that’s the way the elite press described it.
Actually, there was never any danger of default. The feds get plenty of money from taxes to cover debt payments.
And there was never any real danger that they would fail to raise the debt ceiling.
After all, debt – selling U.S. bonds to the Federal Reserve (aka “printing money”) – is mother’s milk to both Republicans and Democrats… and the whole ruling elite.
None of them want to be weaned.
And this week, we looked more closely at how this affects its big beneficiary – Wall Street.
As intended, low interest rates forced investors to take their money out of real investments and move them to options, tech fantasies, memes, and razzmatazz speculation.
Last year, for the first time ever, option trading exceeded stock transactions.
Dick’s Sporting Goods (DKS) has doubled over the last 12 months. Tesla (TSLA) has almost completed the double, too.
Of course, Elon Musk, of Tesla fame, has famously disrupted everything. We’re not sure what Dick has disrupted… but we’re sure he’s got a good racket going, too.
This interesting commentary from Bill was posted on the rogueeconomics.com Internet site on Friday morning sometime -- and another link to it is here.
David Stockman on Why the Biden/Dem $3.5 Trillion Spending Plan Is Worse Than You Think
Every now and then Sleepy Joe channels reality, accidentally or otherwise, and did so recently in spades. When asked by a reporter how he was going to slim down his massive $3.5 trillion social spending boondoggle to bring Senator Manchin and other moderates into the “yes” column, he let the budget gimmick cat right out of the bag:
"For example—you’ve heard me say this before, but it’s relevant — when Roosevelt passed Social Security, it didn’t bear any resemblance to what it is now. And so, the idea that (what)…..gets passed is going to be the totality of what it’s going to end up being……..
……. Look, it’s very important to establish the principle — the principle that is contained in the amendment, such as childcare, the Child Tax Credit. Well, it may be that the Child Tax Credit gets altered in terms of amount. But once it’s put in place, even though it’s only for several years, it gets harder and harder to take it out. And that’s my point to people. We don’t have to get everything all at once."
So let’s cut the to the chase. The once worthy notion of 10-year budget projections has been turned into an absolute scam by the bipartisan duopoly on Capitol Hill through a gimmick called early expiration. That is, Dems tend to cause spending programs to look cheaper in the 10-year projections by having them expire in, say, year #5, while the GOP did the same thing in spades with early expiration of the 2017 tax cuts.
Of course, when these expiration dates come, they get routinely extended at the 11th hour because by then it is purportedly “unthinkable” to hit beneficiaries with a cold turkey cut or taxpayers with an unwelcome increase. Accordingly, the numbers game as between Biden’s $3.5 trillion versus Senator Manchin’s $1.5 trillion and a possible compromise somewhere between $1.9 trillion and $2.2 trillion is just Washington’s version of legislative Kabuki Theater.
This longish commentary from David appeared on the internationalman.com Internet site on Friday sometime -- and another link to it is here. Gregory Mannarino's post market close rant for Friday is linked here -- and it comes to us courtesy of reader B.R.
Brazil’s annual inflation tops 10 percent for the first time since 2016
Brazil’s consumer prices rose less than expected in September, supporting the central bank’s view that inflation peaked just above 10% and will start to slow as rising borrowing costs cool down the economy.
Inflation accelerated to 10.25% from a year ago, its fastest pace since February 2016, and to 1.16% from the month prior, the national statistics institute reported Friday. Economists expected a monthly increase of 1.25%, according to a Bloomberg survey.
Housing costs that jumped 2.6% and transport prices that rose 1.8% were the major contributors to the monthly gain, the statistics agency said. Brazil’s central bank targets inflation at 3.75% for this year, and 3.5% for 2022.
The central bank has lifted borrowing costs by 425 basis points since March in an effort to slow inflation brought on by the reopening of the economy. However, rising energy bills due to a severe drought and spiking commodity costs have pressured prices further. Investor concern over the government’s budget has contributed to the Brazilian currency’s slide in the second half of 2021, adding pressure to prices of imported goods.
In recent days, central bank chief Roberto Campos Neto has said that inflation should start to slow in October as policy makers work to hit their 2022 target.
This Bloomberg story showed up on their website at 5:08 a.m. PDT [Pacific Daylight Time] on Friday morning -- and was updated about an hour later. I thank Patrik Ekdahl for his second offering in today's column. Another link to it is here.
Sweden’s Economy Shrinks Much More Than Expected on Exports
Sweden’s economy shrank far more than anticipated in August, driven by a slump in exports, raising concerns the recovery of the largest Nordic economy may be cut short.
Gross domestic product contracted 3.8% in August, the biggest fall since the monthly indicator was launched in February, according to a flash estimate from Statistics Sweden. Economists surveyed by Bloomberg predicted a 0.5% decline.
The Swedish krona extended its decline to trade 0.5% weaker against the euro after the data, which may vindicate the central bank view that it’s still too soon to dial-back the pandemic-era stimulus. The Riksbank has resisted the temptation to signal when it would raise borrowing costs above zero, defying a hawkish turn among major central banks.
“Today’s reading is obviously not in favour of an upwards move of the rate path,” DNB economist Oddmund Berg said in a research report. He said the Riksbank’s projection for 2.3% rise in third-quarter GDP now looks “a bit too optimistic.” Still, “the overall outlook for the Swedish economy is good,” he added.
Sweden’s economy, which regained its pre-pandemic size faster than most industrialized nations, is being increasingly hit by supply-chain bottlenecks. The trade deficit widened last month to highest level in five years, with exports falling to the lowest level since January.
The above five paragraphs are about all there is to this Bloomberg story from Friday that was picked up by the folks over at the finance.yahoo.com Internet site -- and it's another contribution from Patrik Ekdahl. Another link to it is here.
"Catastrophic" Property Sales Mean China's Worst Case Scenario is Now in Play
No matter how the Evergrande drama plays out - whether it culminates with an uncontrolled, chaotic default and/or distressed asset sale liquidation, a controlled restructuring where bondholders get some compensation, or with Beijing blinking and bailing out the core pillar of China's housing market - remember that Evergrande is just a symptom of the trends that have whipsawed China's property market in the past year, which has seen significant contraction as a result of Beijing policies seeking to tighten financial conditions as part of Xi's new "common prosperity" drive which among other things, seeks to make housing much more affordable to everyone, not just the richest.
As such, any contagion from the ongoing turmoil sweeping China's heavily indebted property sector will impact not the banks, which are all state-owned entities and whose exposure to insolvent developers can easily be patched up by the state, but the property sector itself, which as Goldman recently calculated is worth $62 trillion making it the world's largest asset class, contributes a mind-boggling 29% of Chinese GDP (compared to 6.2% in the US) and represents 62% of household wealth.
It's also why we said that for Beijing the focus is not so much about Evergrande, but about preserving confidence in the property sector.
But first, a quick update on Evergrande, which - to nobody's surprise - we learned today is expected to default on its offshore bond payment obligations imminently according to investment bank Moelis, which is advising a group of the cash-strapped developer’s bondholders. Evergrande, which is facing one of the country’s largest defaults as it wrestles with more than $300 billion of debt, has already missed coupon payments on dollar bonds twice last month.
With that background in mind, let's move on to the truly chilling latest developments: it now appears that China does not need Evergrande to officially default to unleash a property crisis - one has already arrived.
We bring readers' attention to a little noticed report in Shanghai Securities News, citing China Real Estate Information Corp. research (link), which revealed that more than 90% of China’s top 100 property developers’ sales declined in September by an average of 36% from the same period last year. According to the report:
- Sept. sales totaled 759.6b yuan ($118BN), down 36.2% from September 2020 and 17.7% lower from the same period in 2019, deepening a downward spiral that started in July
- Among companies, 60% of developers saw sales decrease by more than 30% y/y in Sept.
- Beijing, Shenzhen and Guangzhou saw transaction volume of residential properties decline 30% y/y, while Shanghai fell 45%
We had to do a double take when we saw this because these are absolutely terrifying numbers and are, to put it bluntly, scarier than Goldman's "worst case scenario"; what's worse this sudden collapse in China's property market is taking place before Evergrande has even defaulted, an event which would lead to a glacial freeze in the property market as potential buyers hold off expecting liquidation fire sales from the property giant in hopes of getting bargains. The problem is that in addition to being the world's largest asset, China's property market is also the world's largest Ponzi scheme, and without constant inflow of new capital it would implode, especially when factoring in the 90 million vacant apartment which just sit inert and which would promptly be dumped by anxious owners, flooding the market with excess inventory and sending prices crashing.
This very long and chart-filled article showed up on the Zero Hedge website at 8:46 p.m. EDT on Friday evening -- and I thank reader B.R. for this one. Another link to it is here.
Another big miss for non-farm payrolls, with September’s 194,000 jobs gain less than half the 500,000 forecast. But with the Unemployment Rate down to 4.8% and Average Hourly Earnings up 4.6% y-o-y (not to mention almost 11 million job openings), there is ample evidence that much of the labor market has turned exceptionally tight. The Senate passed debt ceiling legislation that should kick the can until early December. But let’s skip immediately to the week’s pressing developments.
It’s turning into a debacle. Evergrande bonds ended the week at 20 cents on the dollar, with yields surging to 72.5%. China’s real estate sector was hammered this week following the surprise default by mid-sized developer Fantasia Holdings.
Many major developers have lost access to new finance, while real estate transactions throughout China have slowed dramatically. Mounting evidence suggests China’s historic apartment Bubble has been pierced. Now it’s a matter of how rapidly prices deflate. There appears no place to hide. Country Garden Holdings, China’s largest developer, saw yields (7.25%, 2026) surge 181 bps this week to 7.60%. Yields for this perceived pristine, investment-grade credit began September at 4.74%.
An index of Chinese high-yield dollar bonds was pummeled, with yields surging 310 bps this week to 17.5%. This index yielded 8.20% at the end of May, and 12.0% to conclude August. For further perspective, this yield briefly spiked to 14.0% during the March 2020 pandemic crisis (back down to 8% by August).
China's sovereign CDS rose a notable five this week to 52.5 bps – the highest level since June 2020. China CDS began September at 32.5. This is one to watch. For comparison, South Korea CDS ended the week at 20 bps, with Thailand at 43 bps and Malaysia at 60 bps. For a system as egregiously levered as China, spiking market yields and CDS prices are analogous to a blitzkrieg of tiny pins attacking a bloated, time-worn and thin-skinned Bubble.
This very worthwhile commentary from Doug was posted on his website very early on Saturday morning -- and another link to it is here.
Lost in the 'Twilight Zone,' Peter Schiff can't understand why gold doesn't keep up with inflation
Market analyst, fund manager, and gold advocate Peter Schiff can't figure out why the price of gold isn't soaring along with inflation.
Schiff's purported puzzlement is pathetic and a huge loss to gold's cause, since he is favored as an analyst by some major news organizations.
But then maybe they favor Schiff as an analyst precisely because he affects not to be able to figure out gold's counterintuitive performance.
Maybe it's the same way with another market analyst and gold advocate favored by major news organizations, James Grant of Grant's Interest Rate Observer, who understands perfectly well the insanity of the world financial system but studiously avoids getting to the center of it -- gold price suppression policy.
Well, dear reader, Peter is so full of it that his eyes are brown. It has been explained to him in person many times at the various GATA functions that he's attended over the years, so he knows perfectly well what the score is. But he won't say anything in public because his TV appearances on the major news networks in the U.S. would vanish in a New York minute the moment he acknowledged the obvious. Another word that describes his "puzzlement" is 'hypocrisy'.
This 59-minute audio commentary from Peter put in an appearance on his website on Friday -- and I found it embedded in a GATA dispatch. Another link to it is here.
Wallstreetsilver interviews your humble scribe
Jim and Ivan of reddit.com/Wallstreetsilver fame spent about 25 minutes discussing the current situation in the precious metals market with me on Tuesday -- and it was posted on the youtube.com Internet site on Friday afternoon. Another link to it is here.
![]()
The Photos and the Funnies
On October 25 we took a trip to the lower mainland in B.C. to catch the last of the fall colours before winter set in. The first shot is looking across the Fraser River -- and as you can see, even these lower mountains have their first dusting of snow already. Photo two was from the exact same spot, except looking in the opposite direction...mostly southeast. The mountains are somewhat more substantial in this direction. Photos three and four were taken along the grass airstrip [YHE] just west of Hope...as were photos one and two. The Vancouver Soaring Association flies its sailplanes out of here. At one time in the distant past, I was licensed instructor in those things. Where have all those years gone? Click to enlarge.



![]()
The WRAP
"There are decades where nothing happens; and there are weeks where decades happen" -- Vladimir Lenin
Today's pop 'blast from the past' is another one where neither the group nor the song need any introduction whatsoever -- and the link is here. It almost goes without saying that there's a bass cover for this -- and that's linked here.
Today's classical blast from the past is one I've feature before on many occasions -- and here it is again. It's Sergei Rachmaninoff's Piano Concerto No. 2 in C minor, Op. 18.
He composed it between the autumn of 1900 and April 1901. The second and third movements were first performed with the composer as soloist on 2 December 1900.
The complete work was premiered, again with the composer as soloist, on 9 November 1901 -- and was enthusiastically received.
This concerto earned the composer a Glinka Award, the first of five awarded to him throughout his life, and a 500-rouble prize in 1904. The positive reception was a significant catalyst in the advancement of his recovery from continual depression.
If you took a poll amongst all classical music lovers, there's no doubt in my mind that this piano concerto would come out on top above all others -- and by a very wide margin. When I was on the programming committee with the Board of Directors of the Edmonton Symphony Orchestra, this concerto would guarantee a sold-out house on both nights. And if I could arrange it, I would be there for both of them -- and as many of the rehearsals as I could find time for.
Here's the incomparable Anna Federova doing the honours with the Nordwestdeutsche Philharmonie. Martin Panteleev conducts. It doesn't get any better than this -- and the link is here.
Well, there's not doubt in my mind, nor in most others, that the powers-that-be/the Big 4/8 shorts, call them what you will, were at battle stations in a lot of markets yesterday -- and it was most egregious in silver and gold, as the screaming rallies in both were crushed before they got too far.
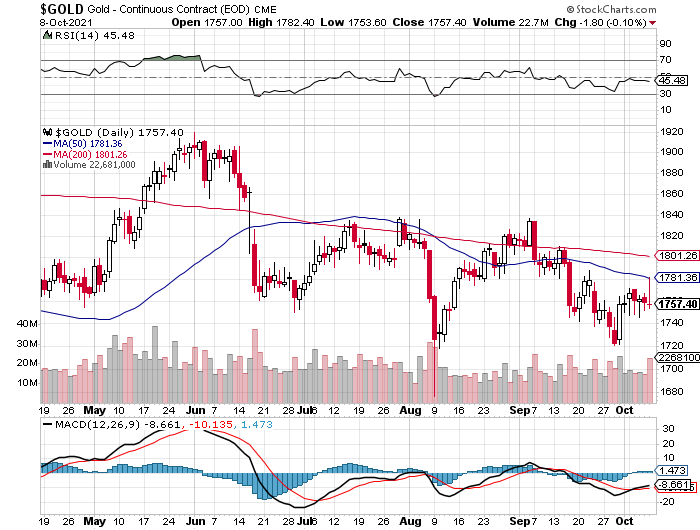
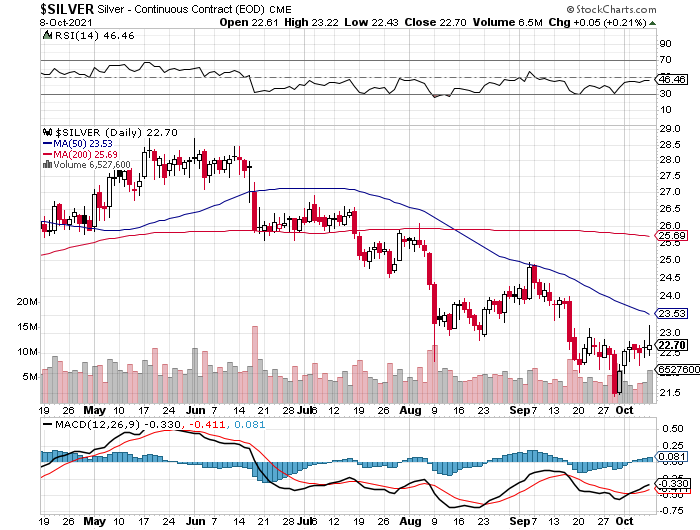
Gold was allowed to break above its 50-day moving average by about a dollar, before it was hammered flat -- and silver's rally came nowhere near any moving average that mattered, but suffered the same fate nonetheless.
Looking at the December close in gold, its current front month, it was actually closed lower on the day by $1.80 an ounce.
But no such extreme fates awaited the rallies in either platinum and palladium. True, 'da boyz' showed up in platinum at the same time as they did in gold and silver, but their hand wasn't nearly as heavy in this precious metal. And just looking at the Kitco price chart for palladium, it certainly looks like their hand was visible there as well, but it was ever so light.
Platinum blasted above -- and closed well above its 50-day moving average on Friday. Palladium is still miles below and moving average that matters, but is already about two hundred bucks off its low tick of three days ago. Most likely the rallies in both involved short covering by the Managed Money traders...a fact that won't be know with certainty until next Friday's COT Report.
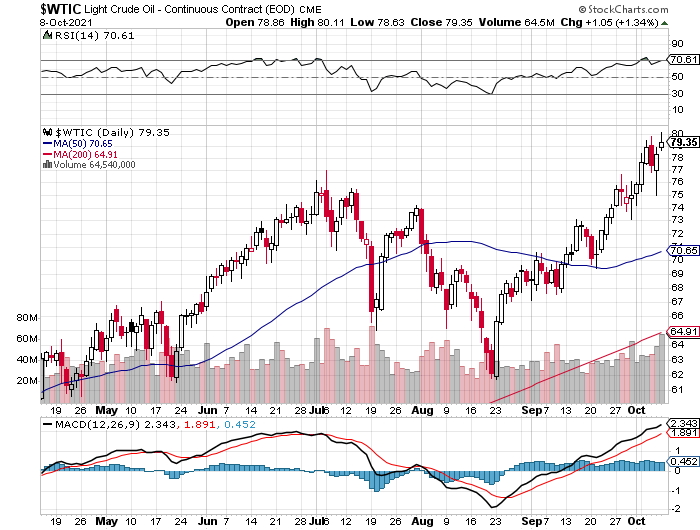
Copper traded above its 50-day moving average during the Friday trading session, but was sold lower and closed right on it -- and WTIC closed at a new high for this move up...up $1.05/barrel -- and closing above $79 spot.
Here are the 6-month charts for the Big 6 commodities, thanks to stockcharts.com as always -- and the changes, or lack thereof, in all six should be noted. Click to enlarge.


As unhappy as I was to see what appeared to be the big shorts show up in gold and silver yesterday, the one saving grace was that there was no big blow-out in total open interest in either yesterday...only inconsequential increases...under 500 contracts in each.
I would have really been concerned if total open interest in each had increased by very large numbers, but that didn't happen. So it appears that whatever long buying and shorting was going on, was a market-neutral event for the most part.
Of course that won't be known for sure until we see next Friday's COT Report. There are still two more trading days left in the reporting week, Monday and Tuesday -- and anything can happen between now and then.
But one thing is clear -- and that is that the powers-that-be aren't yet ready to release silver and gold prices from their iron grip.
The gold price has been engineered generally lower ever since its $2,000+ high tick of very early August last year -- and silver, since mid-June of this year. Here are the 2-year charts of each to put what I just spoke of in some perspective. Click to enlarge.
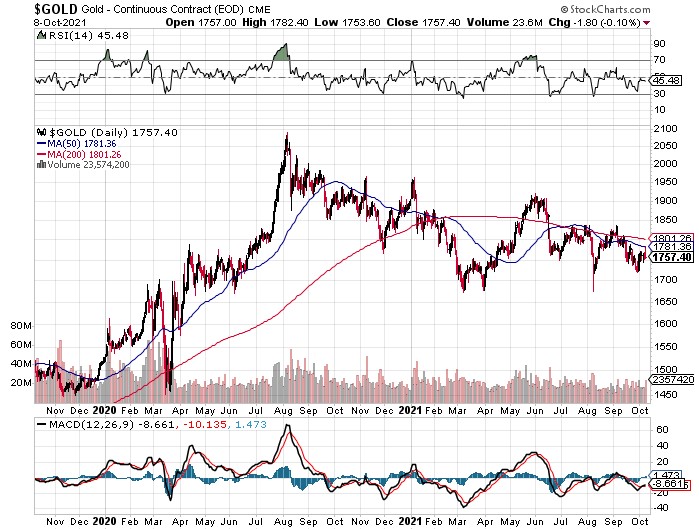
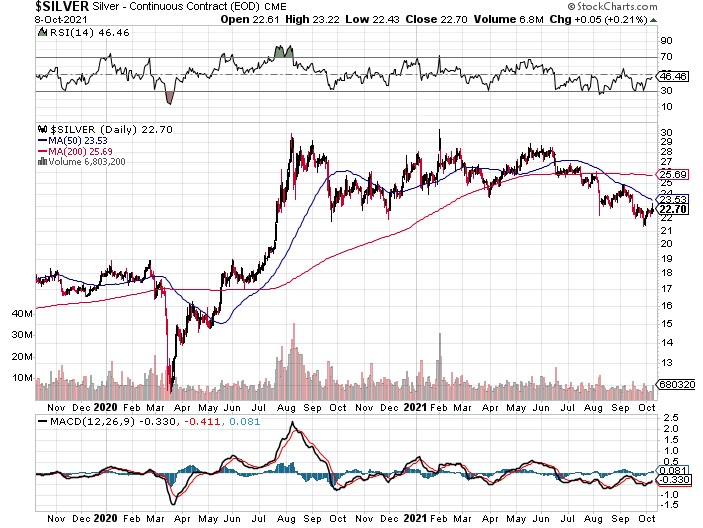
As Ted Butler said at the time back in late March/early April of 2020...those big engineered price spikes lower in mid-March of that year, was JPMorgan's criminal genius of ridding itself of the remaining short positions it inherited from its take-over of Bear Stearns thirteen years prior.
Since mid-March 2020, it's been the Big 7+1 traders that now make up the 'new' Big 8 -- and all the price activity since has been on their watch...sans JPMorgan.
They've managed to whittle down their short positions by decent amounts since then, but since the Managed Money traders are no longer willing to go short with abandon like they did up until several years ago, there are limits to how much more blood the 'new' Big 8 traders can get out of these particular stones. It appears that we are at, or very close to them now.
According to Ted, the set up in the COMEX futures market hasn't been this bullish since back in 2019 in both gold -- and particularly silver, when their respective prices were much lower than they are today.
When this covert method of controlling precious metal prices in the COMEX futures market started way back in the early 1970s, it was obvious that no thought was ever given as to what kind of exit strategy might be necessary at some point down the road.
All the folks that dreamed up this scheme way back then are no longer with us -- and those that have picked up the price management torch in their stead, have been kicking this particular can down the road ever since.
Now faced with an obviously inflationary Federal Reserve policy on one hand -- and the even more imperative supply/demand crisis in silver on the other...brought into sharp focus by the reddit.com/Wallstreetsilver apes at the beginning of this year...they're scrambling to get out.
And if that meant they had to play Whac-A-Mole on Friday in gold and silver to stave off disaster one more day, that's what they did.
The Big 4/8 traders have been on a mission since mid June to extricate themselves as much as possible from their remaining short positions in the four precious metals. They'll never get out whole -- and it only remains to be seen how much flesh gets ripped off their bones as they exit stage left.
And whether that's next week or next month, matters not. Because after almost 50 years of this, what's a few more weeks or months?
The writing is on the wall for these big shorts -- and they know it. The best we can do is sit back and watch as they thrash about, as the inevitable end approaches.
And whether that is by design or by circumstance, is of no concern to us. But the fact that it will end -- and soon, is all we need to know.
I'm still "all in" -- and I'll see you here on Tuesday.
Ed


