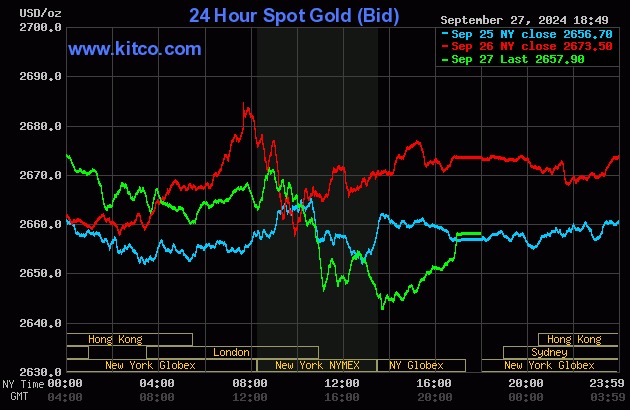
The gold price had a quiet, broad and uneven down/up move in early Globex trading...ending around noon China Standard Time on their Friday. It was then sold lower until the 10:30 a.m. morning gold fix in London -- and then rallied until 8:45 a.m. in COMEX trading in New York. It was engineered two uneven steps lower from that juncture until its low tick was set about ten minutes after the 1:30 p.m. COMEX close. It crept quietly higher from there until it popped even higher during the last ten minutes of trading...so much so that a short seller of last resort was forced to appear a couple of minutes before the market closed at 5:00 p.m. EDT.
The high and low ticks in gold were reported by the CME Group as $2,672.10 and $2,641.70 in the October contract -- and $2,696.90 and $2,665.30 in December. The October/December price spread differential in gold at the close in New York yesterday was $23.80...December/ February was $21.80... February/April was $17.70 -- and April/June was also $17.70 an ounce.
Gold was closed in New York on Friday afternoon at $2,657.90 spot, down $15.60 on the day... fifteen or so dollars off its low tick -- and sixteen buck off its high. Net volume was on the heavier side at a bit over 183,500 contracts -- and there were just about 13,000 contracts worth of roll-over/switch volume out on top of that.
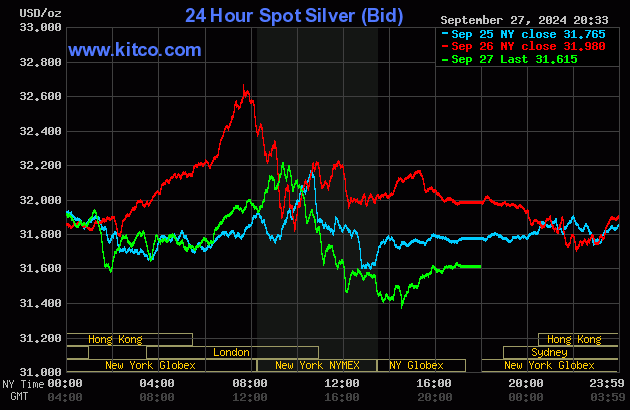
Silver's broad down/up move in early Globex trading ended shortly after 1 p.m. CST on their Friday afternoon -- and it was sold lower until minutes before 2 p.m. CST. It began to head higher from there -- and was capped for the final time around 9:20 a.m. in COMEX trading in New York. It was engineered lower from that point until around 12:05 p.m. EDT -- and its quiet up/down move from there ended a minute or so after 2:30 p.m. in after-hours trading at its low tick of the day. It crawled quietly higher until 3:55 p.m. -- and didn't do much after that.
The high and low ticks in silver were recorded as $32.59 and $31.635 in the December contract ...an intraday move of 95.5 cents...over 3 percent. The October/December price spread differential in silver at the close in New York yesterday was 29.7 cents...December/March was 38.4 cents -- and March/May was 22.5 cents an ounce.
Silver was closed on Friday afternoon in New York at $31.615 spot, down 36.5 cents on the day...31.5 cents off its Kitco-recorded low tick -- and 63.5 cents off its high. Net volume was a bit on the heavier side at 72,000 contracts -- and there were around 3,100 contracts worth of roll-over/switch volume out of December and into future months in this precious metal...mostly into March and May25.
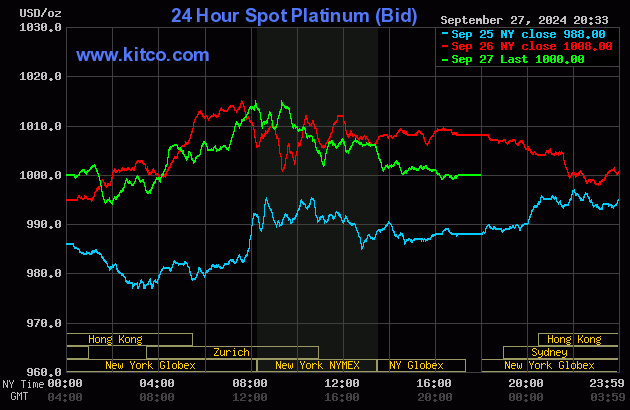
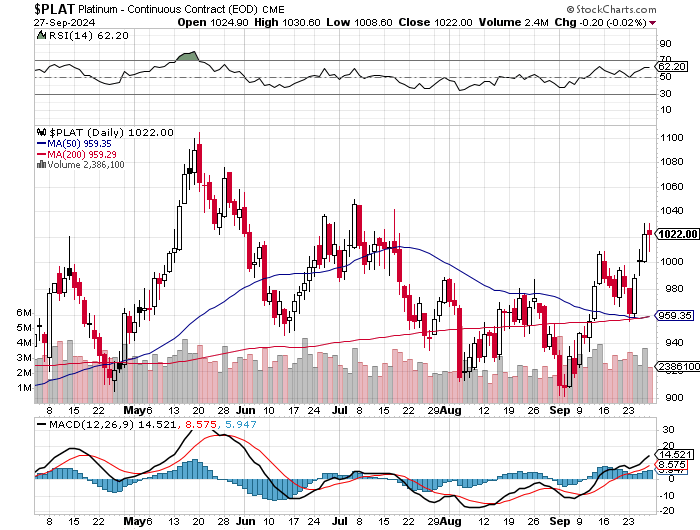
Platinum was sold two quiet and somewhat uneven steps lower until around 1:45 p.m. China Standard Time in Globex trading on their Friday afternoon -- and shortly after that it began to wander/chop unevenly higher until it ran into 'something' about five minutes or so before the 8:20 a.m. COMEX open in New York. About an hour later its engineered price decline commenced -- and that lasted until about an hour before the market closed at 5:00 p.m. EDT. Platinum was closed at $1,000 spot, down 8 bucks on the day -- and 15 dollars off its Kitco-recorded high tick.
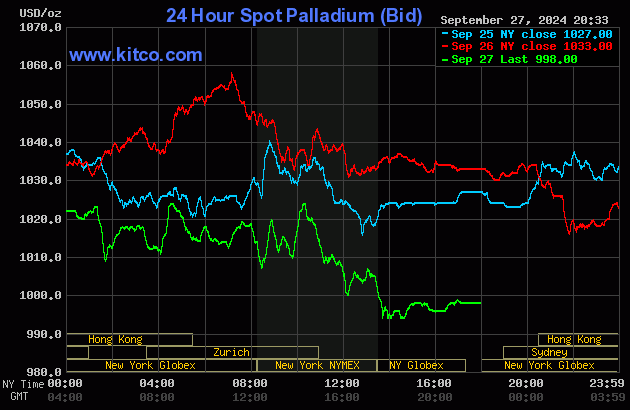
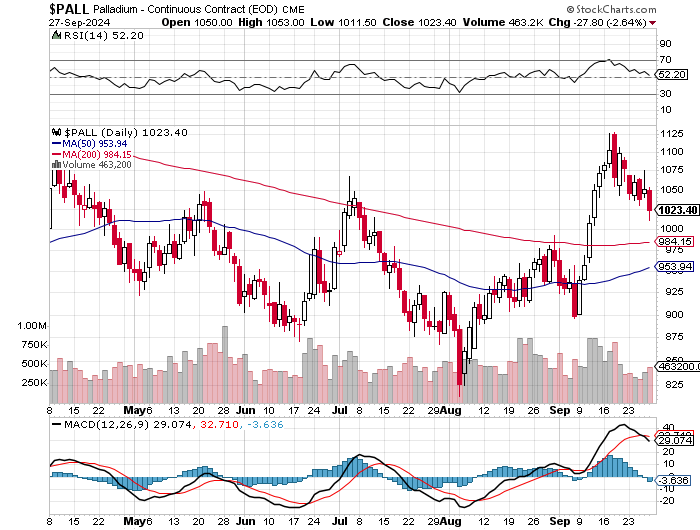
Palladium's price path was about the same as platinum's up until around 1:45 p.m. CST on their Friday afternoon -- and from there it chopped erratically sideways to a bit higher until around 10:10 a.m. in COMEX trading in New York. It was sold lower from that juncture until about ten minutes after the 1:30 p.m. COMEX close -- and it ticked a few dollars higher from that point until trading ended at 5:00 p.m. EDT. Palladium was closed at $998 spot, down 35 bucks from its close on Thursday.
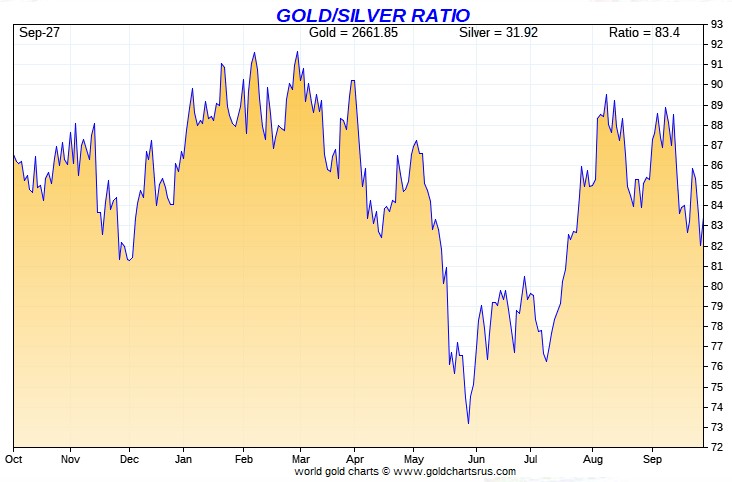
Based on the kitco.com spot closing prices in silver and gold posted above, the gold/silver ratio worked out to 84.1 to 1 on Friday...compared to 83.6 to 1 on Thursday.
Here's the 1-year Gold/Silver Ratio Chart...courtesy of Nick Laird and, for whatever reason, the Friday data point is not on it. Click to enlarge.
![]()
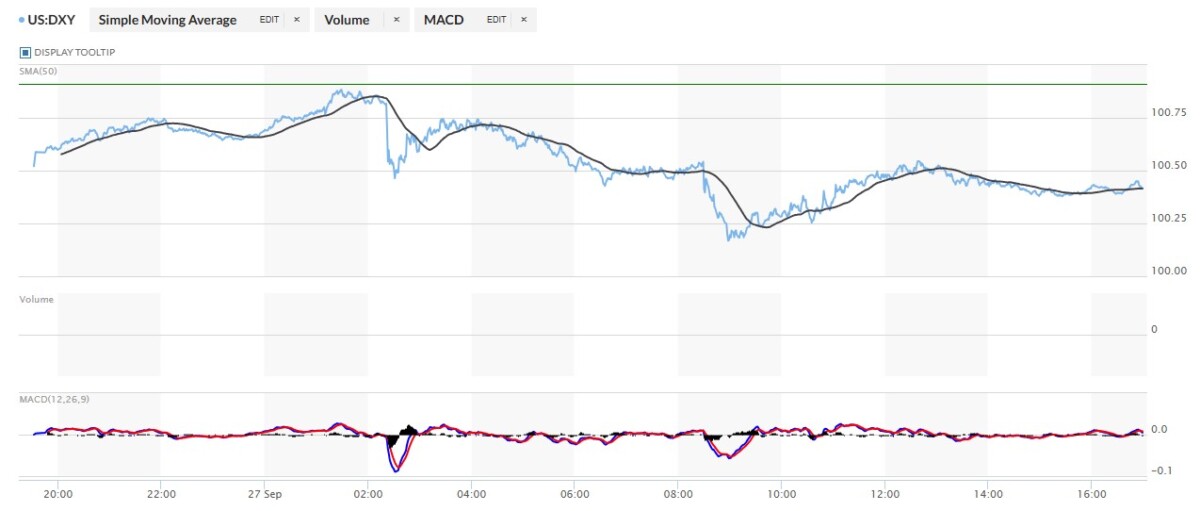
The dollar index was marked-to-close on Thursday afternoon in New York at 100.52 -- and then opened unchanged once trading commenced at 7:32 p.m. EDT on Thursday evening, which was 7:32 a.m. China Standard Time on their Friday morning. It took two very broad steps higher from that juncture until its high tick...100.88...was set around 1:28 p.m. CST. It edged a hair lower from there -- and then dropped like a rock at 2:32 p.m. Its quiet and ensuing rally from that point was rolled over around 9:07 a.m. in London -- and it then took one broad step lower until it fell out of bed anew on the PCE news. 'Gentle hands' appeared at 9 a.m. -- and guided it higher until 12:40 p.m. It then edged a bit lower until around 3:25p.m. --- and didn't do much after that.
The dollar index finished the Friday trading session in New York at 100.38...down 14 basis points on the day.
Here's the DXY chart for Friday...thanks to marketwatch.com as usual... Click to enlarge.
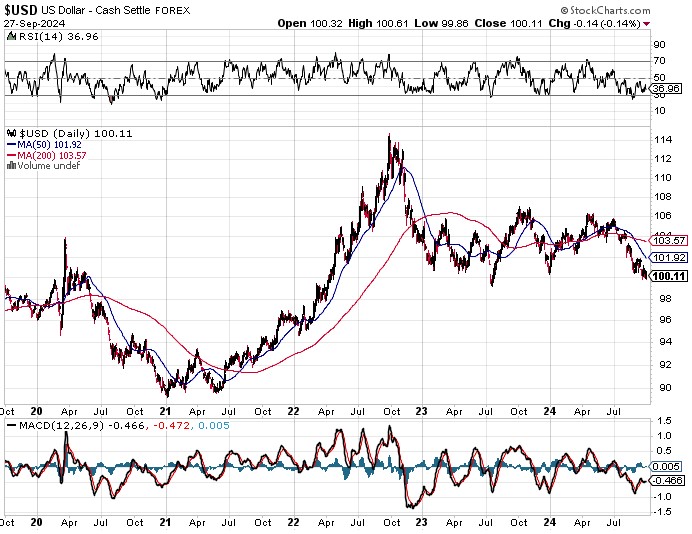
And here's the 5-year U.S. dollar index chart that appears in this spot every Saturday column, courtesy of stockcharts.com as always. The delta between its close...100.11...and the close on the DXY chart above, was 27 basis points below that. Click to enlarge.
It was obvious that 'da boyz' stepped on gold and silver prices hard in early COMEX trading...helped along by their phony baloney 'rally' in the dollar index that they cooked up thirty minutes after that PCE news hit the tape.
U.S. 10-year Treasury: 3.7490%...down 0.0420 (-1.1079%)...as of the 1:59 p.m. CDT close
Here's the 5-year 10-year U.S. Treasury chart from the yahoo.com Internet site -- which puts the yield curve into a somewhat longer-term perspective. Click to enlarge.
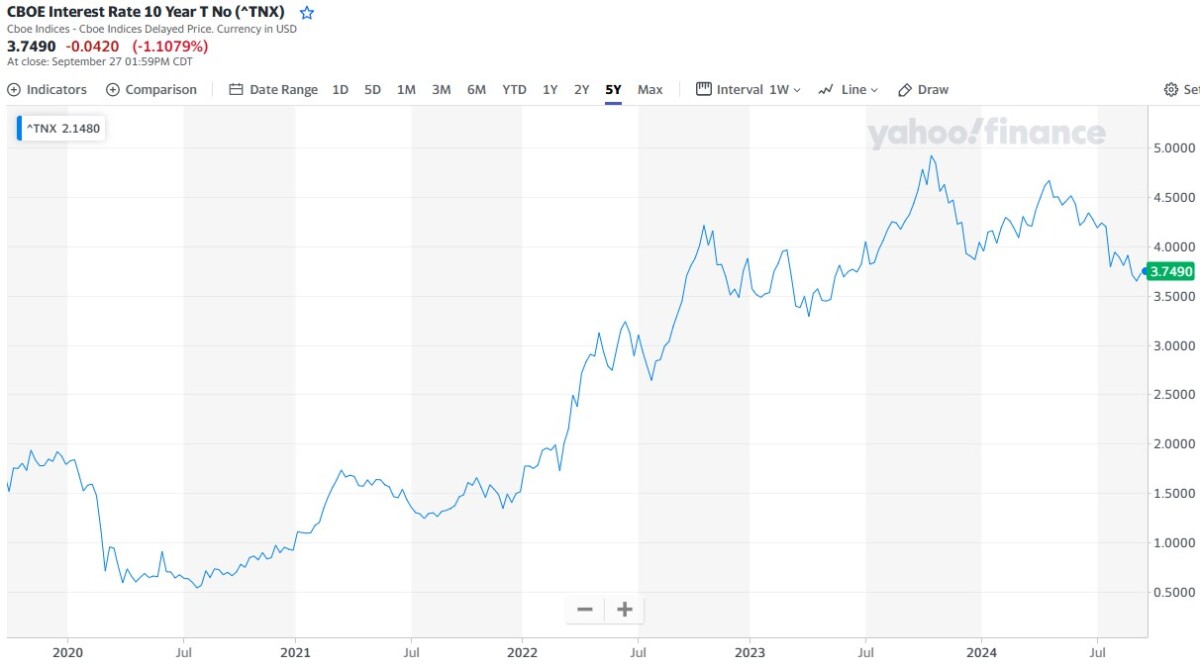
The ten-year was down less than 2 basis points on the week...but until the Fed put its foot down hard at 9:20 a.m. CDT on Thursday morning, it was about 4.5 basis points. The interventions in the treasury market are becoming ever more blatant as time moves along.
![]()
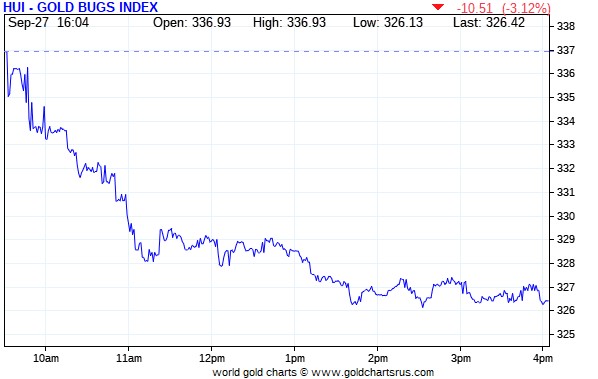
The gold shares were sold lower right out the gate once trading commenced at 9:30 a.m. in New York on Friday morning -- and the rate of descent slowed starting around 11:15 a.m. -- and from around 1:45 p.m. onwards, they wandered quietly sideways until the markets closed at 4:00 p.m. EDT. The HUI closed down 3.12 percent.
The silver shares got clubbed pretty good on Friday, as Nick Laird's 1-year Silver Sentiment Index closed down 4.08 percent. Click to enlarge.
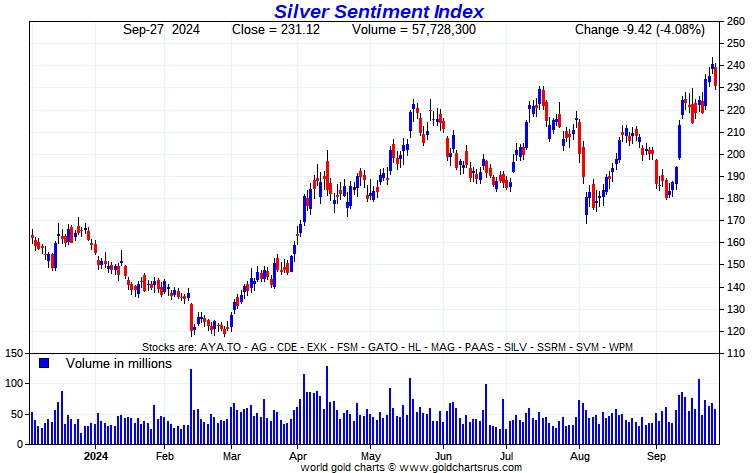
The star yesterday was Silvercorp Metals, as it closed unchanged on the day -- and there was this news from them after the markets closed on Friday. Four of the silver stocks were in the doghouse yesterday...closing down over 5 percent each...Hecla & Coeur Mining, Fortuna Silver and SilverCrest Metals.
One has to suspect that there was a lot of margin call selling in the precious metal stocks yesterday -- and it was obviously far more prominent with some of the silver shares.
Except for that item from Silvercorp Metals, I didn't see any news yesterday on any of the other silver companies that comprise the above Silver Sentiment Index.
The silver price premium in Shanghai over the U.S. price on Friday was 9.58 percent.
The reddit.com/Wallstreetsilver website, now under 'new' but not improved management, is linked here. The link to two other silver forums are here -- and here.
![]()
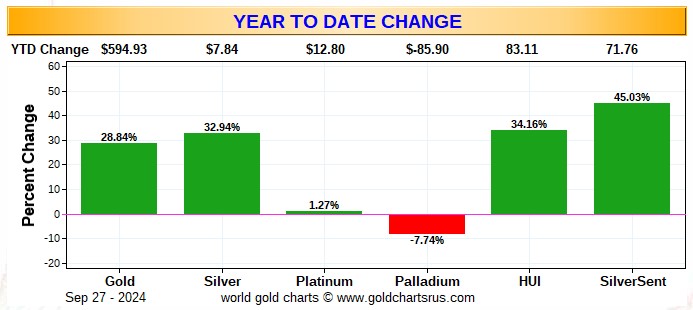
Here are the usual three charts that appear in this spot in every weekend missive. They show the changes in gold, silver, platinum and palladium in both percent and dollar and cents terms, as of their Friday closes in New York — along with the changes in the HUI and the new Silver Sentiment Index.
Here's the weekly chart. Yesterday's down day, thanks to 'da boyz', prevented it from being wall-to-wall green -- and because of that, I wouldn't read too much into what you see here. Click to enlarge.
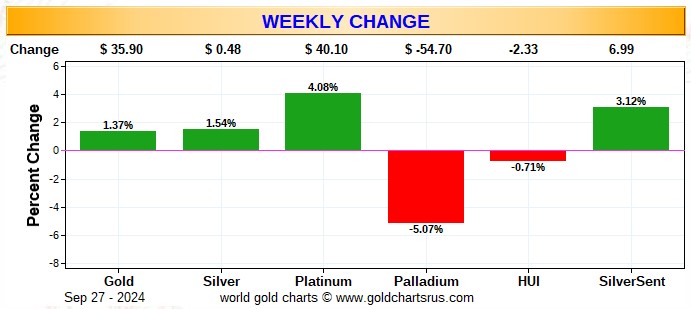
Here's the month-to-date chart...and it certainly gives more clarity. Nothing much has changed from last week -- and the silver stocks continue to outperform their golden cousins by a respectable amount...both on a relative and absolute basis.
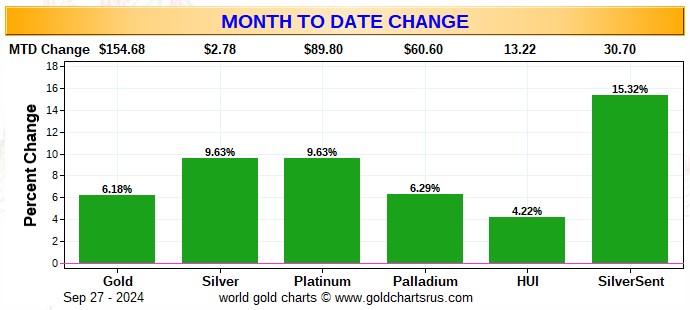
Here's the year-to-date chart -- and what I said about the precious metal equities in the monthly commentary, applies here as well. However, the most glaring thing about this chart is the ongoing underperformance of the precious metal equities vs. the gains posted by their underlying precious metals. I'm sure that will change over time...but as for how much time that will be, is anyone's guess. However, as I pointed out earlier this week, the silver shares in Nick's 1-year Silver Sentiment Index are up almost 100 percent since their lows of March. I don't know about you, but it's made one heck of a difference to my portfolio. Click to enlarge.
Of course -- and as I mention in this spot every Saturday -- and will continue to do so...is that if the silver price was sitting close to a new all-time high of $50+ dollars an ounce, like gold is now close to its new all-time high...it's a given that the silver equities would be outperforming their golden cousins by an absolute country mile -- and most likely by two or three.
![]()
The CME's Daily Delivery Report for Day 21 of September deliveries showed that 3 gold -- and 0 silver contracts were posted for delivery within the COMEX-approved depositories on Monday.
In gold, the sole short/issuer was Interactive Brokers as the sole short/issuer out of its house account. And the two long/stoppers were BofA Securities and ADM, picking up 2 and 1 contracts respectively...BofA Securities for their own account. That completes gold deliveries for September.
First Day Notice for the October delivery month showed that 8,276 gold -- plus 1,065 silver contracts were posted for delivery within the COMEX-approved depositories on Tuesday.
In gold, the two biggest short/issuers by far were Canada's BMO [Bank of Montreal] Capital and British bank Standard Chartered, issuing 5,258 and 2,214 contracts out of their respective house accounts! The next two largest were British bank HSBC and Goldman Sachs, issuing 640 and 110 contracts out of their respective client accounts.
The largest long/stopper of many was BofA Securities, picking up 3,770 contracts for their house account. Next was JPMorgan, stopping 1,202 contracts in total...792 for their own account -- and the other 410 for clients. Then came Australia's Macquarie Futures, stopping 1,146 contracts in total... 593 for their own account -- and the other 553 for their clients. After them were Deutsche Bank and Canada's Scotia Capital/Scotiabank picking up 718 and 707 contracts -- and all for their respective house accounts. The list goes on and on...
In silver, the three largest short/issuers were Canada's BMO Capital, Stonex Financial and JPMorgan, issuing 271, 243 and 204 contracts...BMO Capital from its own account. The next two biggest were Marex Spectron and British bank HSBC, issuing 139 and 120 contracts from their respective client accounts. There were six long/stoppers in total -- and the two biggest there were JPMorgan and Australia's Macquarie Futures, picking up 718 and 154 contracts for their respective client accounts. After them were the CME Group and BofA Securities, stopping 81 and 71 contracts...all for their respective house accounts.
The CME Group immediately reissued theirs as 5x81=405 of those one-thousand ounce good delivery bar micro silver futures contracts -- and it was the usual three long/stoppers for them...Advantage, Morgan Stanley and ADM, picking up 210, 177 and 18 contracts for their respective client accounts.
This is the first time ever that I've seen the CME Group issue these micro silver futures contracts on First Day Notice -- and I'm not sure what should be read into that, if anything. But I did find it noteworthy for that reason.
In platinum, there were 445 contracts issued and stopped. JPMorgan issued 430 of them out of their client account -- and stopped 345 of them in total... 248 for clients -- and the other 97 for their house account.
The link to yesterday's Issuers and Stoppers Report is here -- and it's definitely worth a look if you have the interest. If you wish to see the Big 8 commercial shorts in action...the gang's all here.
For the month of September, now in the history books, there were 4,234 gold contracts issued/reissued and stopped, which was huge for a non-scheduled delivery month -- and that number in silver was 5,099 contracts. In platinum it was 74 contracts -- and in palladium...59.
On First Day Notice for September deliveries back on August 29, the CME Group showed that 4,142 gold contracts were still open...along with 4,553 silver contracts. So, as the September delivery month progressed, there were 4,234-4,142=92 more gold contracts added -- and in silver there were 5,099-4,553=546 more silver contracts added.
The CME's Preliminary Report for the Friday trading session showed that gold open interest in October fell by a further 2,889 COMEX contracts, leaving 10,819 still around...minus the 8,276 contracts of First Day Notice mentioned a bunch of paragraphs ago. Silver o.i. in October declined by 155 contracts, leaving 1,071 still open...minus the 1,065 contracts out for delivery on First Day Notice mentioned a bunch of paragraphs ago.
There appears to be some sort of urgency to get October deliveries out of the way as quickly as possible for whatever reason...silver in particular, as all but 6 contracts were posted for delivery on the first day of the delivery month.
Total gold open interest fell by a net 6,047 COMEX contracts -- but total silver o.i. rose, it by a net 306 contracts. Both are subject to some revisions [almost always downwards] by the time the final figures are posted on the CME's website later on Monday morning CDT -- and I'll be reporting on these 'revisions' only if they're out of line.
Thursday's preliminary report figure in gold showed an increase in total open interest of 4,001 contracts...which was reduced down to 3,626 contracts when the final 'revised' number was posted on the CME's website on Friday morning CDT. Silver's preliminary total o.i. showed an increase of 1,647 contracts, but was revised down to a decrease of 46 contracts. I was very happy to see that 'down' adjustment in silver -- and the 'revision' in gold was of the 'normal' variety.
![]()
There was a surprisingly large counterintuitive withdrawal from GLD yesterday, as an authorized participant, or more than one, removed 166,326 troy ounces of gold...which may have been a conversion of GLD shares for physical metal. There was also a counterintuitive withdrawal from GLDM...as 11,891 troy ounces were removed from it as well. There was a further addition into SLV, as an a.p. added another 1,094,625 troy ounces of silver.
In other gold and silver ETFs and mutual funds on Planet Earth on Friday, net of any changes in COMEX, GLD, GLDM and SLV inventories, a net 96,738 troy ounces of gold were added. A net 1,641,049 troy ounces of silver were added as well, with the largest amount...1,289,434 troy ounces...ending up in iShares/SVR.
There was no sales report from the U.S. Mint.
Month-to-date the mint has sold 20,500 troy ounces of gold eagles...8,000 one-ounce 24K gold buffaloes -- and 1,652,000 silver eagles. Those numbers are unchanged from last week.
![]()
There was only a bit of activity in gold over at the COMEX-approved depositories on the U.S. east coast on Thursday. The 36,491.385 troy ounces/1,135 kilobars received were all dropped off at Loomis International -- and 12,238 troy ounces were shipped out...the the largest amount being the 12,038 troy ounces that left JPMorgan. There were 1,543.248 troy ounces/48 kilobars transferred from the Eligible category and into Registered involving two different depositories -- and I won't bother itemizing these small amounts. The link to all of Thursday's COMEX activity in gold is here.
The only activity in silver were the 196,518 troy ounces that departed Asahi -- and the link to that is here.
But it was another big day over at the COMEX-approved gold kilobar depositories in Hong Kong on their Thursday...all of it at Brink's, Inc. as usual. They reported receiving 2,549 kilobars -- and shipped out 4,444 of them. The link to this is here.
The Shanghai Futures Exchange reported that a net 778,472 troy ounces of silver were added to their inventories on their Friday, which now stands at 34.205 million troy ounces.
![]()
Here are the usual 20-year charts that show up in this space in every weekend column. They show the total amounts of physical gold and silver held in all know depositories, ETFs and mutual funds as of the close of business on Friday.
During the week just past, there were a net 310,000 troy ounces of gold added...but a net and monstrous 15.664 million troy ounces of silver were added as well -- and that was mostly because of the 12.77 million troy ounces that arrived at SLV. The prior week, 10.81 million ounce had been removed from SLV. Click to enlarge.
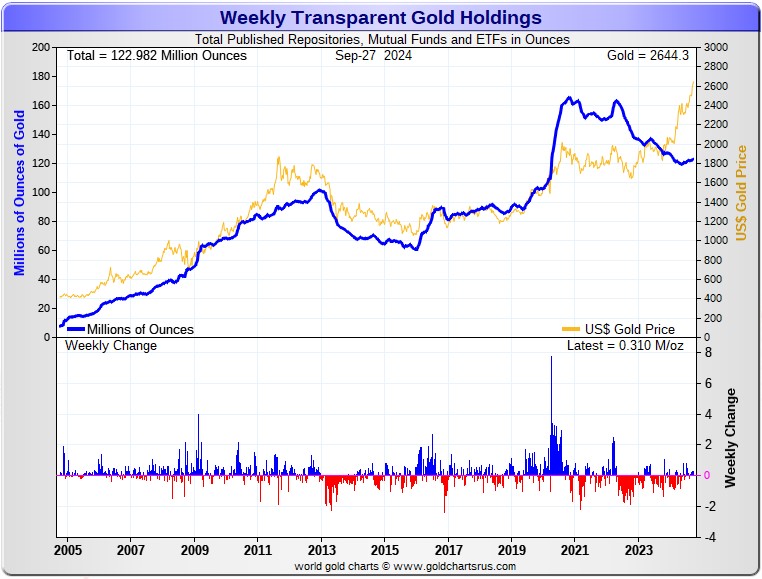
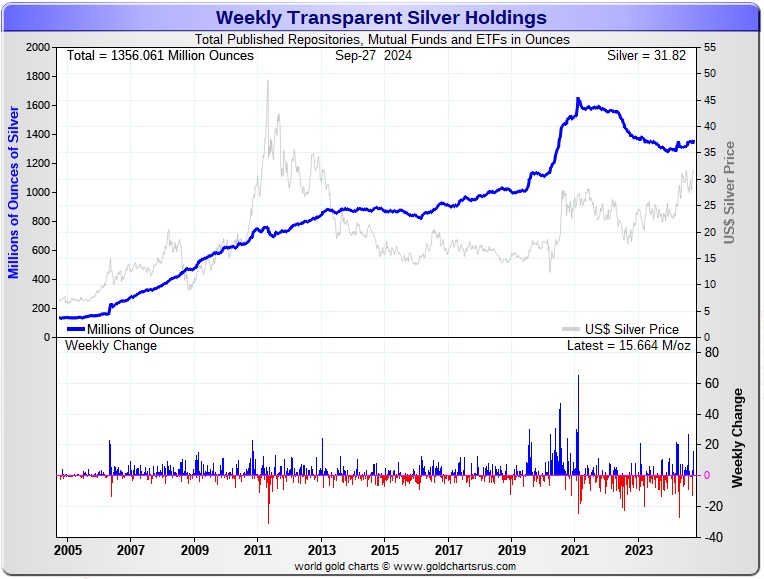
According to Nick Laird's data on his website, there were a net 805,000 troy ounces of gold added to all the world's known depositories, mutual funds and ETFs during the last four weeks...which isn't a whole heck of a lot considering the price action. And a net 5.982 million troy ounces of silver were added during that same time period -- and mostly because of those big additions into SLV this past week -- and mentioned above. There's been a monstrous down/up swing in SLV over the last two weeks...north of 22 million ounce in and out combined.
Retail bullion sales have shown signs of life. But one still has to wonder about those 1,652,000 silver eagles that the mint reported selling so far in September. Who bought those? Premiums vary, depending on the dealer. They're very high at Kitco...but somewhat to much lower in most other places.
At some point there will be huge quantities of silver required by all the silver ETFs and mutual funds once institutional buying finally kicks in. There's been signs of it this past couple of weeks, as there's been a net 22 million oz. down/up swing in SLV over that time period, plus we've seen very decent deposits into the rest of the world's silver ETFs during this last week as well.
And as Ted stated a while ago now, it would appear that JPMorgan has parted with most of the at least one billion troy ounces that they'd accumulated since the drive-by shooting that commenced at the Globex open at 6:00 p.m. EDT on Sunday, April 30, 2011. They had to part with a bunch more again this week.
If they continue in this vein, they are going to have to cough up even more ounces to feed this year's ongoing structural deficit...another 215 million of them according to that latest report from The Silver Institute...which I'm sure didn't include the approximately 120 million ounces that India purchased during Q1/2024...plus most of the 13.9 million ounces that China imported in June -- and the 5.6 million ounces that India bought in July...plus the 45 million that India purchased in August.
The physical demand in silver at the wholesale level continues unabated -- and was over the top again this past week. The amount of silver being physically moved, withdrawn, or changing ownership is still ongoing. This frantic in/out activity, as Ted had been pointing out for years, is a sure sign that 1,000 oz. good delivery bars are getting ever harder to come by.
New silver has to be brought in from other sources [JPMorgan] to meet the ongoing demand for physical metal. This will continue until available supplies are depleted...which will be the moment that JPMorgan & Friends stop providing silver to feed this deepening structural deficit, now in its fourth year.
The vast majority of precious metals being held in these depositories are by those who won't be selling until the silver price is many multiples of what it is today.
Sprott's PSLV is the third largest depository of silver on Planet Earth with 178.4 million troy ounces...up 1.1 million ounces from last week -- but some distance behind the COMEX, where there are 304.5 million troy ounces being held...up 100,000 ounce. on the week...minus the 103 million troy ounces mentioned in the next paragraph.
It's now been proven beyond a shadow of a doubt that 103 million troy ounces of that amount in the COMEX is actually held in trust for SLV by JPMorgan according to a letter Ted received from the CFTC earlier this year. That brings JPMorgan's actual silver warehouse stocks down to around the 32 million troy ounce mark...quite a bit different than the 135.00 million they indicate they have...exactly unchanged for the third week in a row.
But PSLV is still some distance behind SLV, as they are the largest silver depository, with 457.8 million troy ounces as of Friday's close...up those 12.77 million troy ounces that were added this past week.
The latest short report showed that the short position in SLV rose by 19.07 percent...from 15.25 million shares sold short in the prior short report...up to 18.16 million shares in this past Tuesday's report.
BlackRock issued a warning several years ago to all those short SLV, that there might come a time when there wouldn't be enough metal for them to cover. That would only be true if JPMorgan decides not to supply it to whatever entity requires it...which is most certainly a U.S. bullion bank, or perhaps more than one.
The next short report will be posted on The Wall Street Journal's website very early on Wednesday morning on October 9.
Then there's that other little matter of the 1-billion ounce short position in silver held by Bank of America in the OTC market...with JPMorgan & Friends on the long side. Ted said it hadn't gone away -- and he'd also come to the conclusion that they're short around 25 million ounces of gold with these same parties as well -- and there's more on this in the COT Report just below. The latest report for the end of Q1/2024 from the OCC came out about three months ago now -- and after carefully scrutiny, I noted that nothing much had changed since the end of Q4/2023. I'm expecting the Q2/2024 report soon.
![]()
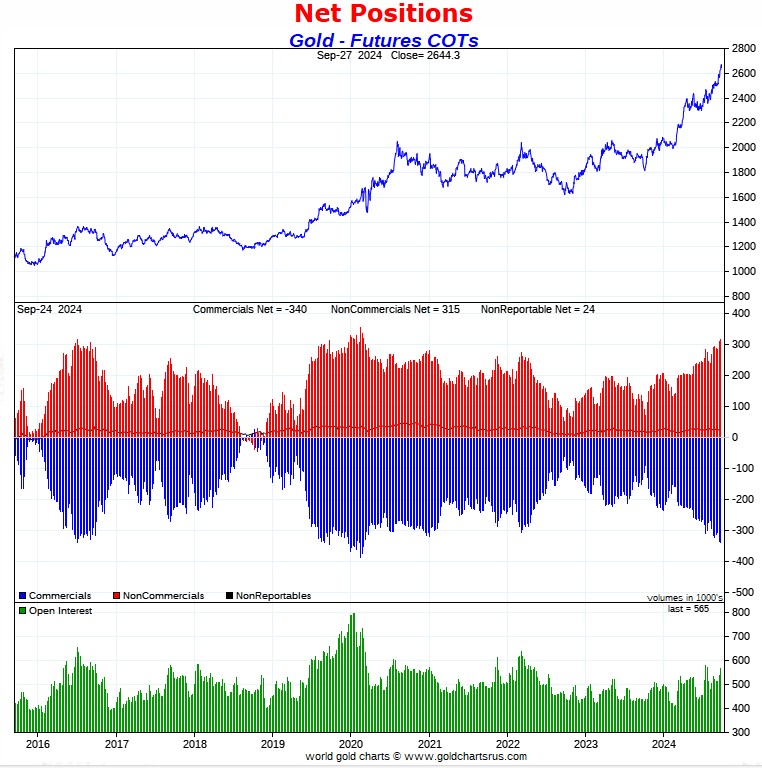
The Commitment of Traders Report for positions held at the close of COMEX trading on Tuesday showed the expected increases in the commercial net short positions in both silver and gold...but weren't anywhere near as bad as I feared, but bad enough in the overall.
In silver, the Commercial net short position increased by a further 4,526 COMEX contracts, or 22.630 million troy ounces of the stuff.
They arrived at that number by increasing their long position by 1,208 contracts, but also added 5,734 short contracts -- and it's the difference between those two numbers that represents their change for the reporting week.
Under the hood in the Disaggregated COT Report, all three categories were buyers...adding to their net long positions...the Managed Money by 3,556 contracts -- and the Other Reportables and Nonreportable/small traders by 344 and 626 contracts respectively.
Doing the math: 3,556 plus 344 plus 626 equals 4,526 COMEX contracts... the change in the Commercial net short position.
The Commercial net short position in silver now stands at 81,832 COMEX contracts/409.160 million troy ounces...up those 4,526 contracts from the 77,306 COMEX contracts/386.530 million troy ounces they were short in the September 20 COT Report.
The Big 4 shorts increased their net short position by 2,687 contracts...almost the same amount they added last week...up to 55,976 contracts during the reporting week...from the 53,289 contracts they were short in last Friday's COT Report...which is monstrously bearish...the largest short position they've held since back on July 9.
The Big '5 through 8' shorts also increased their net short position, them by 417 contracts ...from the 21,794 contracts in last Friday's COT Report, up to 22,211 contracts in yesterday's COT Report. That's at least 10,000 contracts more than they 'normally' hold short -- and obviously very bearish as well.
The Big 8 commercial shorts in total increased their overall net short position from 75,083 contracts, up to 78,187 COMEX contracts week-over-week...an increase of 3,104 COMEX contracts.
That 78,187 contract short position held by the Big 8 is wildly bearish when you consider the fact that they were short only 53,041 contracts in the October 27, 2023 COT Report.
Making up the difference between the change in the commercial net short position...4,526 contracts -- and what the Big 8 traders did...3,104 contracts... Ted's raptors, the small commercial traders other than the Big 8, were also sellers during this past reporting week... increasing their short position by 4,526-3,104=1,422 COMEX contracts -- and are now short silver by 3,645 contracts.
Here's Nick's 9-year COT chart for silver. Click to enlarge.
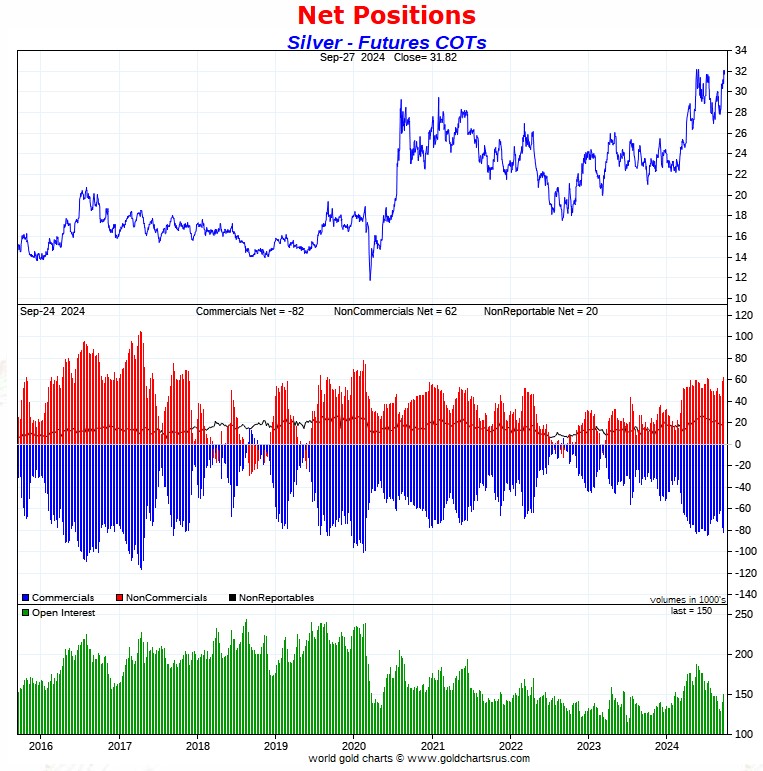
It was "all for one -- and one for all" regarding the collusive commercial traders of whatever stripe for the second week in a row -- as they continued to live up to their reputations in spades. It was only their collective selling that prevented silver from closing at some fantastic 3-digit price in what would have been a short-covering rally for the ages.
The Big 4 commercial short position is now back to what it was on July 9...as I mentioned a bit further up -- and the Big 8 commercial net short position in total is back to what it was on 16 July.
The Big 8 collusive commercial shorts in silver, minus their uneconomic and market-neutral spread trades, remain short 52.1% of the entire open interest in silver in the COMEX futures market...down a tad from last week. The only reason that percentage concentration fell [again] was because total open interest in silver increased by a further 9,466 COMEX contracts during the week, which obviously affects the percentage calculation.
The total commercial net short position in silver held by these collusive commercial traders is 54.5 percent of total open interest once you include the short positions held by Ted's raptors...the small commercial traders other than the Big 8.
If all those spread trades in all categories were eliminated, it would most likely show that the commercial net short position in silver if something over 60% of total open interest.
Not that you need to be reminded, but from a COMEX futures market perspective, the set-up in silver is wildly bearish in the extreme....with the Managed Money traders holding an almost record long position.
But as Ted had mentioned on several occasions over the years, at some point what the numbers show in the COT Report won't matter, as the drumbeat of that structural supply/demand deficit grows ever louder.
![]()
In gold, the commercial net short position only increased by 4,759 COMEX contracts...475,900 troy ounces of the stuff -- and I was surprised that it wasn't more...must more.
They arrived at that number through the purchase of 2,066 long contracts, but also sold 6,645 short contracts -- and its the difference between those two numbers that represents their change for the reporting week.
Under the hood in the Disaggregated COT Report, the Managed Money and Other Reportables were buyers...increasing their net long positions by 2,674 and 2,650 COMEX contracts respectively. On the other hand, the Nonreportable/small traders reduced their net long position by 745 contracts.
Doing the math: 2,674 plus 2,650 minus 745 equals 4,579 COMEX contracts, the change in the commercial net short position.
The commercial net short position in gold now sits at 339,706 COMEX contracts/33.971 million troy ounces of the stuff...up those 4,579 contracts from the 335,127 contracts/33.513 million troy ounces they were short in the September 20 COT Report. This continues to be the biggest commercial net short position in my memory.
The Big 4 shorts in gold actually reduced their short position during the reporting week, them by 3,554 contracts...from 210,212 contracts they were short last week, down to the 206,658 contracts in yesterday's report -- but still ultra bearish.
The Big '5 through 8' shorts increased their net short position, them by a further 1,283 contracts...from the 81,719 contracts they held short in last Friday's COT Report, up to 83,002 contracts held short in the current COT Report...which is at or close to a record high.
The Big 8 short position decreased from 291,931 contracts/29.193 million troy ounces in last week's COT Report...down to 289,660 COMEX contracts/ 28.966 million troy ounces...a decrease of 2,271 contracts.
But since the change in the commercial net short position showed an increase of 4,759 COMEX contracts during the reporting week, that meant that Ted's raptors...the small commercial traders other than the Big 8...were big sellers for the second week in a row...to the tune of 4,759+2,271=7,030 contracts. They are now short gold by an unheard of 50,046 COMEX contracts...another new record high short position for them -- and by light years.
Here's Nick Laird's 9-year COT Report chart for gold...updated with the above data. Click to enlarge.
Considering the price action in gold during the reporting week, I was quite taken aback by the fact that Big 4 shorts in gold actually reduced their net short position...which I certainly wasn't expecting.
This is uncharted territory in both precious metals from a raptors/small commercial traders perspective -- and have emerged as a force to be reckoned with on the short side...which they hardly ever were before. This is most glaring in gold, because I don't remember them ever being short more than 10,000 contracts.
The short position of the Big 8 commercial traders is 51.3 percent of total open interest in the COMEX futures market...down from 54.3 percent they were short in last week's COT Report. The reason for that drop was the same as it was for silver...a huge increase [27,013 contracts] in total open interest, which obviously dilutes the percentage calculation.
But these collusive commercial traders of whatever stripe [including Ted's raptors] are short 60.2 percent of total open interest in gold in the COMEX futures market -- and certainly more than that if their non-economic and market-neutral spread trades could be subtracted out.
For obvious reasons, the set up in gold from a COMEX futures market perspective, remains in wildly bearish territory. The only positive in this report was the fact that the Big 4 actually reduced their short position -- and in the prior COT Report, did almost nothing.
So the big picture here is that the collusive commercial traders have all the Managed Money mice in the long trap -- and it only remains to be seen how successful they might be if they attempt another 'wash, rinse & spin' cycle. If it has indeed begun, the the tops in gold and silver were set around 12:30 p.m. BST in London on their Thursday afternoon.
There's still no sign whatsoever that the collusive commercial shorts are loosening their iron grip on the precious metals -- and I have much more to say about this in The Wrap.
![]()
In the other metals, the Managed Money traders in palladium decreased their net short position by a further 651 COMEX contracts during the reporting week...but remain net short palladium by 6,001 contracts...31.6 percent of total open interest. The only other group of traders that are net short palladium are the Other Reportables.
In platinum, the Managed Money traders increased their net long position by a further 4,405 COMEX contracts during the reporting week -- and are net long platinum by 15,060 COMEX contracts. The commercial traders in the Producer/Merchant category are mega net short 27,585 COMEX contracts -- and the Swap Dealers in the commercial category are now back on the short side as well this week...but only by 1,533 COMEX contracts. The traders in both the Other Reportables and Nonreportable/small traders categories remain net long platinum by very decent amounts as well...the Other Reportables in particular.
It's the world's banks in the Producer/Merchant category that are 'The Big Shorts' in platinum in the COMEX futures market, as per the last Bank Participation Report.
In copper, the Managed Money traders increased their net long position by a further 12,966 COMEX contracts -- and are net long copper by 32,848 COMEX contracts...about 821 million pounds of the stuff as of yesterday's COT Report ...up from the 497 million pounds they were net long copper in last Friday's report. It was their buying of these long contracts the drove copper prices higher during this past reporting week.
Copper, like platinum, continues to be a wildly bifurcated market in the commercial category. The Producer/Merchant category is net short 56,023 copper contracts/1.400 billion pounds -- while the Swap Dealers are net long 16,396 COMEX contracts/410 million pounds of the stuff.
Whether this means anything or not, will only be known in the fullness of time. Ted said it didn't mean anything as far as he was concerned, as they're all commercial traders in the commercial category. However, this bifurcation has been in place for as many years as I can remember -- and that's a lot.
In this vital industrial commodity, the world's banks...both U.S. and foreign... are net long 11.1 percent of the total open interest in copper in the COMEX futures market as shown in the September Bank Participation Report that came out three weeks ago now...up from the 8.4 percent they were net long in August's.
At the moment it's the commodity trading houses such as Glencore and Trafigura et al., along with some hedge funds, that are net short copper in the Producer/Merchant category, as the Swap Dealers are net long, as pointed out above.
The next Bank Participation Report is due out next week...on Friday, October 4.
![]()
Here’s Nick Laird’s “Days to Cover” chart, updated with the COT data for positions held at the close of COMEX trading on Tuesday, September 24. It shows the days of world production that it would take to cover the short positions of the Big 4 — and Big '5 through 8' traders in every physically traded commodity on the COMEX. Click to enlarge.
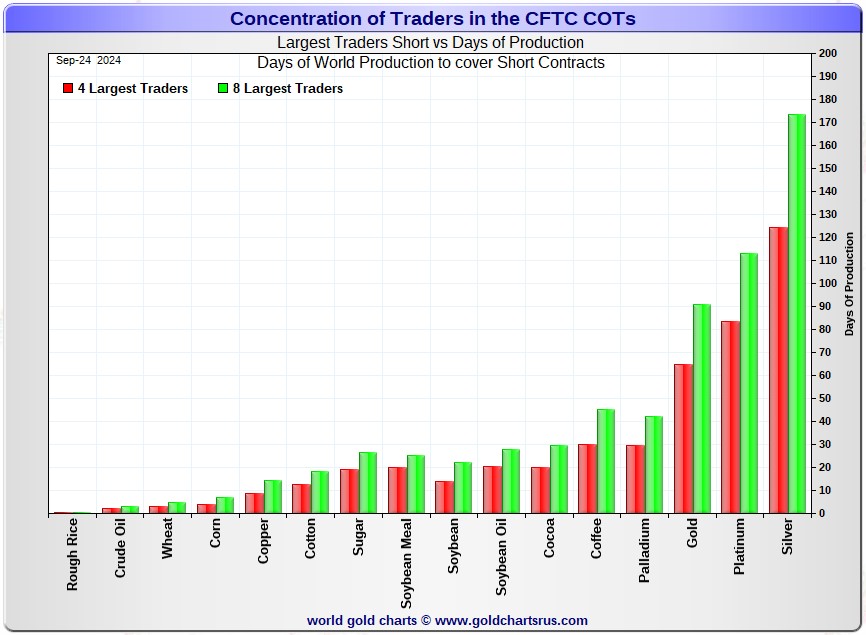
In this week's data, the Big 4 traders are short about 124 days of world silver production... up 6 days from the last COT report...the same amount they were up in last week's COT Report. The ‘5 through 8’ large traders are short an additional 50 days of world silver production... up 1 day from last Friday's COT Report, for a total of about 174 days that the Big 8 are short -- and up 7 days from last week.
Those 174 days that the Big 8 traders are short, represents about 5.8 months of world silver production, or 390.935 million troy ounces/78,187 COMEX contracts of paper silver held short by these eight commercial traders. Several of the largest of these are now non-banking entities, as per Ted's discovery a year or so ago. September's Bank Participation Report from a week ago continues to confirm that this is still the case -- and not just in silver, either.
The small commercial traders other than the Big 8 shorts, Ted's raptors, are now net short silver by 3,645 COMEX contracts...as they sold another 1,422 contracts during the reporting week.
So when you add that in to what the Big 8 are short, the collusive commercial traders of whatever stripe are net short 81,832 COMEX contracts/409.16 million troy ounces of silver...just under 182 days of world silver production...a bit over six months.
In gold, the Big 4 are short about 65 days of world gold production...down 1 day from last Friday's COT Report. The '5 through 8' are short an additional 26 days of world production, about unchanged from last week...for a total of 91 days of world gold production held short by the Big 8 -- and obviously down 1 day from the prior COT Report.
The Big 8 commercial traders are short 52.1 percent of the entire open interest in silver in the COMEX futures market as of yesterday's COT Report, down a bit from the 53.4 percent that they were short in last Friday's COT Report -- and a tad higher than that mark once their market-neutral spread trades are subtracted out. But once you include the short positions of Ted's raptors in that number, the collusive commercial traders of whatever stripe are short 54.5 percent of the entire open interest in silver.
The non-economic and market-neutral spread trades are not reported in the Producer/ Merchant category by the CFTC -- and the reason as Ted had said was very simple. This is where the world's banks hide out. If one knew how many spread trades they had on, then you could calculate, to the contract, exactly how short they were in every COMEX commodity that they trade in -- and those numbers are closely guarded secrets by both the CFTC and the CME Group.
In gold, it's 51.3 percent of the total COMEX open interest that the Big 8 are short, down a bit from the 54.3 percent they were short in last Friday's COT Report -- and a whopping 60.2 percent of total open interest once you add in what Ted's raptors [the small commercial traders other than the Big 8] are short on top of that...a further 50,046 COMEX contracts. This is the very definition of egregious.
The percentage of total open interest that the Big 8 commercial traders are short would have been far higher in both silver and gold if there hadn't been such big increases in total open interest in both...for the second week in a row...which obviously affects the percentage calculation.
Ted was of the opinion that Bank of America is short about one billion ounces of silver in the OTC market, courtesy of JPMorgan & Friends. He was also of the opinion that they're short 25 million ounces of gold as well. And with the latest report [for Q1/2024] from the OCC in hand, I see that their position remains mostly unchanged...maybe down a bit, but nothing material. I'm checking frequently for the Q2/2024 numbers, but they're not posted on their website yet.
I've noted stories over the last few months about Warren Buffet starting to unload his BofA shares, the latest being this Zero Hedge offering from this past Wednesday headlined "Buffett Dumps More BofA Shares As Stake Nears Key 10% Non-Reporting Level" -- and linked here. If you're a Gregory Mannarino fan, he has always been of the firm belief that BofA will fail at some point.
The short position in SLV now sits at 18.16 million shares as of last short report that came this past Tuesday...up a hefty 19.07 percent from the 15.25 million shares sold short in the prior report. The next short report is due out on Wednesday, October 9.
The situation regarding the Big 4/8 commercial short position in gold and silver remains obscene and grotesquely bearish -- and got even more so in yesterday's COT Report, but is undoubtedly a bit less as of the close of trading on Friday.
As Ted had been pointing out ad nauseam, the resolution of the Big 4/8 short positions will be the sole determinant of precious metal prices going forward -- although the short positions held by Ted's raptors, particularly in gold, are a factor as well now.
I don't have all that many stories, articles or videos for you today.
![]()
CRITICAL READS
Key Fed inflation gauge at 2.2% in August, lower than expected
Inflation moved closer to the Federal Reserve’s target in August, easing the way for future interest rate cuts, the Commerce Department reported Friday.
The personal consumption expenditures price index, a gauge the Fed focuses on to measure the cost of goods and services in the U.S. economy, rose 0.1% for the month, putting the 12-month inflation rate at 2.2%, down from 2.5% in July and the lowest since February 2021. The Fed targets inflation at 2% annually.
Economists surveyed by Dow Jones had been expecting all-items PCE to rise 0.1% on the month and 2.3% from a year ago.
Excluding food and energy, core PCE rose 0.1% in August and was up 2.7% from a year ago, the 12-month number 0.1 percentage point higher than July. Fed officials tend to focus more on core as a better measure of long-run trends. The respective forecasts were for 0.2% and 2.7% on core.
“All quiet on the inflation front,” said Chris Larkin, managing director of trading and investing at E-Trade from Morgan Stanley. “Add today’s PCE Price Index to the list of economic data landing in a sweet spot. Inflation continues to keep its head down, and while economic growth may be slowing, there’s no indication it’s falling off a cliff.”
Though the inflation numbers indicated continued progress, the personal spending and income numbers both came in light.
Another number that should be viewed with deep suspicion, dear reader. This CNBC story put in an appearance on their Internet site at 8:32 a.m. on Friday morning EDT -- and comes to us courtesy of Swedish reader Patrik Ekdahl. Another link to it is here. The Zero Hedge spin on this is headlined "Fed's Favorite Inflation Indicator Hottest Since April, Govt Handouts Continue to Soar" -- and linked here.
![]()
Neutral Rates and Xi's 'Whatever it Takes' -- Doug Noland
Gold has jumped $89, or 3.5%, since the Fed meeting. Silver has risen 2.8%. The Bloomberg Commodities Index is up 3.3%. Gold and Silver enjoy y-t-d gains of 28.9% and 32.7%. The S&P500 sports a 2024 return of 21.6%, with the Semiconductors returning 25.8%, the Philadelphia Utilities Index 31.0%, and the Nasdaq Composite 21.4%. S&P CoreLogic had July y-o-y home price inflation at 5.0%. Q2 GDP was confirmed at 3.0% this week, as the Atlanta Fed GDPNow forecast has Q3 increasing to 3.1%. Following the Fed’s big cut, Money Market Fund Assets surged $121 billion this week to a record $6.424 TN – surely corresponding to boosts in “repo” borrowings and “basis trade” levered speculation.
Central bankers shoulder tremendous responsibility. Their role demands caution and conservatism. As we’ve witnessed, experimentation comes with monumental risks. One would think a series of historic blunders, including the mortgage finance Bubble boom and bust, the more recent inflationary spike, and now omnipresent speculative excess, would have ingrained humility into the contemporary central banker psyche. Do they somehow fail to recognize the role prolonged monetary disorder has played in our fraught times – with deeply divided societies and perilous geopolitical animus?
Federal Reserve Bank of Chicago's President Austan Goolsbee has no idea where the so-called “neutral rate” is. Nobody does. It’s a flawed concept in a world where Credit, liquidity, and perceived wealth are dominated by highly speculative financial markets. Anyone today positing that there’s an equilibrium policy rate doesn’t appreciate the precedence held by Bubble Dynamics, and current Credit and market backdrops.
From the global government finance Bubble perspective, the past nine days have been pivotal. First, the Fed aggressively slashes interest rates despite loose conditions, ongoing strong Credit growth, intensely speculative markets, and uninterrupted economic expansion. And this week, the U.S.’s chief geopolitical adversary...China...hit the panic button.
This very worthwhile commentary from Doug showed up on his website around midnight last night PDT -- and another link to it is here. Gregory Mannarino's post market close rant for Friday is linked here -- and this one runs for 45 minutes.
![]()
This 29-minute video interview is definitely worth watching if you have the interest. It appeared on the youtube.com Internet site on Thursday and, as usual, come to us courtesy of Guido Tricot. Another link to it is here.
Another interview with host Judge Andrew Napolitano involves former CIA intelligence analysts Larry Johnson and Ray McGovern. It's their Weekly Wrap Up -- and runs for 30 minutes. It's worth your while too -- and I thank Guido for that one as well. The link to it is here.
![]()
Zimbabwe devalues ZiG as latest bid for stable currency founders
Zimbabwe raised interest rates and devalued its gold-backed currency by 43%, following persistent weakness in the ZiG amid deep skepticism that the nation’s latest bid to create a viable local unit would succeed.
The Reserve Bank of Zimbabwe lifted the benchmark policy rate to 35% from 20%, it said in a statement on Friday. Prices on its website separately showed the ZiG, short for Zimbabwe Gold, quoted at 24.4 per dollar from 14 per dollar earlier in the day.
The central bank’s monetary policy committee did not explicitly confirm if it was devaluing the ZiG. But Governor John Mushayavanhu said it was taking a number of steps to combat inflation, including allowing “greater exchange rate flexibility, in line with the increased demand for foreign currency in the country.”
The ZiG, backed by the southern African nation’s gold and hard currency reserves, was introduced in early April to replace the Zimbabwean dollar, which had lost around 80% of its value since the start of the year.
The sixth attempt to stand up a local currency since 2009 was immediately met with doubt from Zimbabweans, who have bitter memories of how previous local currencies had failed.
This Bloomberg story from 6:00 a.m. EDT on Friday morning is posted in the clear on the bnnbloomberg.com Internet site -- and I found it on the gata.org website. Another link to it is here.
![]()
Gold’s rally to record highs is not slowing physical buying -- British Mint
Gold's unstoppable rally into uncharted territory is attracting significant attention as investment demand continues to grow. However, a new trend is also emerging, with physical demand also seeing robust activity.
Traditionally, higher prices have hurt physical demand, but the British Royal Mint reports a surge in new demand over the past month.
"From The Royal Mint's own data, in September, buying has outweighed selling by a ratio of 2 to 1 among investors, suggesting that many believe the yellow metal could rally further this year and beyond," said Stuart O'Reilly, Market Insights Manager at The Royal Mint, in a statement.
This strong activity comes as gold prices hit £2,000 an ounce, a new record high. O'Reilly noted that gold prices have risen more than 23% against the pound so far this year.
Gold's rally against the British pound mirrors its gains in the broader currency market. Currently, spot gold is trading at $2,666.50 an ounce, up 0.35% on the day. Gold' is up 29% against the US dollar year-to-date. Gold' prices have reached record highs against all major currencies, including the euro, Canadian dollar, Australian dollar, and Chinese yuan.
This gold-related news item was posted on the kitco.com Internet site on Thursday -- and another link to it is here.
![]()
QUOTE of the DAY

![]()
The WRAP
"Understand this. Things are now in motion that cannot be undone." -- Gandalf the White
![]()
Today's pop 'blast from the past' was a hit 40 years ago. How is that possible? It was written by Peter Cetera and Canadian record producer, film composer, and music executive David Foster. Neither the tune, nor the group that made it famous, needs any introduction. Here are Moscow-based Leonid & Friends with their faithful reproduction of it. The link is here. There's a bass cover to this -- and Canada's-own Constantine Isslamow does the honours. The link to that is here. It's hard to believe that Cetera not only sang the lead vocals for this song, but also played its rather complex bass line at the same time.
Today's classical 'blast from the past' is one I featured much earlier this year, but I'm in the mood for it again today -- and hope you are too. It's George Gershwin's Rhapsody in Blue for solo piano and jazz band, a composition that's 100 years old this year. Composed in just five short weeks, its famous opening clarinet glissando has become as instantly recognizable to concert audiences as the opening of Beethoven's Fifth Symphony.
Here's Georgia-born concert pianist Khatia Buniatishvili doing the honours -- and she's just a joy to watch, as she's obviously having a wonderful time. The video quality ain't that great...but that doesn't matter...as she and the orchestra are. The link is here.
![]()
Well, there was no way on God's green earth that the powers-that-be were going to allow gold, silver and platinum to rise further after that PCE number hit the tape, so they stepped on them a few minutes before 9 a.m. -- and then ran the dollar index higher shortly after that in order to help in their efforts.
That 'rally' in the dollar index ended at 12:40 p.m. EDT...but the engineered price declines in the four precious metals continued -- and all had their respective low ticks set at different times after that. Nothing free-market about any of this, of course.
However, I was encouraged by the fact that gold turned in such a decent rally in after-hours trading that a short seller of last resort had to show up a minute or so before the 5:00 p.m. close...or it would have certainly gone 'no ask' otherwise...as the market is extremely thinly-traded and illiquid at that time of day, especially on a Friday.
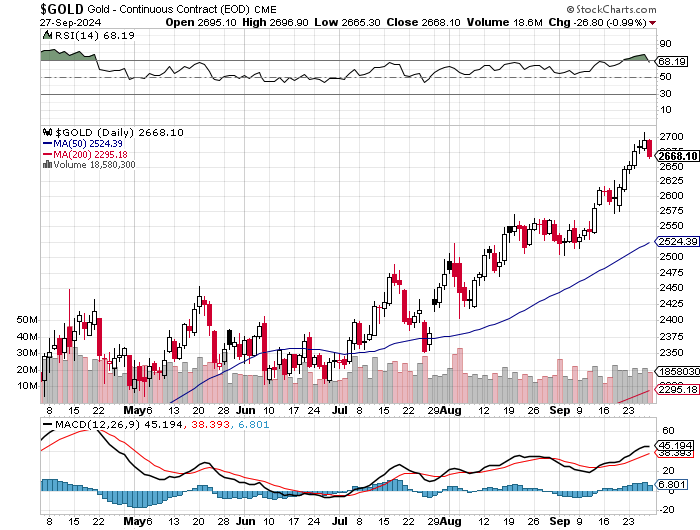
Gold closed down $16.50 in the spot market, but down $26.80 in December, its current front month -- and is now back below the overbought mark on its RSI trace by a bit.
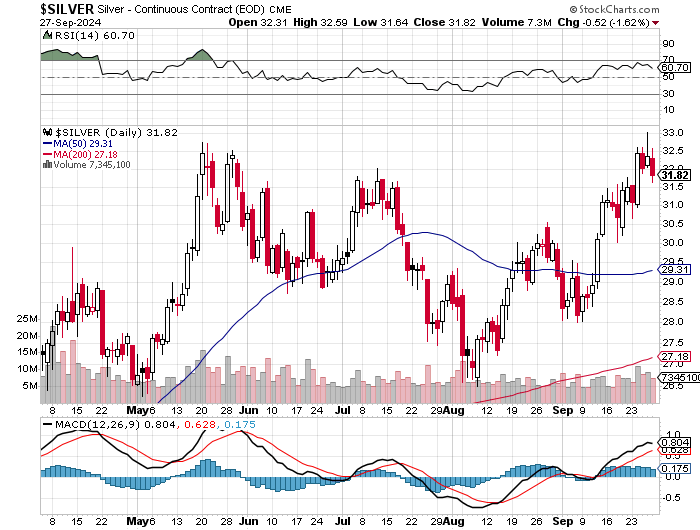
Like gold, silver was powering higher until 'da boyz' appeared on the scene -- and was closed lower for the second time in the last three days. Its price has been held in check so carefully lately that it's never had a sniff of being overbought.
Platinum's 3-day rally came to a halt on Friday -- and palladium's engineered downward price path continued again yesterday...down $35 in the spot market, but only down $27.80 in December...its current front month. Needless to say, neither are anywhere near overbought.
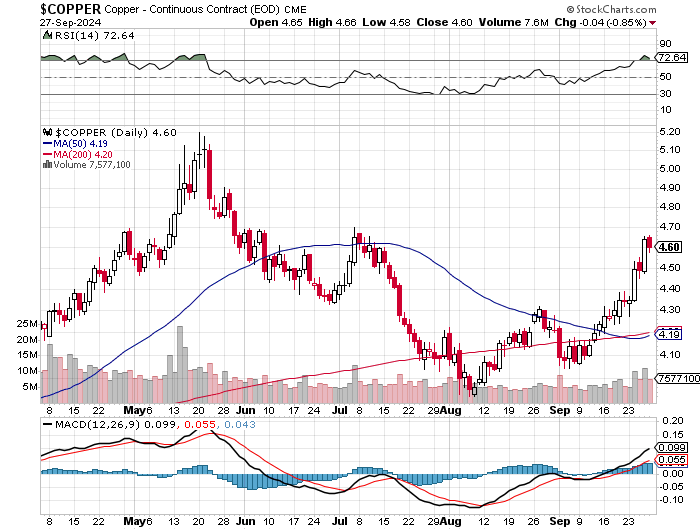
Copper was closed down 4 cents at $4.60/pound on Friday...but is still in overbought territory by a bit on its RSI trace.
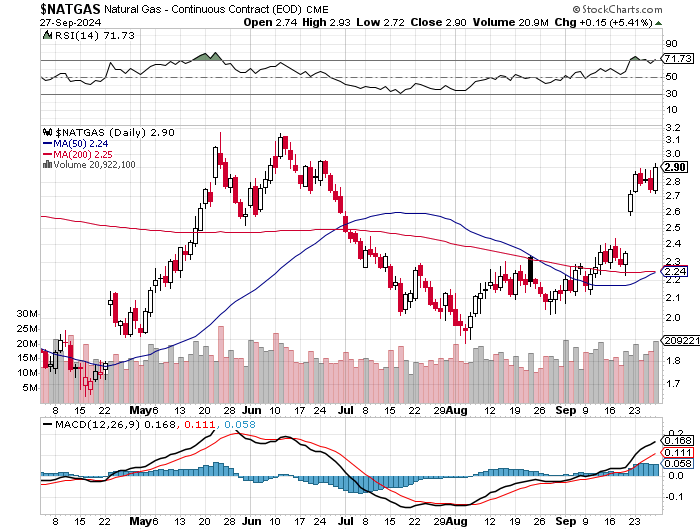
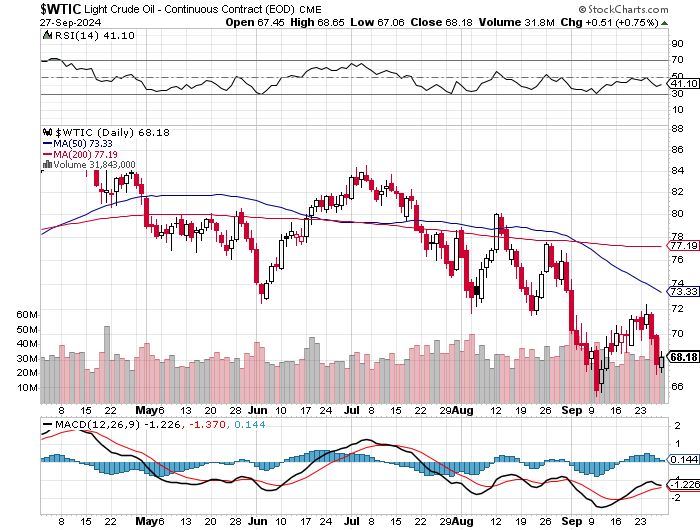
Natural gas [chart included] resumed its upward price path, as it closed higher by 15 cents/5.41% at $2.90/1,000 cubic feet -- and back into overbought territory on its RSI trace by a bit. WTIC managed a small gain yesterday, as it closed higher by 51 cents at $68.18/barrel -- and still $5+ below its nearest moving average...the 50-day.
Here are the 6-month charts for the Big 6+1 commodities...courtesy of stockcharts.com as always and, if interested, their COMEX closing prices in their current front months on Friday should be noted. Click to enlarge.
I mentioned in this space yesterday that..."I had some concern as the COMEX trading session in New York progressed, that these collusive commercial traders were attempting to engineer a key reversal to the downside in both gold and silver. Fortunately, that technical pattern didn't materialize. However, the gravestone dojis they painted...particularly the one for silver...was pretty ugly."
Of course the only reason that they, plus platinum and palladium, didn't close up on the day by decent amounts on Friday was because of the collusive commercial traders of whatever stripe. The only way that 'da boyz' can create downside momentum these days is to create it themselves, which they've been doing for years -- and was on full display during the latter part of this week.
Despite the fact that both silver and gold are in wildly bearish territory in the COMEX futures market, they are still in strong rally mode -- and it will be of some interest if the commercials can turn the managed money traders et al. into sellers.
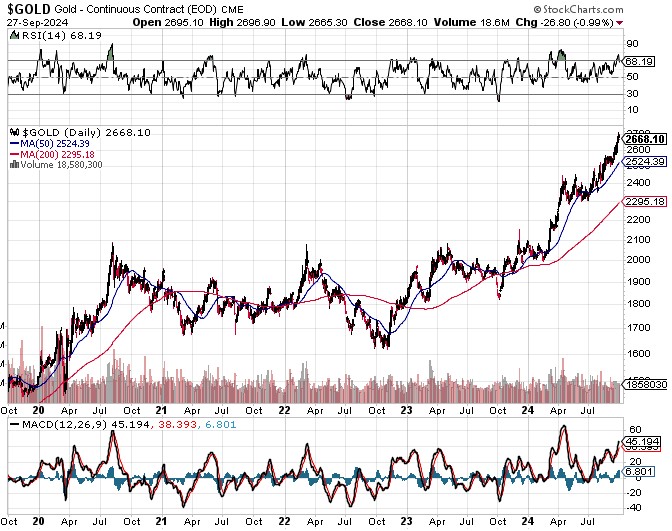
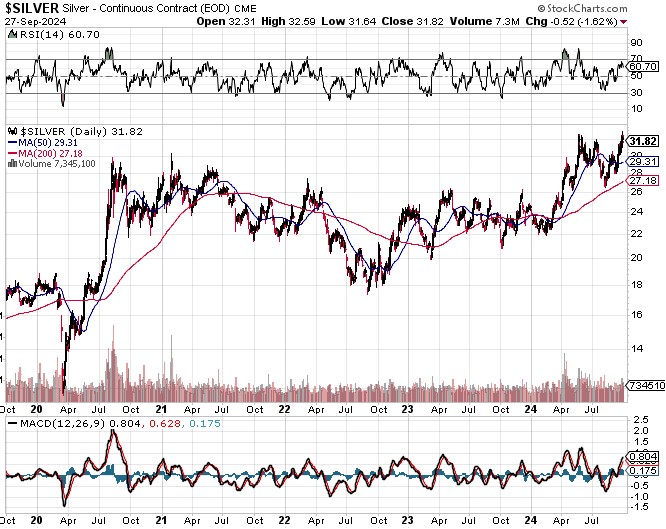
Their patented 'wash, rinse & spin' cycle has been M.I.A. since the beginning of March 2022 in both. Yes, they've managed a bit since then...but since the lows of early November of that year, their attempts to turn the tide have been been of short duration before the primary trend...up...returns. Here are the 5-year charts for both so you can get a better look at it.
So the jury is out as to what happens going forward. It appears to me that 'da boyz' are at the stage that they're just trying to prevent their prices from blowing sky high -- and all thoughts of covering any meaningful amount of their short positions has long past.
But that doesn't apply to all the shorts, of course...only the selected few 'too big to fail' bullion banks -- and maybe a couple of commodity trading houses. The rest will burn...unless the COMEX is closed in order to save the financial system...as a market-clearing short-covering rally in the commodities space would involve many hundreds of billions of of dollars in losses. As always, the gory details for silver are spelled out chapter and verse in Ted's "Bonfire of the Silver Shorts" essay.
Of course the short position of the Big 8 traders is infinitely worse now than it was a year ago when he wrote that. At that time, the Big 8 were short 51,305 COMEX silver contracts -- and Ted's raptors, the small commercials other than the Big 8, were net long silver by 21,518 contracts. As of yesterday's COT Report, the Big 8 were net short 78,187 COMEX contracts -- and his raptor are now net short 3,645 contracts!
So as a group, the collusive commercial traders of whatever stripe in total have gone from a net short position of 51,305-21,518=29,787 COMEX contracts back on 22 September 23...up to 78,187 plus 3,645=81,832 COMEX contracts, as all the commercial traders are short now. So the short position held by the commercial traders in total is way more than double what it was when Ted wrote that piece -- and he was deeply concerned about it then. You need to look no further than that to understand why silver is underperforming.
Without doing the above math in gold, the collusive commercial traders... including Ted's raptors...have gone from a net short position of 152,932 COMEX contracts back in the 22 September 2023 COT Report, to a net short position of 339,706 COMEX contracts as of yesterday's COT Report. Like in silver, every category of commercial traders is now net short gold...including that record short position now held by the raptors. And also like in silver, this is the sole reason why the gold price isn't at the moon already.
It's 'all for one -- and one for all' as the bullion banks et al. [including the BIS most likely] try to keep precious metals and other commodities from melting up -- and the rest of the financial system from melting down. It's impossible to overstate how dangerous this is to the entire world's financial system... especially the banks in the collective west. It will break them if a market-clearing event is allowed. That's why the CFTC and the CME Group, plus the DoJ should be boiled in oil...as Ted kept pointing out -- and why I see the closing of the COMEX as the only option left. I'm sure he would be apoplectic if he could see what was in yesterday's COT Report.
Looking elsewhere -- and barring some obscene black swan event by the Western criminal globalist power elite, the outcome of the Ukraine/Russia conflict is no longer in doubt. In the public domain, they're running away from it as fast as they can.
But in the Middle East, the bombs continue to fall in south Lebanon as I write this -- and all-out war is most likely underway between Israel and the Hezbollah. How long will it be before the U.S. gets involved -- and will Iran get dragged in kicking and screaming as well? I'm sure we'll find out soon enough. As I've stated before, the situation is ripe for a false flag event of some kind, either over there, or over here...or both.
Coming up hard on top of this is the BRICS conference in Kazan...less than a month away now...where a big chunk of the rest of the world...led by China, Russia and India...will lay out their plan for how they will break from the West...financially, monetarily -- and in other areas as well. A region-wide war in the Middle East would not be useful -- and I find it more than a coincidence that hostilities have broken out here, now that the western globalist power elite have written off their made-in-America Ukraine conflict. If Iran is drawn in, it's a certainty that their two main allies, Russia and China, will get involved as well to some degree.
Returning to gold as it concerns Russia, India and China are concerned.
Russia made an announcement very early in September that they were going to be adding to their physical gold reserves this month. Right now Russia is in the No. 5 spot, with 2,333 metric tonnes...just behind France and Italy, with 2,437 and 2,452 metric tonnes respectively. Only Germany with 3,353 tonnes -- and the U.S. with 8,133 tonnes, have more. [The numbers of people are legion, including this writer, that believe that U.S. gold reserves are not what they say.]
Setting that aside, this would be a wonderful opportunity for The Central Bank of the Russian Federation to add enough gold to their reserves to move them from No. 5...and up to the No. 3 spot.
We won't know for sure, as I've stated several times already, until their central bank updates their website with September's data on Friday, October 18...less than a week before the BRICS conference gets underway...which is no coincidence either, I'm sure. That's why I'm hoping/expecting that they will have done so.
As for India, they've been adding gold to their reserves like mad over the last year or so -- and have repatriated most if not all their physical gold reserves from London. They currently hold 840 tonnes as of the end of Q2/2024 -- and are in No. 8 spot in total gold holdings. Whether they've bought any more since then is unknown...but the 1,000 tonne mark for them is only a chip shot away.
But the elephant in the gold living room is China. Nobody believes their published gold reserves of 2,264 metric tonnes -- and both Alasdair Macleod and I are on record as stating that they currently hold at least ten times that amount. They haven't 'officially' updated their gold reserves since early 2015 -- nine years ago -- and if they decide to go public on what their reserves really are, doing so at the BRICS conference would be very apropos.
If that did occur, it's impossible to predict what would happen to the gold price going forward... but its rise would certainly blow up the LBMA and the COMEX ...plus the a lot of other things that I've already pointed out. China, Russia and the rest of the BRICS nations et al. are tired of the chains of the west... especially U.S. imperialism...so no action can be discounted if 'push' ever becomes even more 'shove' than it is now.
Needless to say, including the U.S. Presidential election not far off now, the next five weeks of world events are destined to be historic...if the human race, survives it that is.
I'm still "all in" -- and will remain so to whatever end.
I'll see you here on Tuesday.
Ed
About the author

SUBSCRIBE: https://edsteergoldsilver.com/

Ed Steer’s Daily Analysis of the Gold and Silver Markets
After eight years of writing about the precious metals for Casey Research, the folks at Stansberry & Associates—who just recently purchased controlling interest in the company—decided that my ‘niche market’ column didn’t fit into their plans.
Since the time that Casey Research was kind enough to offer me a stand-alone column, it became their most highly-rated blog almost from the outset—and has remained that way up to this date...