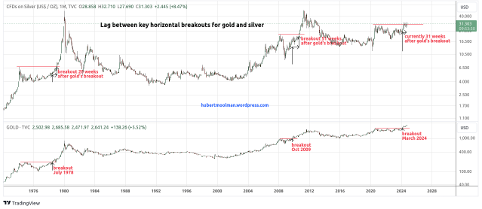
There is a similarity in how gold and silver trade at the same time period and also how they trade at similar milestones, despite the fact that those milestones are sometimes reached at different times.
This can cause silver or gold to be the leading indicator, depending on the particular milestone. However, for the most part, gold has been the leading indicator.
Here are some significant breakouts where gold was the leading indicator:

During the 1970s bull market, both silver and gold formed significant consolidation patterns after their 1974 highs. Gold was the first to break higher than its 1974 high in July 1978, whereas silver only broke higher than its 1974 high 28 weeks later.
The same occurred during the previous bull market. After peaking in March 2008, silver only cleared its peak 51 weeks after the gold breakout.
Both gold and silver formed similar consolidations after their August 2020 peaks. Gold already broke higher than its peak in March of this year. This was a clear indication that it is likely a matter of time before silver would also break higher.
Silver is now close to making a similar breakout about 32 weeks after the gold breakout.
By the time silver catches up with gold, there is often already good momentum in the market. This often makes silver’s breakouts more decisive. This translates into the best rallies (especially for silver), as was the case after the February 1979 silver breakout as well as for the October 2010 silver breakout.
So, if the silver breakout is confirmed, we are likely to see even more intense rallies than those of 2020 for both silver and gold.
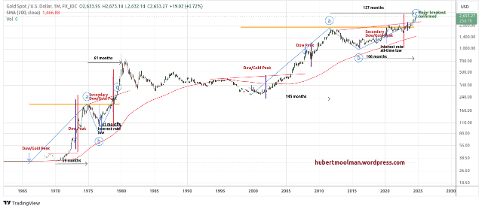
Furthermore, gold is already in a sweet spot after the major breakout in March. This is a major signal and leading indicator for the coming run to silver (and the silver breakout). Learn more at my premium gold and silver blog. For the macro gold breakout, see here:

Warm regards
Hubert Moolman

