YESTERDAY in GOLD, SILVER, PLATINUM and PALLADIUM
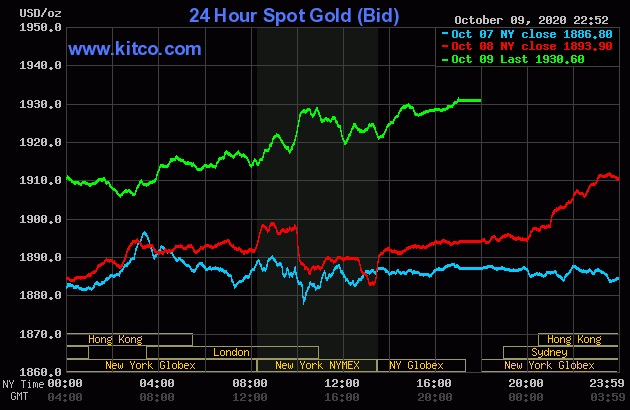
The gold price traded flat for the first two hours once trading commenced at 6:00 p.m. EDT in New York on Thursday evening. It began to head higher starting at 8 a.m. China Standard Time on their Friday morning -- and that continued until around 11:30 a.m. CST. It was sold quietly lower until the 2:15 p.m. afternoon gold fix in Shanghai was done for the day -- and from there it headed quietly and somewhat unevenly higher. That lasted right into the close of trading at 5:00 p.m. in New York -- and for all intents and purposes closed on its high tick of the day.
The low and high ticks in gold were reported as $1,898.00 and $1,936.80 in the December contract. The November/December price spread differential in gold at the close on Friday was $4.30...December/February was $7.40...February/April was $5.90 -- and April/June was $5.30.
Gold finished the Friday session in New York at $1,930.60 spot, up $36.70 from Thursday's close. Net volume was nothing special at a bit over 211,500 contracts, but certainly the highest it's been all week. There was a bit over 14,000 contracts worth of roll-over/switch volume in this this precious metal -- and virtually all of it went into the first three delivery months of next year.
|
|
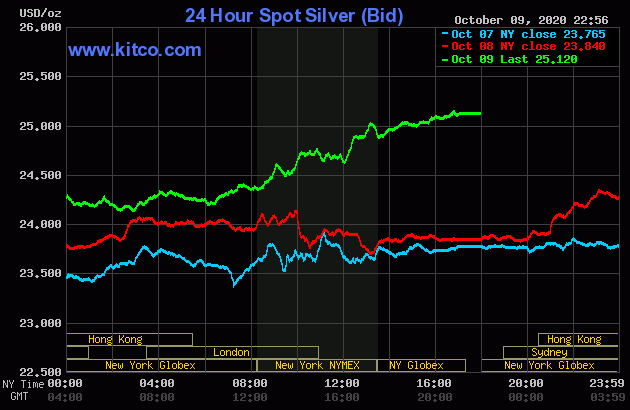
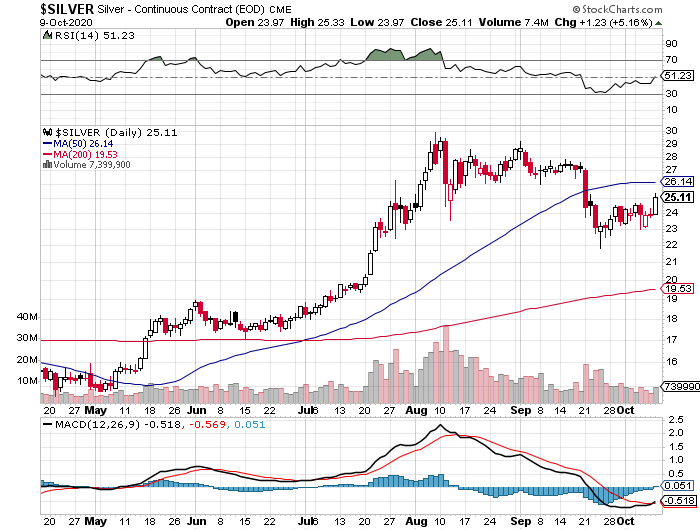
In most respects the price action in silver was the same as it was in gold, although the biggest part of Friday's rally didn't get underway until around 11:25 a.m. in London.
The low and high ticks in silver were recorded by the CME Group as $23.965 and $25.33 in the December contract.
Silver finished the Friday session at $25.12 spot, up $1.28 from its close on Thursday. Net volume was fairly decent at a bit under 68,500 contracts -- and there was just about 5,700 contracts worth of roll-over/switch volume on top of that...mostly into March and May.
|
|
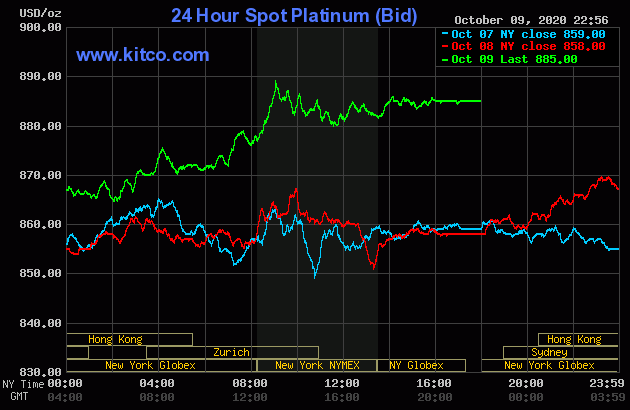
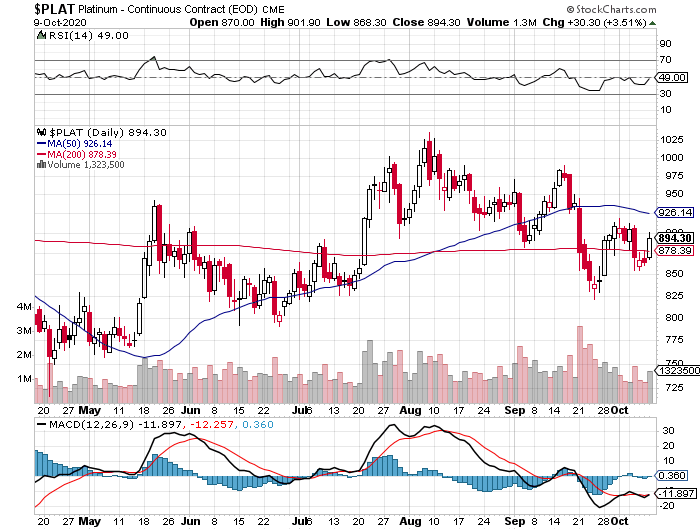
Platinum generally followed the same price path as gold -- and also began to head higher once the afternoon gold fix in Shanghai was put to bed on their Friday afternoon. Its ensuing rally ran into 'something' a minute or two after 9 a.m. in New York -- and from there, had a quiet down/up move until trading ended at 5:00 p.m. EDT. Platinum was closed at $885 spot, up 17 bucks from Thursday, but would have obviously close materially higher, if allowed...which it obviously wasn't.
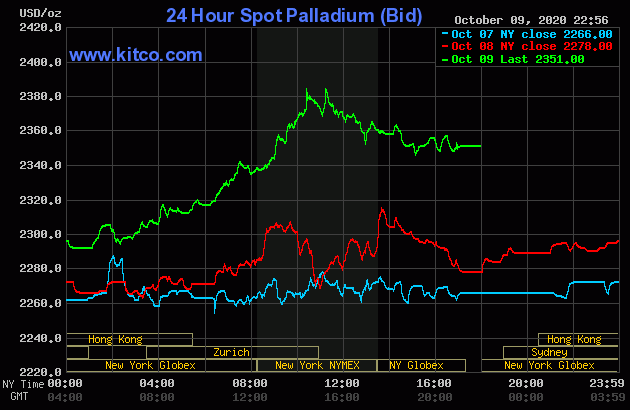
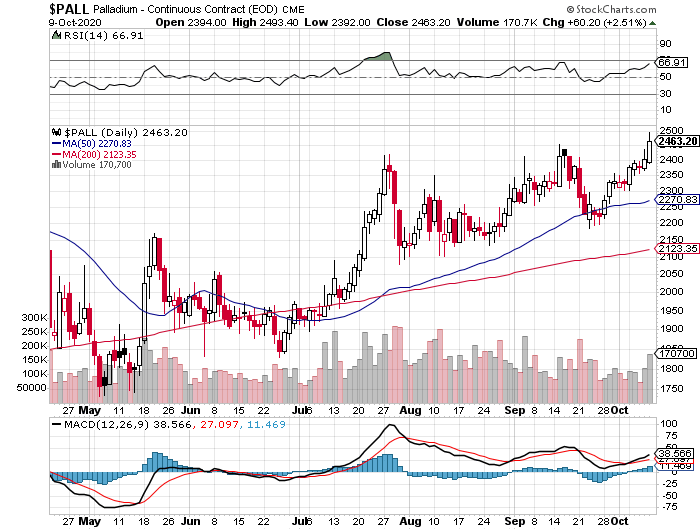
Palladium was higher by around 18 or so dollars by the 2:15 p.m. afternoon gold fix in Shanghai on their Friday -- and at that juncture the rally really got serious. So serious in fact that a not-for-profit seller appeared around 10:25 a.m. in New York -- and from that point it was sold quietly and unevenly lower until very shortly after 3 p.m. in the very thinly-traded after-hours market. It didn't do much after that. Palladium was closed at $2,351 spot, up 73 dollars on the day...but I noted that it was up $104 at one point.
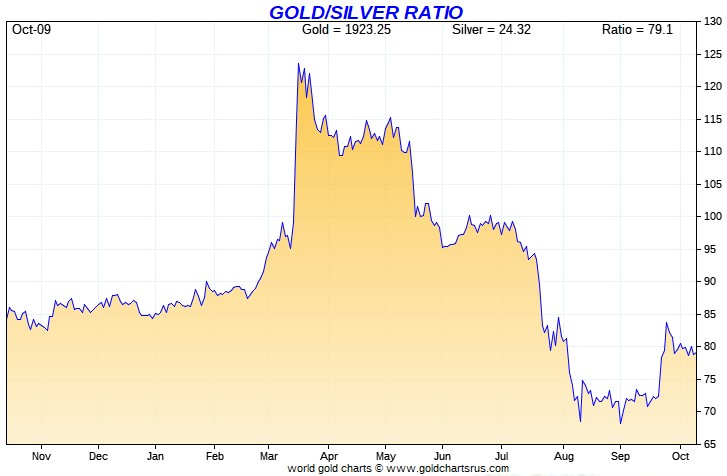
Based on the closing spot prices in silver and gold from kitco.com posted above, the gold/silver ratio worked out to 76.9 to 1 on Friday...compared to 79.4 on Thursday.
And here's the 1-year gold/silver ratio chart, courtesy of Nick Laird. Click to enlarge.
|
|
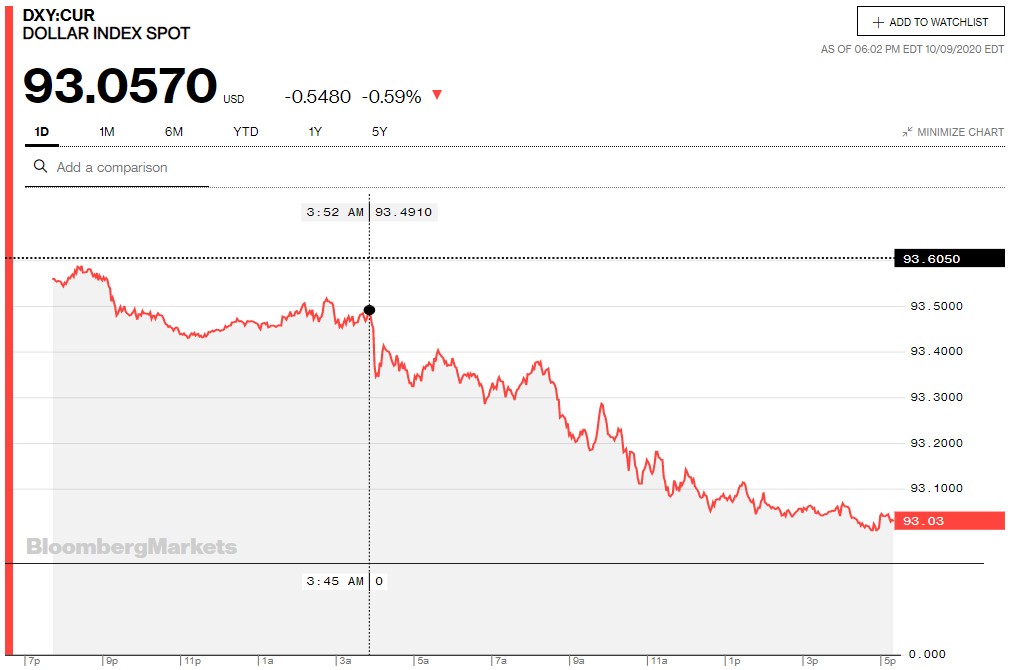
The dollar index closed very late on Thursday afternoon in New York at 93.605 -- and opened down 4.5 basis points once trading commenced around 7:45 p.m. EDT on Thursday evening, which was 7:45 a.m. China Standard Time on their Friday morning. It drifted quietly lower until 8:52 a.m. in London -- and then the decline became somewhat more intense -- and that continued until a few minutes before trading ended at 5:30 p.m. in New York.
The dollar index closed very late on Friday afternoon in New York at 93.057 -- and down 55 basis points from its close on Thursday -- and about 3 basis points higher than the spot close indicated on the DXY chart below.
And here's the DXY chart in question for Friday...courtesy of Bloomberg as always. Click to enlarge.
|
|
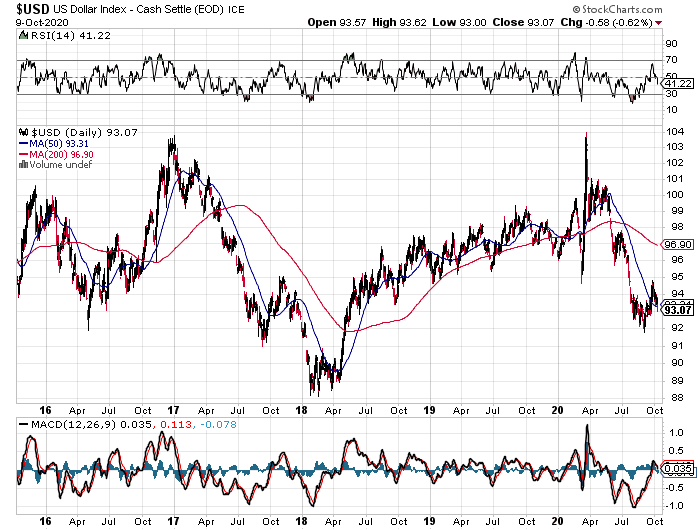
And here's te 5-year U.S. dollar index chart that appears in every Saturday column. The delta between its close...93.07...and the close on the DXY chart above, was around 1 basis point above its spot close on Friday. Its close back below its 50-day moving average on Friday is an ominous sign for any of those technical analyst types out there.
|
|
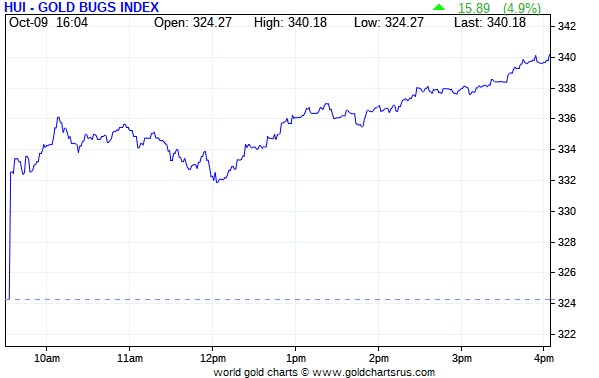
The gold shares gapped up a bunch at the 9:30 open of trading in New York on Friday morning -- and after a quiet up/down move, began to rally with some intensity starting at noon EDT. That continued right into the 4:00 p.m. close -- and the HUI finished on its high of the day, up 4.90 percent.
|
|
The price path for the silver equities was virtually the same as their golden brethren, except Nick Laird's Intraday Silver Sentiment/Silver 7 Index closed higher by 5.64 percent, held back a bit by Peñoles.
|
|
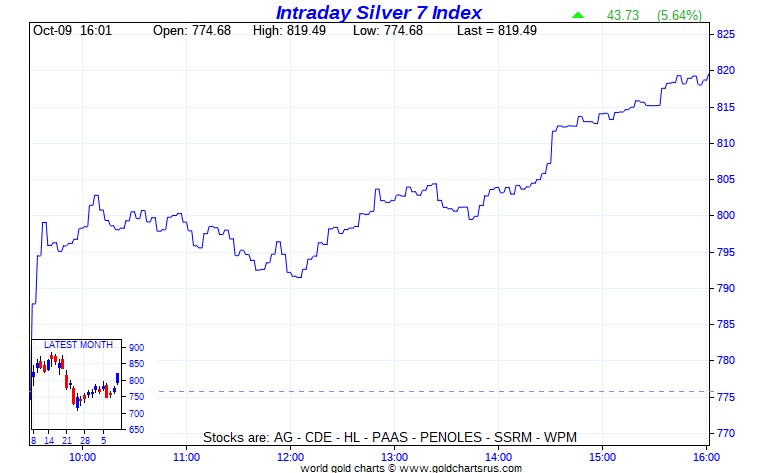
Computed manually, the Silver Sentiment/Silver 7 Index closed higher by 5.79 percent.
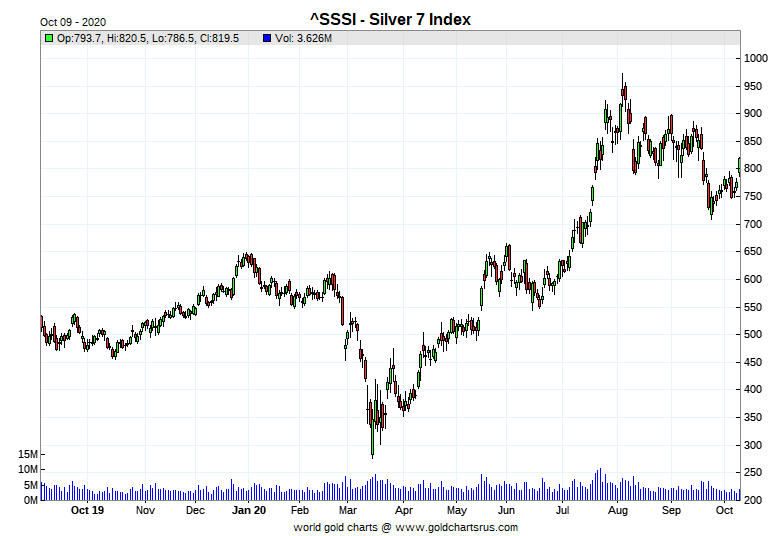
And here's Nick's 1-year Silver Sentiment/Silver7 Index chart, updated with Friday's doji. Click to enlarge as well.
|
|
The two stars yesterday were First Majestic Silver and Coeur Mining, as the former closed higher by 7.43 percent -- and the latter by 7.33 percent. But, except for Peñoles...which closed up only 2.35 percent on 2,352 shares traded...they all did well on Friday.
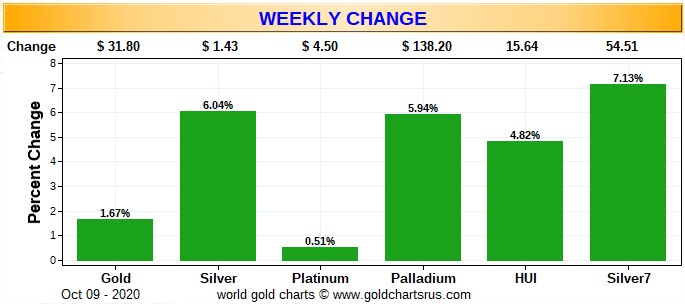
Here are the three usual charts that show up in every Saturday missive. The first one shows the changes in gold, silver, platinum and palladium for the past trading week, in both percent and dollar and cents terms, as of their Friday closes in New York - along with the changes in the HUI and the Silver 7 Index.
Here's the weekly chart and it's wall-to-wall green this week, compared to wall-to-wall red last week at this time. The silver equities outperformed their golden cousins by a bit this past week...but compared to the gains in their respective underlying precious metals, the silver stocks continue to suck wind. Click to enlarge.
|
|
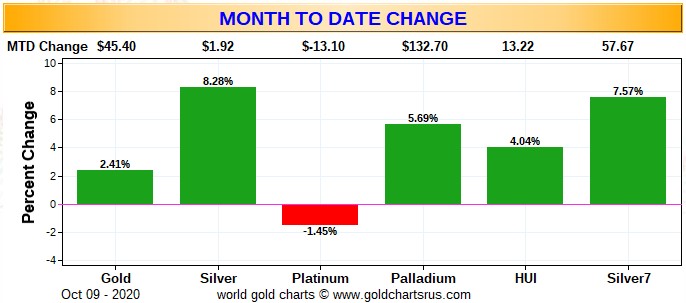
The month-to-date chart isn't much different than the weekly chart -- and that's because there were only two extra days added...October 1 & 2 -- and not much happened on either day on a net basis. Click to enlarge.
|
|
Here's the year-to-date chart. With the exception of platinum, it's still green across the board. And although the gold stocks are 'outperforming' the silver equities...all of the precious metal equities are still vastly underperforming their respective underlying precious metals. Click to enlarge.
|
|
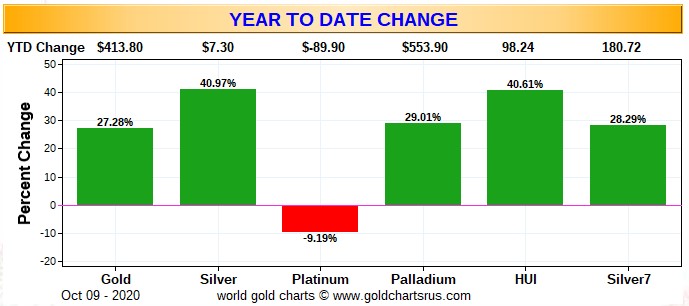
No one is happy about the underperformance of the precious metal equities, which includes me of course. And as I said in this space last week -- and the week before...'da boyz' or the high-frequency traders, are still in firm control of precious metal prices in the COMEX futures market, although they appeared to take a break on Friday. However, far brighter days will be ahead once these current engineered price declines are in the rear-view mirror. That may have started yesterday, but it would be very premature to make that judgement.
As per the COT and Days to Cover discussion a bit further down, the Big 8 traders are still mega short gold and silver in the COMEX futures market -- and that situation hasn't changed one bit from last week, or the week before, or for the last many months. But as I've said before, more than enough gold has now been brought into the COMEX warehouses to cover their short positions by physical delivery, if that's its purpose. The short positions of the Big 8 traders in silver was basically unchanged from last week -- and their short position in gold decreased by a mostly immaterial amount during this past reporting week. I have more on on this in the COT discussion further down.
The CME Daily Delivery Report showed that 1,592 gold and 161 silver contracts were posted for delivery within the COMEX-approved depositories on Tuesday.
In gold, there were six short/issuers once again -- and once again the only two that mattered were Citigroup with 1,166 contracts out of its house account, plus Goldman Sachs, with 333 contracts out of its client account. The huge list of long/stoppers contained the top three usual suspects... Barclays picked up 493 contracts, 261 for its house account, plus another 232 for clients. Next was JPMorgan, stopping 350 contracts...60 for its own account, plus another 290 for its client account. In third place was Morgan Stanley with 331 contracts...220 for its in-house/proprietary trading account -- and the list goes on and on as usual.
In silver, there were five short/issuers -- and the only two that mattered were Stonex Financial and Dutch bank ABN Amro...issuing 118 and 35 contracts respectively. There were five long/stoppers -- and the three largest were JPMorgan of course, picking up 96 contracts -- and they were followed by ADM and ED&F Man Capital, with 33 and 24 contracts. All contracts, both issued and stopped, involved their respective client accounts.
In platinum, another 202 contracts were issued and stopped. There were two/short issuers -- and a very big list of long/stoppers.
The link to yesterday's Issuers and Stoppers Report is here.
So far this month there have been 28,601 gold contracts issued/reissued and stopped -- and in silver, that number is 1,896 contracts. And for the first time I'll include platinum, as 5,052 contracts have been issued/reissued and stopped in that precious metal. That's a monstrous amount -- and has blown every prior delivery month totally out of the water.
The CME Preliminary Report for the Friday trading session showed that gold open interest in October declined by 1,582 contracts, leaving 5,841 still around, minus the 1,592 contracts mentioned a few paragraphs ago. Thursday's Daily Delivery Report showed that 1,844 gold contracts were posted for delivery on Monday, so that means that another 1,844-1,582=262 gold contracts were just added to the October delivery month. Silver o.i. in October actually rose by 43 contracts, leaving 229 still open, minus the 161 contracts mentioned a few paragraphs ago. Thursday's Daily Deliver Report showed that 16 silver contracts were posted for delivery on Monday, so that means that 43+16=59 more silver contracts were added to October.
Total gold open interest rose by a pretty chunky, but not entirely surprising 11,061 contracts on Friday -- but total silver o.i. rose by only 2,301 contracts.
I was somewhat amazed by the fact that there were no reported changes in GLD -- and even more of a surprise was the fact that another 1,395,624 troy ounces of silver was withdrawn from SLV. I suspect that Ted may have something to say about this in his weekly review later today.
The latest short report for GLD and SLV was published early yesterday evening EDT -- and these figures come to us courtesy of The Wall Street Journal.
The short position in SLV dropped from 24.08 million shares/troy ounces, down to 17.10 million shares/troy ounces...a decline of 29.00 percent. The short position in GLD also took a tumble...from 15.18 million troy ounces, down to 12.01 million troy ounces...which is a decline of 20.88 percent.
In other gold and silver ETFs and mutual funds on Planet Earth on Friday, net of any changes in COMEX, GLD and SLV inventories, there was a net 70,062 troy ounces of gold withdrawn, but there was a net and eye-watering 6,087,462 troy ounces of silver added, with the lion's share of that...5,443,327 troy ounces...going into SIVR.
There was no sales report from the U.S. Mint yesterday.
Month-to-date the mint has sold 31,500 troy ounces of gold eagles -- 8,500 one-ounce 24K gold buffaloes -- and 826,000 silver eagles.
There was a very decent amount of activity in gold over at the COMEX-approved depositories on the U.S. east coast on Thursday, as 176,701.896 troy ounces/5,496 kilobars [SGE kilobar weight] was received -- and every single kilobar ended up at Brink's, Inc. There was also 50,123 troy ounces shipped out. The largest amount was 32,151.000 troy ounces/1,000 kilobars [SGE kilobar weight] that departed Manfra, Tordella & Brookes, Inc. Next was the 17,683.050 troy ounces/550 kilobars that was shipped out of Malca-Amit USA. And lastly was the 289.359 troy ounces/9 kilobars [SGE kilobar weight] that left the JPMorgan depository.
There was a fairly decent amount of paper activity, as 160,787.151 troy ounces/5,001 kilobars [SGE kilobar weight] that was transferred from the Registered category and back into Eligible over at Brink's, Inc. The remaining 76,390.776 troy ounces/2,376 kilobars [SGE kilobar weight] made the trip in the opposite direction over at Malca-Amit USA. The link to all this, is here.
It was another very busy day in silver, as 2,334,999 troy ounces was received -- and 1,247,922 troy ounces was shipped out...as the incredible turn-over in COMEX warehouse silver stocks continues unabated -- and at record high levels. And why silver analyst Ted Butler is the only person talking about it, is a mystery to me.
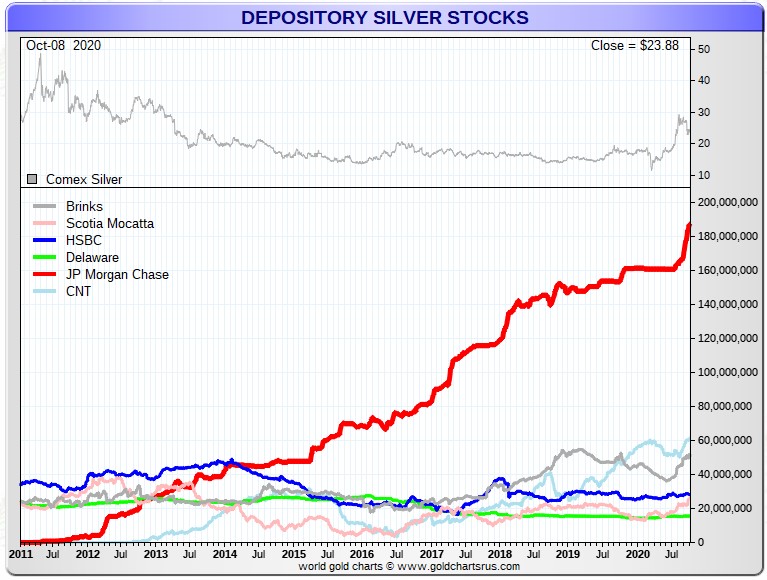
The largest 'in' amount was 900,542 troy ounces that found a home over at Loomis International. They were followed by the 840,760 troy ounces that was dropped off at CNT. And last, but certainly not least, was the truckload...593,695 troy ounces...that was added to JPMorgan new record high COMEX silver stash, which now sits at 187.86 million troy ounces.
The largest 'out' amount was the two truckloads...1,193,471 troy ounces...that left the Brink's, Inc. depository. The remaining 50,472 and 3,978 troy ounces departed HSBC USA and Delaware respectively. The link to tall this activity is here.
And while on the subject of JPMorgan's record silver stash...here's the latest chart on this from Nick, updated with the above data. Click to enlarge.
|
|
There was a bit of activity over at the COMEX-approved gold kilobar depositories in Hong Kong on their Thursday. They reported receiving 125 of them -- and shipped out 176. And except for the 50 kilobars shipped out of Loomis International, the remaining in/out activity was at Brink's, Inc. The link to that, in troy ounces, is here.
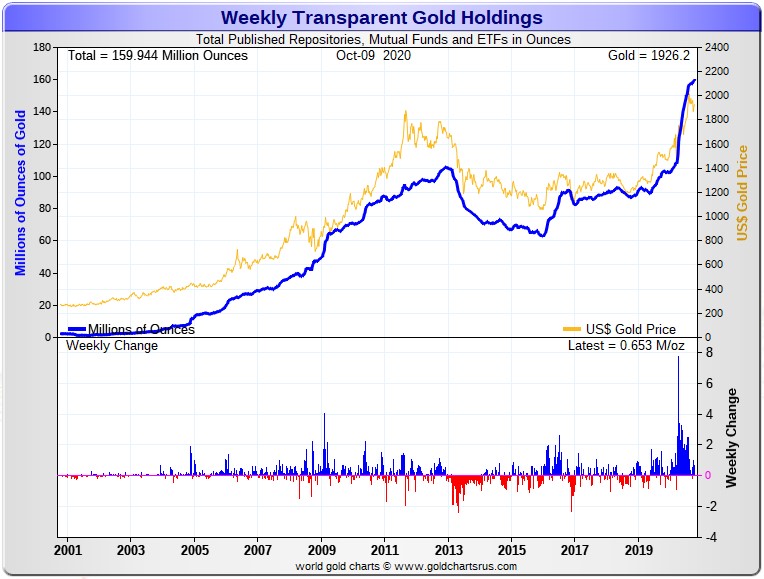
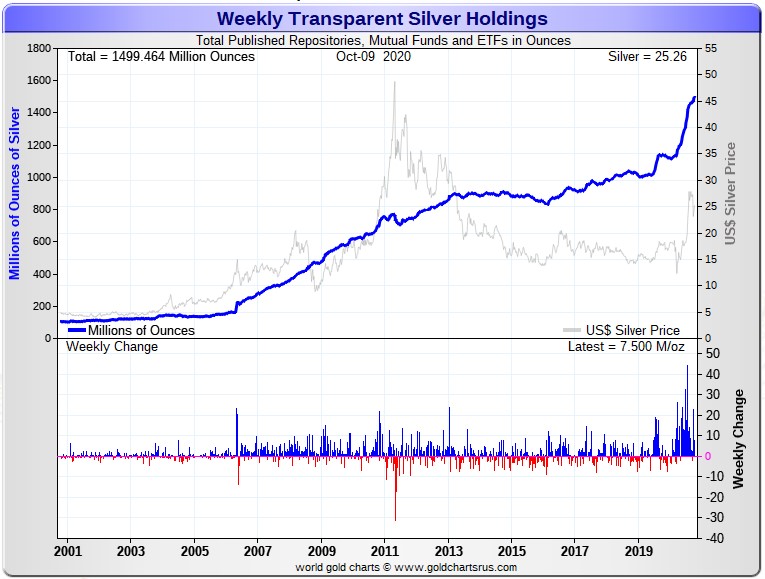
Here are the usual 20-year charts from Nick that show the total amount of physical gold and silver in all known mutual funds, depositories and ETFs as of the close of business on Friday.
During the week just past, there was a net 780,000 troy ounces of gold added. The number on the chart below shows only 653,000 troy ounces, but the COMEX warehouse stocks in gold and silver for Thursday didn't show up on his website for whatever reason, so I had to add in the net 127,000 troy ounces added on Thursday [posted above] manually. Click to enlarge.
|
|
And here's the same chart for silver -- and according to the chart, there was a net 7.5 million troy ounces added during the week. But, like in gold, I had to add the net COMEX warehouse number for Thursday...1.087 million troy ounce...in manually as well -- and that brings the net amount added during the last reporting week to 8.587 million troy ounces. Click to enlarge.
|
|
The Commitment of Traders Report, for positions held at the close of COMEX trading on Tuesday, October 6 show smallish increases in the commercial net short positions in both silver and gold.
In silver, the Commercial net short position increased by only 2,997 contracts, or 14.99 million troy ounces.
They arrived at that number by reducing their long position by 2,096 contracts -- and also increased their short position by 901 contracts. It's the sum of those two numbers that represents the change for the reporting week.
Under the hood in the Disaggregated COT Report, the Managed Money traders didn't do much -- and all the big activity was in the 'Other Reportables' and 'Nonreportable'/small trader category.
The Managed Money traders decreased their net long position by only 403 contracts, while the other two categories increased their respective net long positions...the 'Other Reportables' by 930 contracts -- and the 'Nonreportable'/small traders by 2,470 contracts.
Doing the math: 930 plus 2,470 minus 403 equals 2,997 COMEX contracts, the change in the Commercial net short position.
During the last month or so the 'Other Reportables' have gone from a short position of around 5,000 contracts, to a net long position of a hair under 6,000 contracts as of Tuesday's cut-off.
Ted has been commenting on this for several weeks now...wondering who these traders are -- and what they might know that we don't. The increase was even more stark in gold.
The Commercial net short position in silver now stands at 56,196 contracts, or 281.0 million troy ounces. In last week's COT Report, the Commercial net short position by 53,199 contracts, or 266.0 million troy ounces.
The Big 8 traders are net short 71,367 COMEX contracts...356.8 million troy ounces...which is 127 percent of the Commercial net short position.
In last week's COT Report, the Big 8 traders were net short 70,946 COMEX contracts, so they've increased their short position by a rather smallish 421 contracts during the last five business days.
Ted said that it didn't look like JPMorgan did anything during the reporting week -- and are still market neutral in silver for the second week in a row.
Here's Nick's 3-year COT chart for silver, updated with yesterday's data -- and there really isn't very much to see. Click to enlarge.
|
|
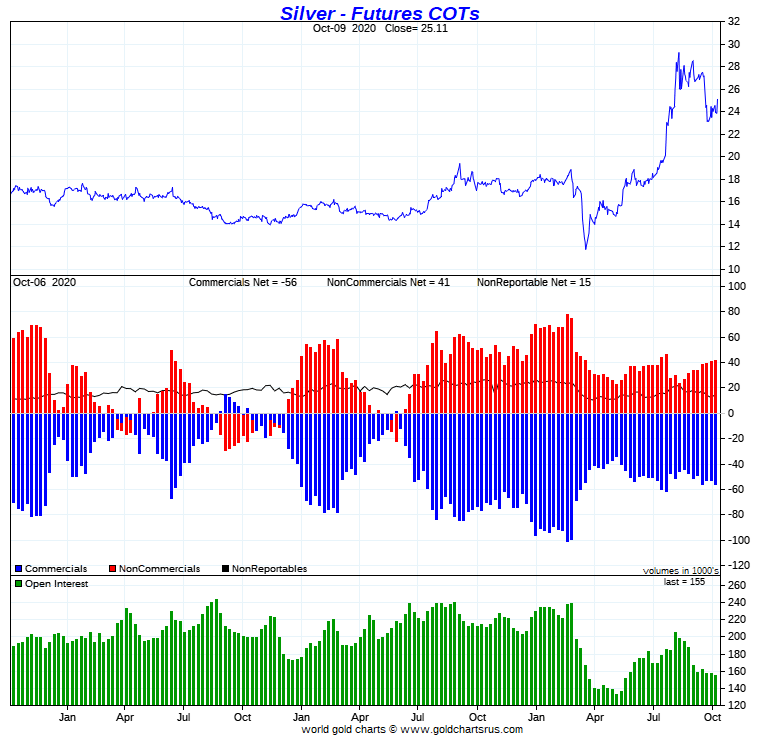
The Big shorts are still trapped like rats -- and their short position in silver has remained about the same for a very long time. From a COT standpoint, the structure is still very much on the bullish side.
In gold, the commercial net short position increased by a scant 2,290 contracts...229,000 troy ounces, which is mostly a rounding error in the grand scheme of things.
They arrived at that number by decreasing their long position by 9,256 contracts -- and also reduced their short position by 6,966 contracts -- and it's the difference between those two numbers that represents their change for the reporting week.
Like in silver, the Managed Money traders did very little, decreasing their net long position by a paltry 240 contracts. And also like in silver, the big action was with the other two categories.
The 'Other Reportables' increased their net long position to yet a new record high, this week by a chunky 4,688 contracts. The 'Nonreportable'/small traders went in the opposite direction...decreasing their net long position by 2,638 contracts.
Doing the math: 240 plus 4,688 minus 2,638 equals 2,290 COMEX contracts...the change in the commercial net short position.
The commercial net short position in gold now sits at 28.85 million troy ounces, up from the 28.62 million troy ounces they were short in last week's COT Report.
The Big 8 traders are net short 23.83 million troy ounces of gold, or 82.6 percent of the commercial net short position. Last week at this time, the Big were net short 24.24 million troy ounces, so they cut their short position by about 4,100 COMEX contracts, or 410,000 troy ounces of gold during this past reporting week...which is really nothing at all.
Ted said that there didn't appear to be any change in JPMorgan's position in the COMEX futures market in gold...which remains market neutral.
Here's Nick's 3-year COT chart for gold, updated with Friday's data -- and there's not a lot to see here, either. Click to enlarge.
|
|
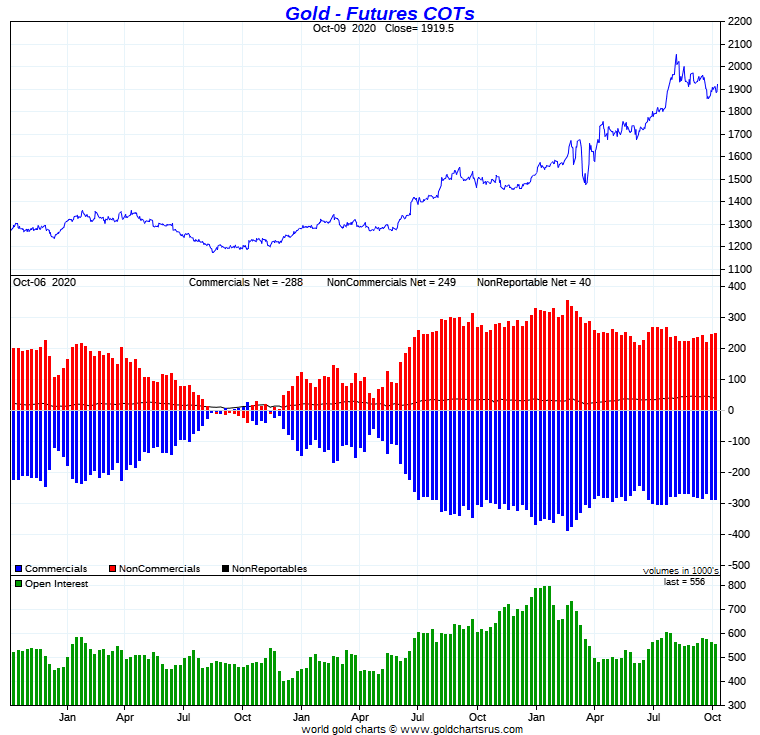
Like in silver, the Big 8 are still trapped on the short side, at least on paper -- and it remains to be seen if any or all of this gold that's been brought into the COMEX depositories over the last six months is about to be used to extinguish it. Maybe that's what these big deliveries in gold are all about, at least in part. And from a futures market perspective, the set-up in gold is very bullish as well.
But the stand-out feature of these two reports is the ever-increasing long positions being put on by the traders in the 'Other Reportables' category -- and Ted has been right to ask..."Who are those guys?" We'll find out in due course, I'm sure.
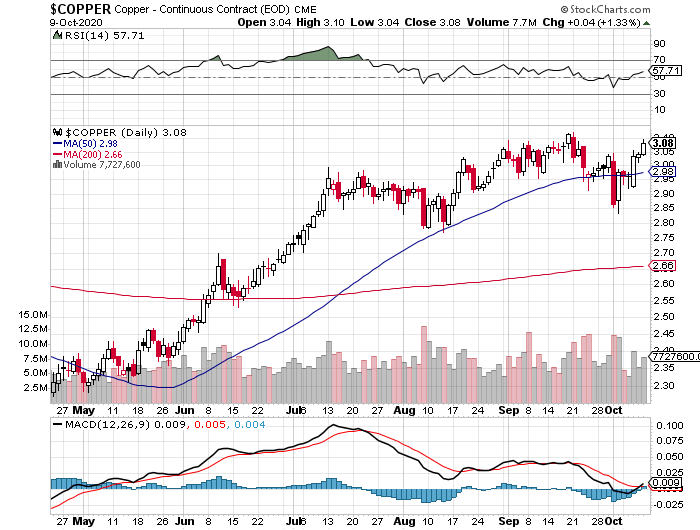
In the other metals, the Managed Money traders in palladium decreased their net long position by a tiny 14 COMEX contracts during the last reporting week -- and are net long the palladium market by 3,521 contracts...around 37 percent of the total open interest...down about 2 percentage points from last week. As I keep pointing out, the COMEX futures market in palladium, is a market in name only. In platinum, the Managed Money traders traders reduced their net long position by a further 494 COMEX contracts -- and are now net short the platinum market by 759 COMEX contracts. The traders in the Swap Dealer, Other Reportables -- and Nonreportable/small trader category continue to be net long big time against the Big 8 shorts...JPMorgan et al. in the Producer/Merchant category. In copper, the Managed Money traders decreased their net long position by a further 7,049 contracts during this last reporting week -- and are net long copper by 69,649 COMEX contracts...about 1.74 billion pounds of the stuff...about 30 percent of total open interest, down about 2 percentage points from last week.
Here's Nick Laird's "Days to Cover" chart, updated with the COT data for positions held at the close of COMEX trading on Tuesday, October 6. It shows the days of world production that it would take to cover the short positions of the Big 4 - and Big '5 through 8' traders in each physically traded commodity on the COMEX. Click to enlarge.
|
|
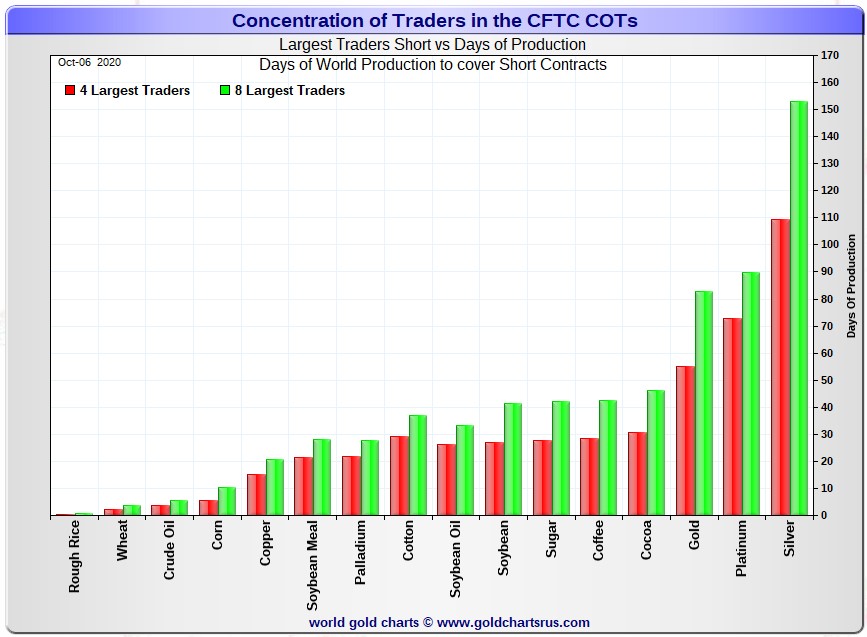
The Big 4 traders are short about 109 days of world silver production, unchanged from last week's report. The '5 through 8' large traders are short an additional 44 days of world silver production...up one day from last week's COT Report - for a total of about 153 days that the Big 8 are short...obviously up one day from last week's report. This represents a bit over five months of world silver production, or about 357 million troy ounces of paper silver held short by the Big 8. [In the prior reporting week, the Big 8 were also short 152 days of world silver production.]
In the COT Report above, the Commercial net short position in silver was reported by the CME Group at about 281 million troy ounces. As mentioned in the previous paragraph, the short position of the Big 8 traders is around 357 million troy ounces. So the short position of the Big 8 traders is larger than the total Commercial net short position by about 357-281=76 million troy ounces...down about 13 million troy ounces from last week's report.
The reason for the difference in those numbers...as it always is...is that Ted's raptors, the 32-odd small commercial traders other than the Big 8...which includes JPMorgan...are net long that amount.
Another way of stating this [as I say every week in this spot] is that if you remove the Big 8 commercial traders from that category, the remaining traders in the commercial category are net long the COMEX silver market. It's the Big 8 against everyone else...a situation that has existed for over three decades in both silver and gold -- and in platinum and palladium as well.
As per the first paragraph above, the Big 4 traders in silver are short around 109 days of world silver production in total. That's a bit over 27 days of world silver production each, on average...unchanged from last week's report. The four big traders in the '5 through 8' category are short 44 days of world silver production in total, which is 11 days of world silver production each, on average...up a bit from last week's report.
The Big 8 commercial traders are short 45.9 percent of the entire open interest in silver in the COMEX futures market, which is up a tiny bit from the 45.1 percent they were short in last week's COT report. And once whatever market-neutral spread trades are subtracted out, that percentage would be over the 50 percent mark by a bit. In gold, it's 42.9 percent of the total COMEX open interest that the Big 8 are short, which is down a tiny amount from the 43.1 percent they were short in last week's report -- and around the 50 percent mark once the market-neutral spread trades are subtracted out.
In gold, the Big 4 are short 55 days of world gold production, up 1 day from last week's COT Report. The '5 through 8' are short another 28 days of world production, down 2 days from last week's report...for a total of 83 days of world gold production held short by the Big 8... obviously up 1 day from last week's COT Report. Based on these numbers, the Big 4 in gold hold about 66 percent of the total short position held by the Big 8...up about 2 percentage points from last week's report.
According to Ted -- and for the second week in a row, JPMorgan is market neutral in both silver and gold from a COMEX future market perspective.
The "concentrated short position within a concentrated short position" in silver, platinum and palladium held by the Big 4 commercial traders are about 71, 81 and 79 percent respectively of the short positions held by the Big 8...the red and green bars on the above chart. Silver is down 1 percentage point from last week's COT Report...platinum is unchanged from a week ago -- and palladium is up about 3 percentage points week-over-week.
The Big 8 shorts are still hugely exposed in all four precious metal, at least in the COMEX futures market. Their short position in silver remained virtually unchanged during the last reporting week -- and they decreased their short position in gold by a tiny amount over the same period.
They've made virtually no progress at all in the last many months -- and appear firmly locked into their current $14 billion in both realized and unrealized loses. Any changes in that number since the Tuesday cut-off would show an increase of some size.
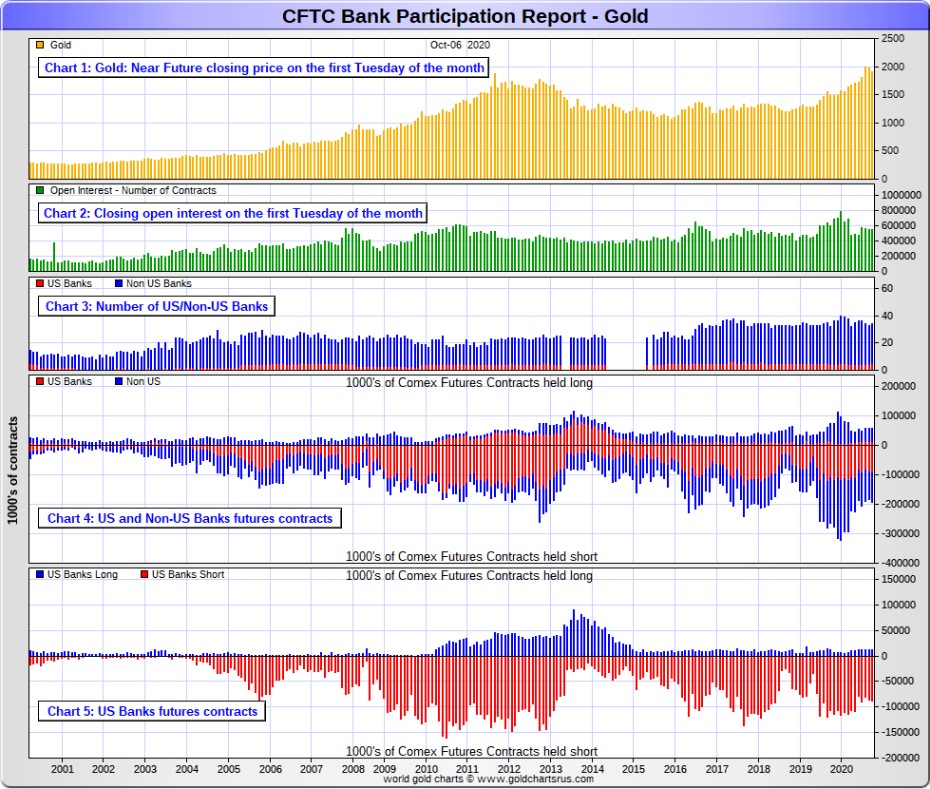
The October Bank Participation Report [BPR] data is extracted directly from yesterday's Commitment of Traders Report. It shows the number of futures contracts, both long and short, that are held by all the U.S. and non-U.S. banks as of Tuesday's cut-off in all COMEX-traded products. For this one day a month we get to see what the world's banks are up to in the precious metals -and they're usually up to quite a bit.
[The October Bank Participation Report covers the time period from September 1 to October 6 inclusive.]
In gold, 5 U.S. banks are net short 76,993 COMEX contracts in the October BPR. In September's Bank Participation Report [BPR] 4 U.S. banks were net short 74,838 contracts, so there was an increase of 2,155 COMEX contracts from four weeks ago, which is not a material change at all. However, this was a bit of a surprise considering how much the gold price was engineered lower during the reporting period.
Citigroup, HSBC USA, Goldman Sachs and possibly Morgan Stanley would hold the lion's share of this short position. As to who other U.S. bank might be that are short in this BPR, I haven't a clue, but it's a given that their short position would not be material.
Also in gold, 29 non-U.S. banks are net short 59,009 COMEX gold contracts. In September's BPR, these same 29 non-U.S. banks were net short 49,345 COMEX contracts...so the month-over-month change shows a very decent increase of 9,664 COMEX contracts...which is also a bit of a surprise considering the price activity during the reporting month.
But at the low back in the August 2018 BPR...these same non-U.S. banks held a net short position in gold of only 1,960 contacts -- and they've been back on the short side in a big way ever since.
However, as I always say at this point, I suspect that there's at least two large non-U.S. bank in this group, one of which would be Scotiabank/Scotia Capital. However, I have my suspicions about Barclays, Dutch Bank ABN Amro, plus Australia's Macquarie as well. Other than that small handful, the short positions in gold held by the vast majority of non-U.S. banks are mostly immaterial.
As of this Bank Participation Report, 34 banks [both U.S. and foreign] are net short 24.5 percent of the entire open interest in gold in the COMEX futures market, which is up a bit from the 22.6 percent 33 banks were short in the September BPR.
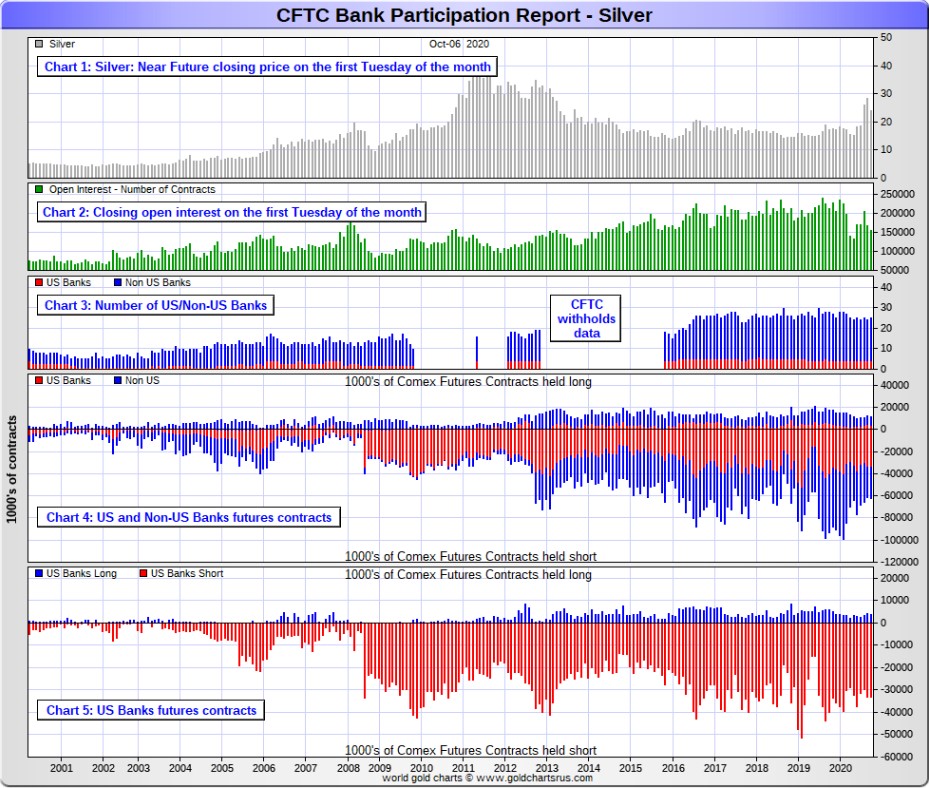
Here's Nick's BPR chart for gold going back to 2000. Charts #4 and #5 are the key ones here. Note the blow-out in the short positions of the non-U.S. banks [the blue bars in chart #4] when Scotiabank's COMEX short position was outed by the CFTC in October of 2012. Click to enlarge.
|
|
In silver, 4 U.S. banks are net short 29,302 COMEX contracts in October's BPR. In September's BPR, the net short position of these same 4 U.S. banks was 28,864 contracts, so the short position of the U.S. banks has increased by a smallish 438 contracts month-over-month. Like in gold this was a bit of a surprise, considering the big hit silver took during this past reporting period -- and that doesn't include what happened after the COMEX close this past Tuesday.
As in gold, the three biggest short holders in silver of the four U.S. banks in total, would be Citigroup, HSBC USA -- and Goldman in No. 3 spot -- and whomever is in the number 4 spot, like in gold, their short position would be immaterial.
Also in silver, 21 non-U.S. banks are net short 21,115 COMEX contracts in the September BPR...which is up a bit from the 20,796 contracts that 20 non-U.S. banks were short in the September BPR. I would suspect that Canada's Scotiabank/Scotia Capital holds a goodly chunk of the short position of these non-U.S. banks. I also suspect that a number of the remaining 20 non-U.S. banks may actually be net long the COMEX futures market in silver. But even if they aren't, the remaining short positions divided up between these other 20 non-U.S. banks are immaterial - and have always been so.
As of October's Bank Participation Report, 25 banks [both U.S. and foreign] are net short 32.5 percent of the entire open interest in the COMEX futures market in silver-up a bit from the 29.9 percent that 24 banks were net short in the September BPR. And much, much more than the lion's share of that is held by Citigroup, HSBC USA, Goldman, Scotiabank -- and maybe one other non-U.S. bank.
Here's the BPR chart for silver. Note in Chart #4 the blow-out in the non-U.S. bank short position [blue bars] in October of 2012 when Scotiabank was brought in from the cold. Also note August 2008 when JPMorgan took over the silver short position of Bear Stearns-the red bars. It's very noticeable in Chart #4-and really stands out like the proverbial sore thumb it is in chart #5. Click to enlarge.
|
|
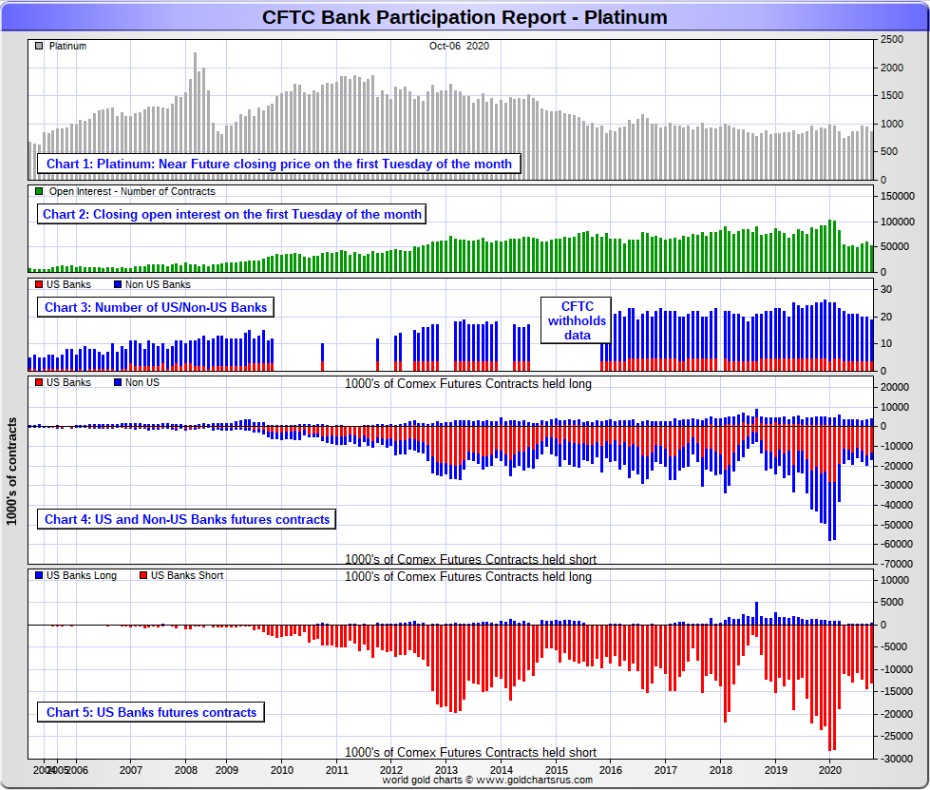
In platinum, 4 U.S. banks are net short 12,440 COMEX contracts in the October Bank Participation Report. In the September BPR, these same 4 U.S. banks were net short 14,064 COMEX contracts...the first decrease in the last four months.
[At the 'low' back in July of 2018, these same U.S. banks were actually net long the platinum market by 2,573 contracts -- and they've still got a long way to go to get back to that number, if they ever do.]
Also in platinum, 15 non-U.S. banks are net short only 161 COMEX contracts in the October BPR, which is down significantly from the 2,249 COMEX contracts that 16 non-U.S. banks were net short in the September BPR.
[Note: Back at the July 2018 low, these same non-U.S. banks were net short 1,192 COMEX contracts...so this month's BPR shows a new record low short position]
And as of October's Bank Participation Report, 19 banks [both U.S. and foreign] are net short 24.3 percent of platinum's total open interest in the COMEX futures market, which is down a bit from the 27.0 percent that 20 banks were net short in September's BPR. But it's the U.S. banks, or most likely their clients, that are on the short hook big time. They have little chance of delivering into their short positions, although 5,000 platinum contracts have already been delivered in October so far. Despite that, they're still very short the COMEX futures market -- and may be forced to cover the rest at some point.
Here's the Bank Participation Report chart for platinum. Click to enlarge.
|
|
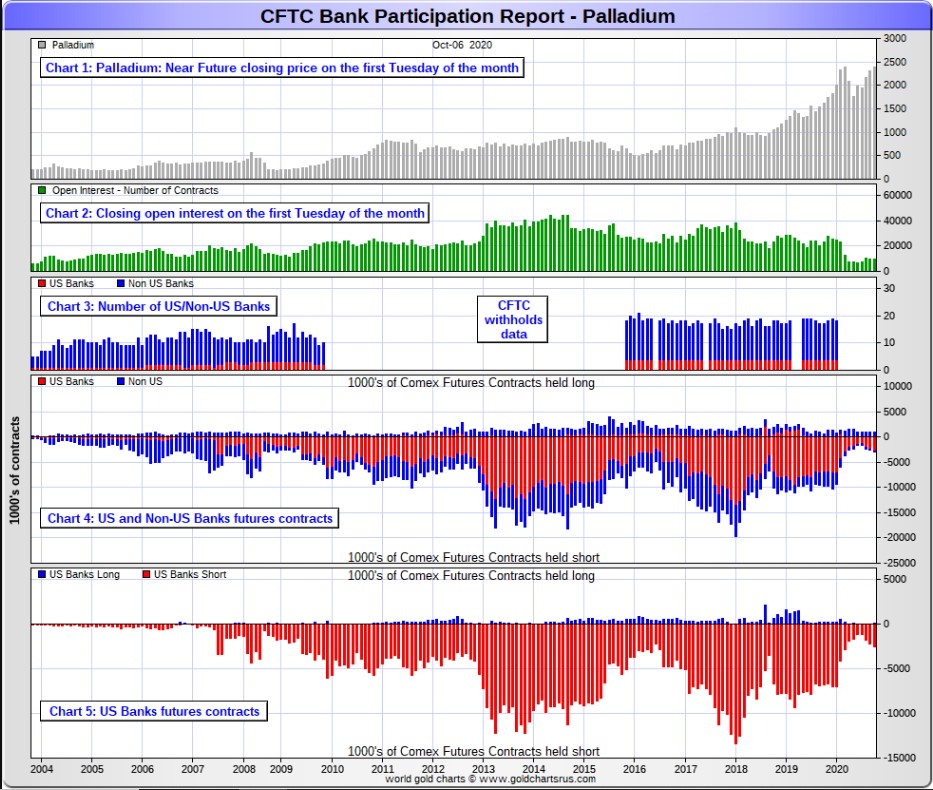
In palladium, '3 or less' U.S. banks are net short 2,530 COMEX contracts in the October BPR, up from the 2,183 contracts that these same '3 or less' U.S. banks were net short in the September BPR. This is the third month in a row that the U.S. banks have increased their short position in palladium. They were short only 1,194 COMEX contract in the July BPR.
Also in palladium, '7 or more' non-U.S. banks are net long 426 COMEX contracts-precisely unchanged from the 426 COMEX contracts that '8 or more' non-U.S. banks were net long in the September BPR.
And as I've been commenting for almost forever now, the COMEX futures market in palladium is a market in name only, because it so illiquid and thinly-traded. Total open interest at Tuesday's cut-off was only 9,481 contracts.
As of this Bank Participation Report, 10 banks [both U.S. and foreign] are net short 22.2 percent of the entire COMEX open interest in palladium...up from the 18.1 percent of total open interest that 11 banks were net short in September. Because of the small numbers of contracts involved, along with a tiny open interest, these numbers are pretty much meaningless.
So, for the seventh month in a row, the world's banks are no longer involved in the palladium market in a material way -- and if they are, I suspect that it's their clients that are on the hook.
Here's the palladium BPR chart. And as I point out every month, you should note that the U.S. banks were almost nowhere to be seen in the COMEX futures market in this precious metal until the middle of 2007-and they became the predominant and controlling factor by the end of Q1 of 2013. They have imploded into insignificance over the last six or seven Bank Participation Reports, although their short position has been sneaking higher for the last three months. It remains to be seen if they return as big short sellers again at some point like they've done in the past. Click to enlarge.
|
|
Except for palladium, only a small handful of the world's banks still have meaningful short positions in the other three precious metals -- and in most cases, it's their clients that are the ones on the short hook, not the banks themselves.
I don't know if it means anything, but the one stand-out feature in this latest Bank Participation Report was the fact that, with no exceptions, the U.S. banks increased their short positions in all four precious metals.
A mentioned further up, JPMorgan sold its remaining long positions in both silver and gold -- and is currently market neutral in both as of this week's COT Report. It may be out in platinum and palladium as well, but there's no way to know that.
After the big down move after the COMEX close on Tuesday, the precious metals are certainly set up for a rocket ride higher when JPMorgan allows it -- and we're already off the launch pad in all four after Friday's trading session.
But when things get really serious to the upside, it will be very much to the detriment of those Big 8 shorts in particular -- and the rest of the shorts in general, as their short covering will be the rocket fuel that drives precious metal prices to the moon, particularly silver.
I don't have all that much in the way of stories, articles or videos for you today.
CRITICAL READS
Rosenberg: We Are in a Depression
Disney is laying off 28,000 workers. American Airlines and United Airlines plan to cut 31,000 workers. Last week's disappointing unemployment report shows that we have a long way to go. Perhaps a lot longer than we think.
I'm going to quote at length from my friend David Rosenberg, who I believe is absolutely spot on:
"You tally up these sectors and before the crisis, they supported 32 million jobs, or about a third of the private sector workforce, and it looks to me as though half of them are not going back to their old jobs.
"And I'm not sure many people understand that amusement parks, airlines, hoteliers and restaurants cannot stay in business at 50% capacity (or even 75% in the case of restaurants).
"... As it stands, the U.S. Chamber of Commerce said that 25% of small businesses have already shut down. Another survey by Ipsos concluded that two-thirds are still nervous about leaving their homes; 59% say they intend to remain locked down on their own until signs emerge that the virus is 'fully contained.' A YouGov/CBS poll concludes that 85% of American households say they wouldn't get on an airplane even if they could. That's why the industry needs a bailout!
"A Washington Post/University of Maryland poll shows that only 56% of consumers across the nation intend to shop at the supermarket, which I suppose is a continuous bullish data point for delivery services but that's about it. Just 33% say they are comfortable entering a retail store. And a mere 22% say they are willing to dine in a sit-in restaurant.
"All these polls say basically the same thing - it will not be 'business as usual,' as the bulls will try and convince you, and the best we can hope for is a partial recovery. I mean, at best. What we had on our hands was a vertical down economic decline with job losses an order of magnitude higher than anything we have witnessed since the Great Depression. So, even as the stock market is telling you it has it all figured out, I can assure you that what we face at this very moment is a very uncertain economic future. And unfortunately, most of the longer-term risks are to the downside.
"We are in a depression - not a recession, but a depression. And I think the dynamics of a depression are different than they are in a recession because depressions invoke a secular change in behavior. Classic business cycle recessions are forgotten about within a year after they end - the scars from this one will take years to heal."
Know this: That which can't go on, won't. We can't keep piling on debt at this rate forever, and we can't repay what we have.
This worthwhile John Mauldin commentary appeared on the Zero Hedge website at 7:40 p.m. on Friday evening EDT -- and another link to it is here. Gregory Mannarino's post market close rant for Friday is linked here.
The country is struggling - many of our citizens and businesses are suffering. But at this point I'm leery that potential benefits justify the enormous risks associated with unchecked fiscal and monetary stimulus. A deeper and more problematic crisis awaits when this runaway Bubble has finally run its course. And don't for a second succumb to the notion that more "money" and spending will resolve problems. I fear the nightmare scenario where market confidence in the Fed and Washington falters right when the system is in the throes of a bursting financial Bubble.
A 12.5% U.S. corporate default rate would be incongruous with record stock prices. It would certainly conflict with current corporate bond yields (and ETF share prices). Why the extraordinary divergence between ebullient markets and a depressing spike in corporate defaults?
In spite of the dismal Credit backdrop for many companies, overall financial conditions remain extraordinarily loose. Weird. The vast majority of companies today enjoy ultra-easy access to cheap finance - compliments of bountiful monetary and fiscal stimulus. Yet the system is acutely vulnerable to any de-risking/deleveraging dynamic and attendant tightening of financial conditions.
How might this play out around the election? The dollar should be vulnerable to prospects for ongoing egregious monetary and fiscal stimulus. One would think massive supply on the horizon makes Treasuries susceptible, although bonds glare at the Weird stock market and see a Bubble very much on borrowed time. One of these days, instability in the dollar and Treasury market might have the Fed thinking twice about boundless QE. A clean sweep by the Dems might prove more of a test than currently anticipated by an irrationally exuberant stock market.
This interesting commentary from Doug showed up on his Internet site in the very wee hours of Saturday morning -- and another link to it is here.
U.K. economy records slowest GDP rise since pandemic
The U.K. economy grew 2.1% in August, according to data released Friday that showed the slowest monthly gain since the initial lock-downs.
The gain in gross domestic product leaves the U.K. economy 9.1% below February levels, according to the Office for National Statistics. It also was below economist expectations for growth of 4.6%.
U.K. GDP had climbed 6.4% in July, 9.1% in June and 2.7% in May. The slowing growth figures are concerning as the U.K. has subsequently tightened restrictions in several areas due to rising cases of coronavirus.
In August, construction improved by 3% and services output rose 2.4%, while production rose 0.3%, manufacturing rose 0.7% and agriculture fell 0.7%.
"Ultimately though this is all 'old news', and with COVID-19 becoming more prevalent across the U.K. once again, we think it is fairly likely that October's GDP will go into reverse," said James Smith, an economist at ING. He estimates a two-week closure of hospitality at a national level could drag monthly GDP lower by between 2% and 3%.
This brief news item was posted on the marketwatch.com Internet site at 2:28 a.m. EDT on Friday morning -- and was updated ten hours later. It comes to us courtesy of Swedish reader Patrik Ekdahl -- and another link to it is here.
Russia's Strategic Intervention in Syria Five Years On - An 'Unpardonable Blow' to U.S. Empire
Five years ago this month, Russia began conducting fateful military operations in Syria at the request of the government in Damascus. It was a momentous "turning point," as noted by Syria's President Assad this week, whose nation is slowly rising from the ashes of war.
More than salvaging Syria from a nearly decade-long war - vitally important though that was - Russia's pivotal intervention also marked the strategic setback for a Western-backed campaign of regime change and wanton illegal war-making across the Middle East and North Africa.
That decisive blow against the presumed hegemony of the United States and its NATO allies is no doubt a factor in the seeming relentless efforts by the West to isolate and smear Russia with sanctions and other provocations, efforts that continue unabated to the present day.
Russia's intervention was a principled response to aid an historic ally, the Syrian Arab Republic. The Levantine nation was at the time already assailed for four years by an array of illegally armed militant groups which were threatening to over-run the country. These groups comprised hundreds of thousands of mercenaries from dozens of countries and were lionized in Western media as "rebels" in a deceptive propaganda cover for the fact that they were in reality hardcore terrorists slaughtering their way to Damascus. These "rebels" beloved by Western governments and media carried out beheadings and other unspeakable atrocities against civilians.
What the Western media also referred to as Syria's "civil war" is another cynical propaganda ruse to conceal the fact that the conflict was in reality a foreign-sponsored proxy war of aggression.
The plot to overthrow the Arab state was years in the making by Western powers which viewed its alliance with Russia and Iran as an unacceptable resistance to their imperialistic diktats and objectives.
The Russian leadership was under no illusion. President Vladimir Putin and the Kremlin knew what was at stake. Western powers were trying to turn Syria into a failed state, to break the nation with a brutal assault by ghoulish proxies, and in that way pave the way for regime change to create a client-state in Damascus that would henceforth do the West's bidding in terms of Middle Eastern geopolitics. The nefarious plan would come at the price of destroying Syria and its ancient multi-ethnic and multi-religious civilization along with hundreds of thousands of lives lost and millions of people turned into refugees.
This rather brief essay put in an appearance on the strategic-culture.org Internet site on Friday sometime -- and I thank Roy Stephens for sharing it with us. Another link to it is here.
China's central bank will issue 10 million yuan ($2 million) of digital currency to 50,000 randomly selected consumers in what some see as the country's first public test of the digital yuan payment system.
The People's Bank of China's (PBOC) campaign comes as central banks worldwide race to issue digital currencies to modernise payments systems and fend off potential competition from privately issued cryptocurrencies.
Starting Friday (local time), any individuals in China's southern city of Shenzhen can apply to join the program through the country's big four banks. But only some will be awarded a 200-yuan "red envelope" via a lottery, according to the local Government and the lenders.
Anyone in Shenzhen can apply to join the lottery until Monday, while winners will be awarded the red envelope on October 12 after they download an app for the digital currency and register for a digital wallet.
The winners can use the digital currency in 3,389 retail outlets in Shenzhen including Sinopec gas stations, Walmart stores, CR Vanguard malls and Shangri-La hotels.
He suggested the PBOC expand pilot schemes to more Chinese cities and officially launch the digital currency as soon as possible to meet public needs.
This story was posted on the abc.net.au Internet site on their Friday sometime -- and I thank Australian reader Garry Robinson for pointing it out. Another link to it is here. A directly related Zero Hedge article from 8 p.m. EDT on Friday evening is headlined "The Circle is Complete: BoJ Joins Fed and ECB In Preparing Rollout of Digital Currency"
Sprott Money News Weekly Wrap-up
Legendary investor Eric Sprott discusses current events impacting the precious metals markets -- and in the process rakes the CFTC over the coals. He then looks ahead to the pending earnings releases of some of the major mining companies.
The audio interview, recorded late on Thursday afternoon EDT, runs for about 26 minutes -- and was posted on the youtube.com Internet site on Friday sometime -- and another link to it is here.
Asia Gold: India flips to premium as jewellers bank on festive revival
Physical gold was sold at a premium in India this week for the first time since mid-August as jewellers stocked up, hoping key festivals would bring customers back to stores.
Indians will celebrate Dussehra in late October and Diwali and Dhanteras in November, when buying gold is considered auspicious.
"Industry is banking on festivals for demand revival. Jewellers would be happy even if they manage to sell 50% of the last year," said a Mumbai-based dealer with a bullion importing bank.
Dealers charged premiums of $2 an ounce over official domestic prices, inclusive of 12.5% import and 3% sales levies, versus last week's $6 discounts. Local gold futures traded around 50,550 rupees per 10 grams on Friday.
"Jewellers have started making purchases for festivals," said Chanda Venkatesh, managing director of CapsGold, a bullion merchant based in the southern city of Hyderabad.
"Retail buyers have been delaying purchases for the last few months. Jewellers are hopeful they will start buying during the festivals."
In neighbouring Bangladesh, some people resorted to selling gold with the coronavirus outbreak having shuttered businesses and choking incomes.
"As per our records, around 20,000 families sold ornaments since late March," said Enamul Haque Khan, president of the Bangladesh Jewellers Association.
This gold-related Reuters story, co-filed from Bengaluru and Mumbai early on Friday morning EDT, was something I found on Sharps Pixley -- and another link to it is here.
The PHOTOS and the FUNNIES
The first two photos were take beside Otter Lake in Tulameen -- and on the old Kettle Valley Railway right-of-way. If/when I retire, I'd love to do a short bike trip on this portion of the Trans Canada Trail...from there -- and all the way to Princeton, about twenty minutes or so by car, but far longer and more circuitous via the rail bed. The last two photos were taken en route to Princeton -- and the Tulameen River and the KVR rail bed are in the foreground of the third photo. The last photo is of the same herd of cattle, except much more tightly cropped. Click to enlarge.
|
|

|
|

|
|

|
|

|
|

|
|

|
|

The WRAP
"At the root of America's economic crisis lies a moral crisis: the decline of civic virtue among America's political and economic elite. A society of markets, laws, and elections is not enough if the rich and powerful fail to behave with respect, honesty, and compassion toward the rest of society and toward the world." -- Jeffrey Sachs
Today's pop 'blast from the past' is in memory of Johnny Nash, who passed this week -- and I thank Roy Stephens for mentioning it. His music is from our youth, decades before the deep state and New World Order crowd became visible to all. He was an American singer-songwriter, best known in the United States and Canada for his 1972 hit linked here. There is a bass cover to this -- and that's linked here. Eddie Van Halen also left us this week -- and on the same day, October 6...but his music was too far "out there" for me.
Today's classical 'blast from the past' is one I've feature before, but it's been a long while -- and time for a revisit. The Introduction and Rondo Capriccioso in A minor, Op. 28, is a composition for violin and orchestra written in 1863 by Camille Saint-Saëns for Spanish virtuoso violinist Pablo de Sarasate. It's a wonderful work -- and one of the few virtuoso violin encore pieces that I've never heard live. Here's Slovene violinist Tanja Sonc...accompanied by the Slovenian Philharmonic Orchestra. Keri-Lynn Wilson conducts. The link is here. Enjoy!
It certainly was a pleasant change to have the precious metals rally strongly on a Friday -- and for that to continue right into the 5:00 p.m. close in New York yesterday, with no noticeable interventions in either gold or silver. However, the same can't be said of platinum or palladium, as it was somewhat obvious that a willing short seller was around.
But with prices rising as much as they did, it's equally clear that the Big 8 shorts were active yesterday -- and one would suspect that they're realized and unrealized losses increased by a significant amount by the market close in both silver and gold, as they were the ones most likely to have gone short against all the new long contracts being placed.
It's also unknown as to what JPMorgan was up to during the Friday trading session. As Ted mentioned on the phone yesterday, they were market neutral in both precious metals as of the close of trading on Tuesday. Whatever happened yesterday won't be known until we see next Friday's Commitment of Traders Report -- and there are still two more reporting days to go before the cut-off next Tuesday.
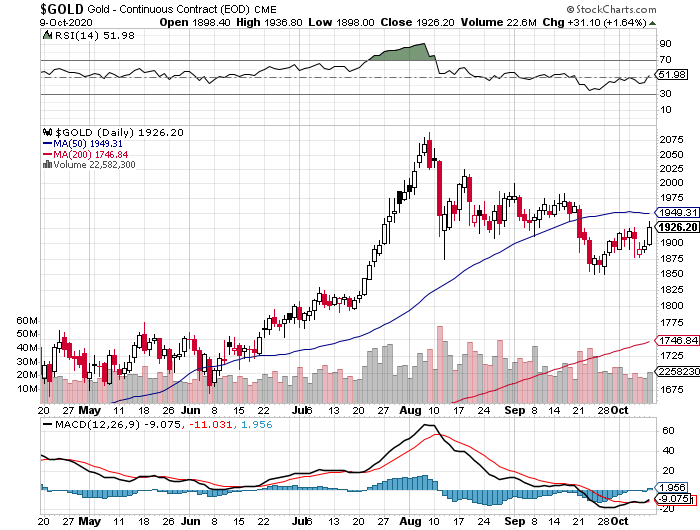
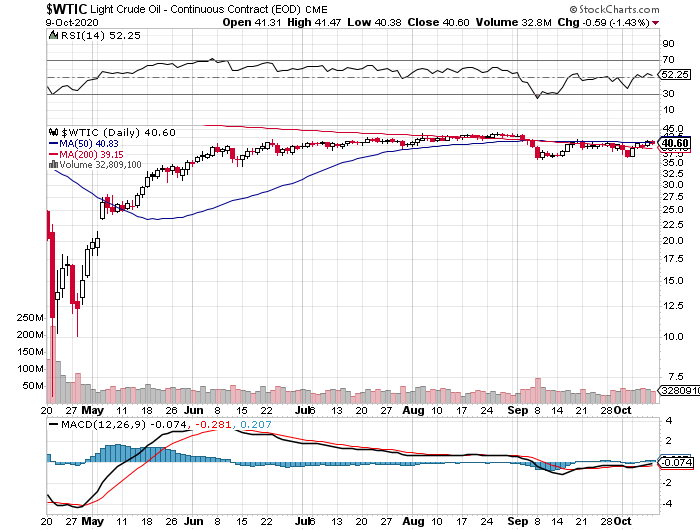
Here are the 6-month charts for the Big 6 commodities, courtesy of stockcharts.com -- and I'll point out once again that all the price activity that occurred after the COMEX close, which was a decent amount, doesn't show up on their respective dojis on the charts below. Copper closed up another 4 cents, but WTIC closed down 59 cents at $40.60 a barrel...lower by 1.43 percent.
|
|
|
|
|
|
|
|
|
|
|
|
With less than four weeks to go before the U.S. Presidential election, it's safe to say that the political political environment in the U.S.A. is "extremely toxic"...to quote Bill King in Friday's King Report.
To be perfectly honest, I doubt that this situation will improve -- and will most likely get worse...far worse between now and election day. And regardless of who "wins"...the losers will be the average U.S. citizen -- and the U.S. Republic itself in the end. It will most likely turn ugly in a real hurry -- and that's particularly true if Trump wins re-election -- and the decision is contested. The Democratic party in general -- and Biden supporters in particular won't take this lying down. There will be riots in the streets, or far worse.
The U.S. deep state and the New World Order crowd are not to be trifled with at this advanced state of the game they've been playing for the last hundred odd years. They have invested a lot of time and money sowing seeds of discontent ever since Trump was elected four years ago -- and they've more than doubled down on their bets in recent months.
It's impossible to speculate further than that -- and I'm not going to bother trying. Like you, I'm just going watch and wait for whatever comes next. However, Doug Casey wasn't shy about the future possibilities that could emerge if Biden and the Democrats win. I posted his article on this subject earlier in the week -- and here it is again headlined "Doug Casey on What Happens After The Election" -- and if you haven't yet read it, it's not too late to make amends. On a similar vein is this article from Jim Rickards that appeared earlier this week in my column as well -- and it's headlined "Get Ready for Chaos".
As I've stated in this column for many years now, it has always been my opinion that the end of the price management scheme in the precious metals would be occur under the cover of some extraordinary economic, financial or military calamity, whether at home or abroad -- and either by circumstance or design.
But not until very recently did it dawn on me that next month's election -- and the rapidly increasing toxic events and narratives that have been building up around it...could be the perfect cover for setting precious metal prices free, as there will certainly be calamitous events occurring on election night, or during the days that follow. And what disturbs me the most about all of this is that these events won't be spontaneous, but will have been planned well in advance, as the deep state will leave nothing to chance...as they did with their 9/11 stunt.
Gold took flight the night of the last U.S. Presidential election -- and it took yeoman effort for the powers-that-be to negate that rally, but they did. A replay of that may not be in the cards on election night next month.
Not only would an ugly and violent voting day -- and it aftermath, be the perfect cover to the end of the price suppression scheme, far higher gold prices and commodity prices would ignite the long-desired inflation that the central banks of the world have been desperately trying to create to date, with no success.
But as many writers have said about such a scenario, "be careful what you wish for"...because the dystopian world that would emerge from the ashes from this scenario...or any other like it, would certainly not be a pleasant world to live in, no matter how many multiples ones stock portfolio had risen.
And as Klaus Schwab, the founder and Executive Chairman of the World Economic Forum states in the quote in the Photos and Funnies section of today's column..."The pandemic represents a rare but narrow window of opportunity to reflect, reimagine, and reset our world". And if you've been paying any sort of attention over the last six months, he's one amongst many of a long list of deep state/New World Order types that has said this, or words to that effect...so don't say we haven't been warned.
And I can't shake the feeling that this absolute manic movement of gold and silver into the world's ETFs, mutual funds and depositories is in some way, shape or form connected to such an upcoming event. Coupled with that was this Ronan Manly article I posted early this past week headlined "Planned in Advance by Central Banks - A 2020 System Reset" -- and is partly what set me off on this tangent tonight.
This is all wild-ass speculation of course, but the economic, financial and monetary brick wall that has always been in Planet Earth's future at some point, is now appears to be a breathtakingly short distance away.
I'm still "all in" of course -- and, like you, hoping it will be enough.
I'm done for the day -- and the week -- and I'll see you here on Tuesday.
Ed
About the author

SUBSCRIBE: https://edsteergoldsilver.com/

Ed Steer’s Daily Analysis of the Gold and Silver Markets
After eight years of writing about the precious metals for Casey Research, the folks at Stansberry & Associates—who just recently purchased controlling interest in the company—decided that my ‘niche market’ column didn’t fit into their plans.
Since the time that Casey Research was kind enough to offer me a stand-alone column, it became their most highly-rated blog almost from the outset—and has remained that way up to this date...