Well, it depends on which time framing one is looking at.
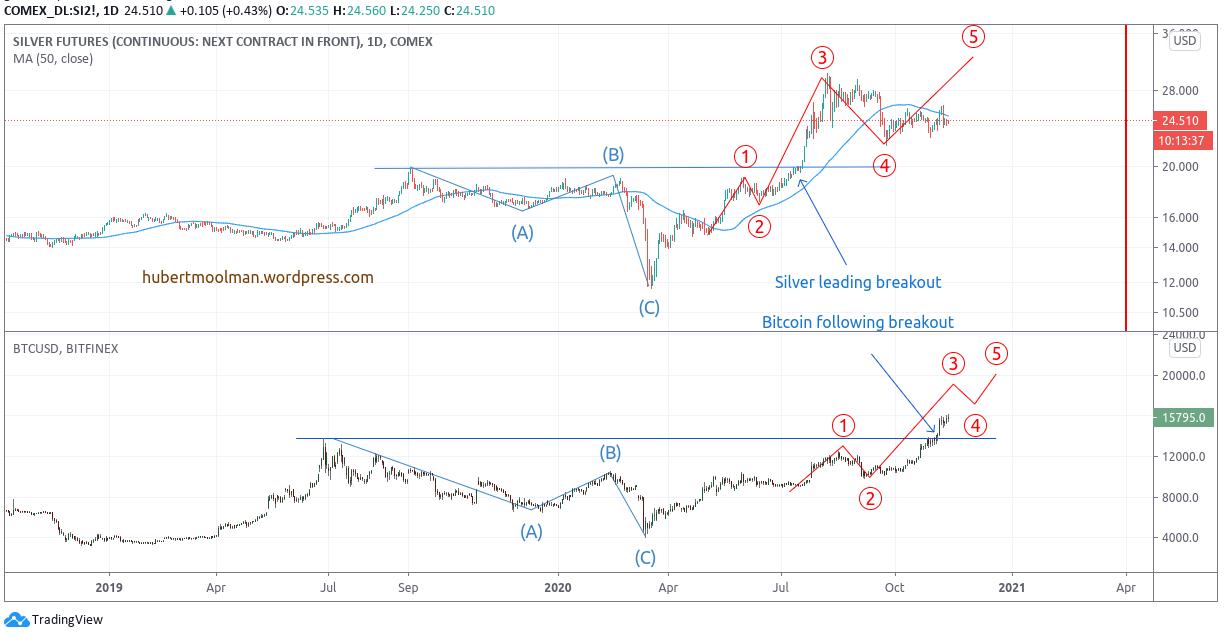
On this chart comparison below, silver appears to be leading the way higher compared to Bitcoin:

I have marked out points (A to C and 1 to 5) on both charts to show how patterns on both silver and Bitcoin could be similar. Point C represents the lows for both silver and Bitcoin in March of this year.
Both have exceeded the highs of the marked pattern, but it is the way, and timing of how they have done it that is of interest.
Silver was the first one to breakout of its high. Bitcoin followed suite about 108 calendar days later. If the comparison stays valid, then Bitcoin is currently moving towards a similar point 3 that silver already reached in August of this year.
Bitcoin is currently playing catch up, and this brings us to why Bitcoin is actually leading in the short-term time frame (to catch silver it has to lead in the short-term).
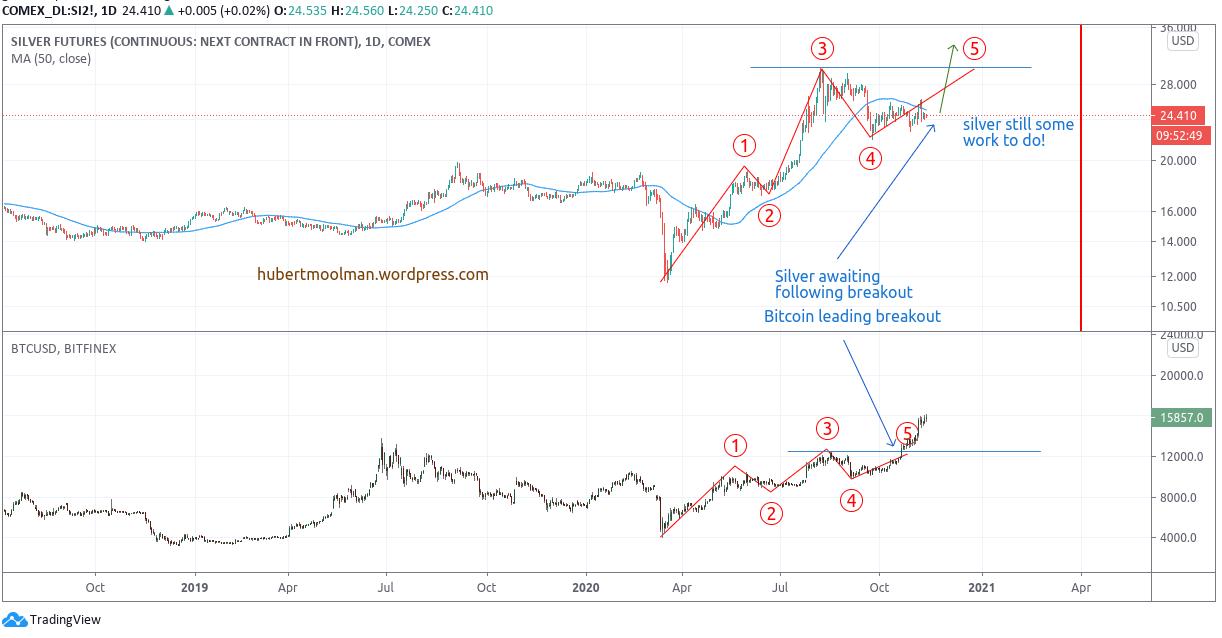
Below, is another comparison of silver and Bitcoin:

Again, I have marked similar patterns on both charts to show how they could be similar. Bitcoin has already exceeded its recent high (point 3) and is much favoured in the short-term.
Silver is still lagging below the recent high (point3), and just like Bitcoin did in the previous comparison, will eventually follow Bitcoin higher than point 3 in this comparison.
In my previous article, I have shown how a certain signal has already prepared the way for higher silver prices. The market is trying its best to shake some weak hands before it goes much higher.
In summary, it is fair to say that based on the above comparisons and the fact that silver and Bitcoin are considered alternatives for a failing dollar, Bitcoin’s recent breakout should give silver bulls hope that silver will soon rise much higher.
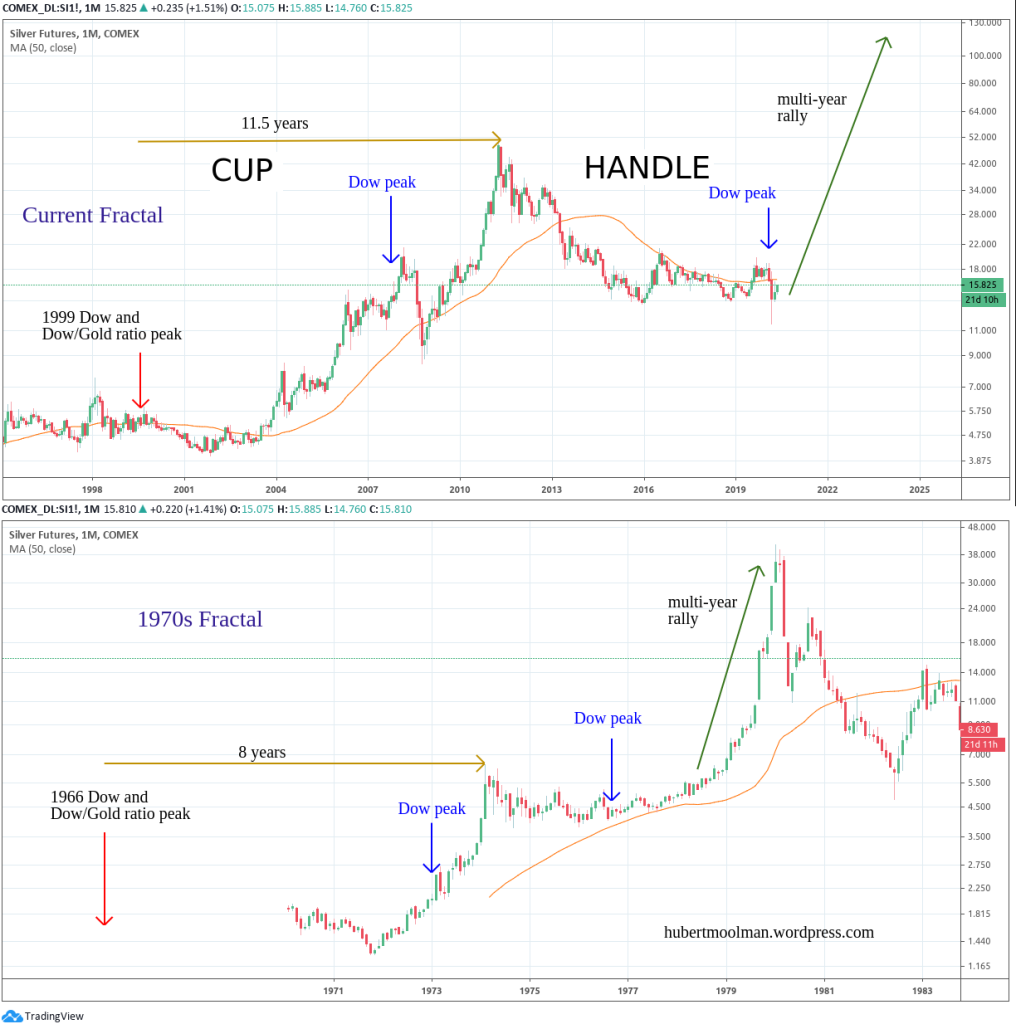
Remember the larger cycle:

For more on this, and this kind of fractal analysis, you are welcome to subscribe to my premium service. I have also recently completed a Silver Fractal Analysis Report as well as a Gold Fractal Analysis Report

