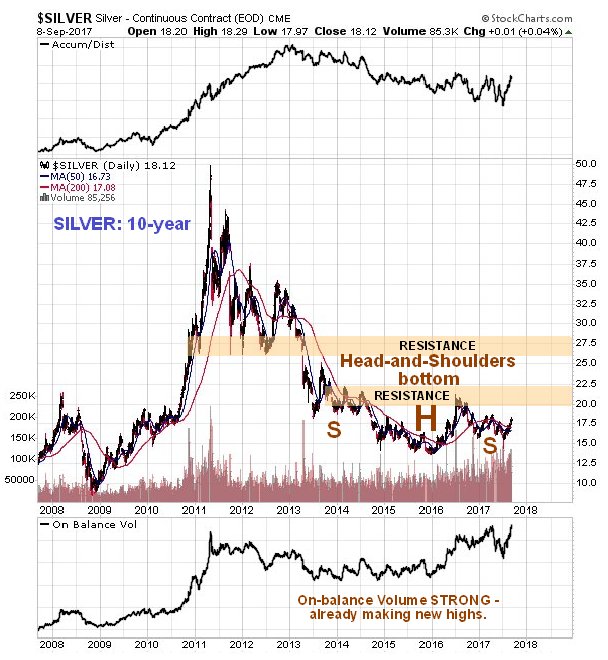
On its long-term 10-year chart silver superficially looks like it may still be in a bearmarket, but on more careful inspection we can see that a large Head-and-Shoulders bottom pattern is completing, which is tilted compared to the similar pattern that is completing in gold, because silver tends to underperform gold at the end of bearmarkets and the beginning of bullmarkets. As we can see, unlike gold, it is still some way from breaking out of this base pattern, but should do so not long after the dollar breaks down from its Broadening Top, that we look at in the parallel Gold Market update. Volume indicators are most auspicious, with the On-balance Volume line in particular looking very bullish indeed, since it is already at new highs, which is remarkable given that the silver price is still a long, long way from its 2011 highs. Since silver is in the late stages of forming the Right Shoulder of its H&S bottom it is at a good point to accumulate, although given that there is considered to be a high chance of a near-term relief rally in the dollar before it finally collapses, we may see an even better price in coming days and weeks, although this is likely to be the last chance to buy silver anywhere near to its bottom for this cycle.

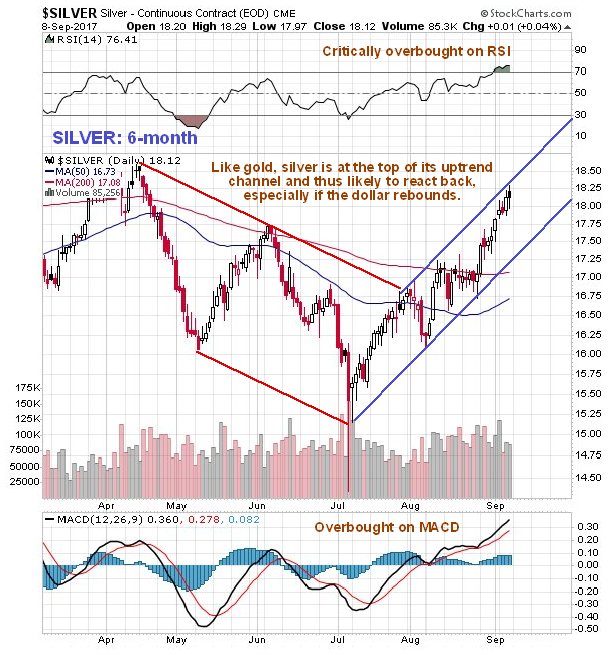
On silver’s 6-month chart we can see that it is at a good point to react back on a near-term dollar bounce, because it has arrived at the top of the channel shown in an overbought state, and any such reaction will be regarded as throwing up a buying opportunity, especially if it should break down from the channel and drop back towards its July lows, although it is considered unlikely that it will drop back this far.

Copper reacted sharply on Friday, and as it has been leading the metals in the recent past, this is viewed as an additional sign that a dollar bounce is pending and a near-term reaction in gold and silver. The latest copper chart may be viewed in the new Gold Market update.

