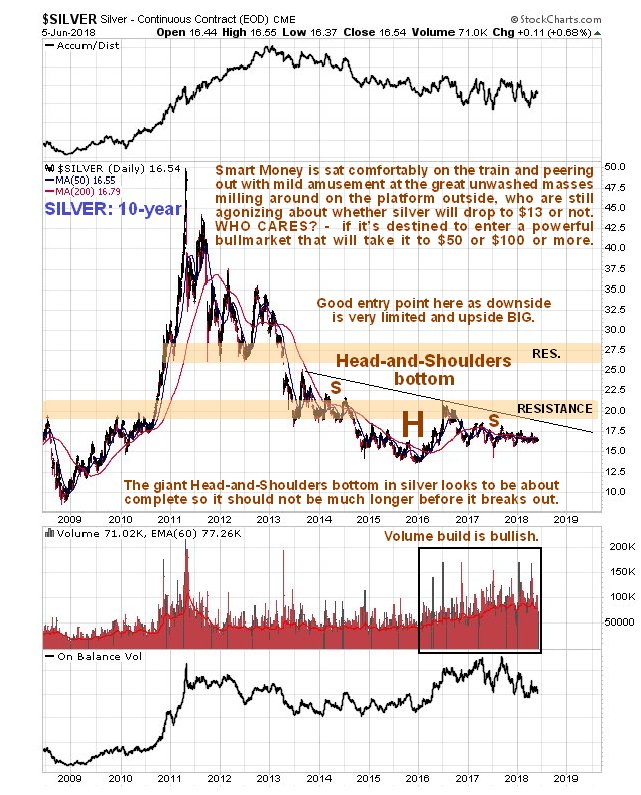
The silver market has become so quiet that you can hear a pin drop, a most unusual situation in this normally rather volatile metal. What this means is that there is a big move brewing and probably sooner rather than later.
For 5 years now, since 2013, silver has been marking out a giant Head-and-Shoulders bottom, like gold, except that in silver’s case it is downsloping because silver underperforms gold towards the end of PM sector bearmarkets, which is normal. This base pattern is mature, as we can see on silver’s latest 10-year chart below, and with the Right Shoulder close to complete, the time for silver to advance out of this base pattern is at hand, and thus it is viewed as no coincidence that the dollar, which we look at in the parallel Gold Market update, is rolling over and looking set to drop.
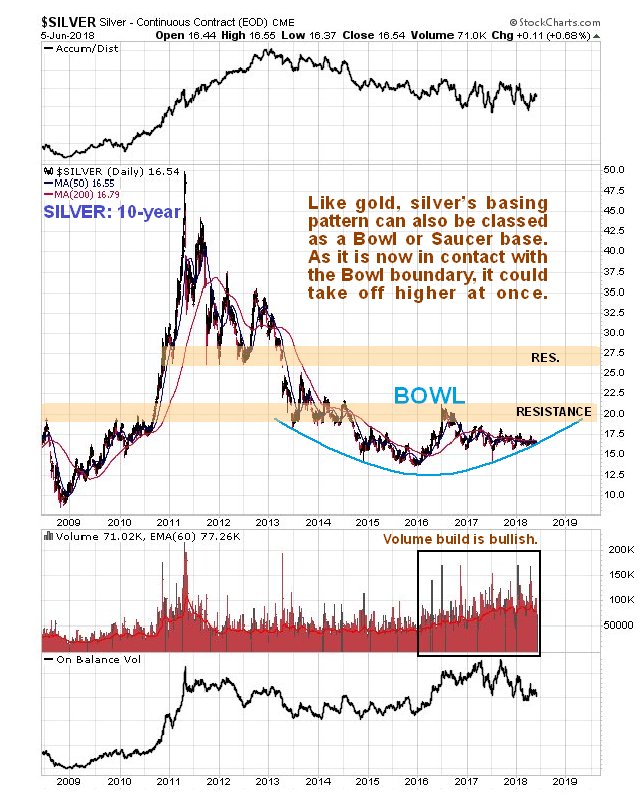
As with gold, silver’s base pattern can also be described as taking the form of a Bowl or Saucer, which we can see on the additional 10-year chart shown below, a 2nd chart being used to avoid clutter. This is certainly worth knowing for as we can see, the price is making contact with the Saucer boundary right now, which means it ought to start higher again almost at once. An important point to observe is the volume buildup on the right side of the pattern, because, for it to be a valid Saucer, volume should expand as the price starts to ascend as the Saucer boundary climbs beneath it. Volume has grown as the price has moved sideways for almost 2 years now, and should increase further as the price rises.
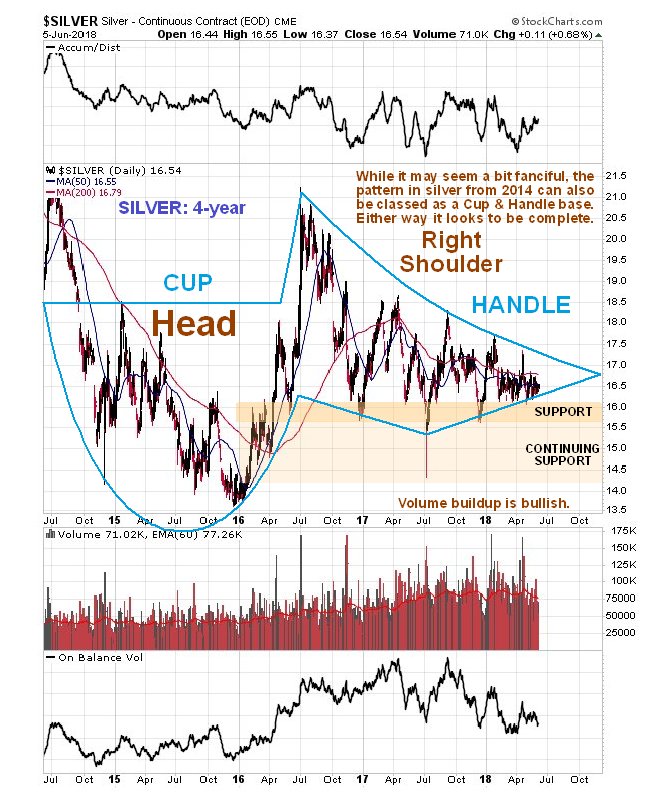
A 4-year chart enables us to spot something else of interest. First off we can see the Head and Right Shoulder of the Head-and-Shoulders bottom that we already viewed in its entirety on our 1st 10-year chart, and the giant Bowl or Saucer pattern is not shown due to practical difficulties and to avoid clutter, yet within this pattern we can also see an embedded Cup & Handle base that started to form with the drop in the Summer of 2015. Like the larger pattern this Cup & Handle formation appears to be complete, with the price squeezing into the apex of the now triangular Handle of it. Thus a breakout and determined advance looks imminent, and we know to expect it because on the 10-year chart we have observed that the price is now making contact with the giant Saucer boundary.
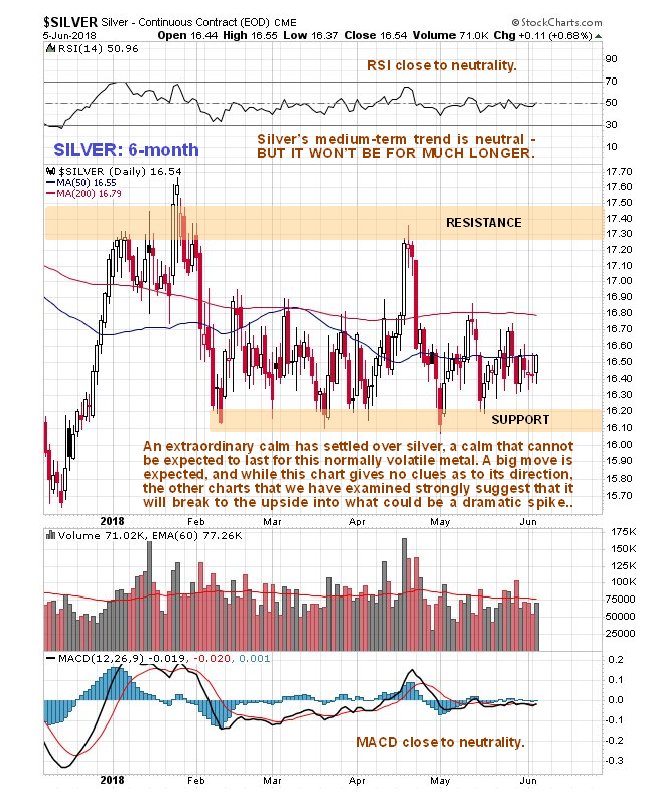
Silver’s 6-month chart shows us recent action in detail, but otherwise is of limited use technically. It reveals that the medium-term trend has been and is neutral, a situation that is not expected to continue for much longer, and it also emphasizes that it has been trading in an extraordinarily narrow range since early February above the support level shown, which it is now close to. Given what we have observed above we are clearly at a good entry point here for all things silver…
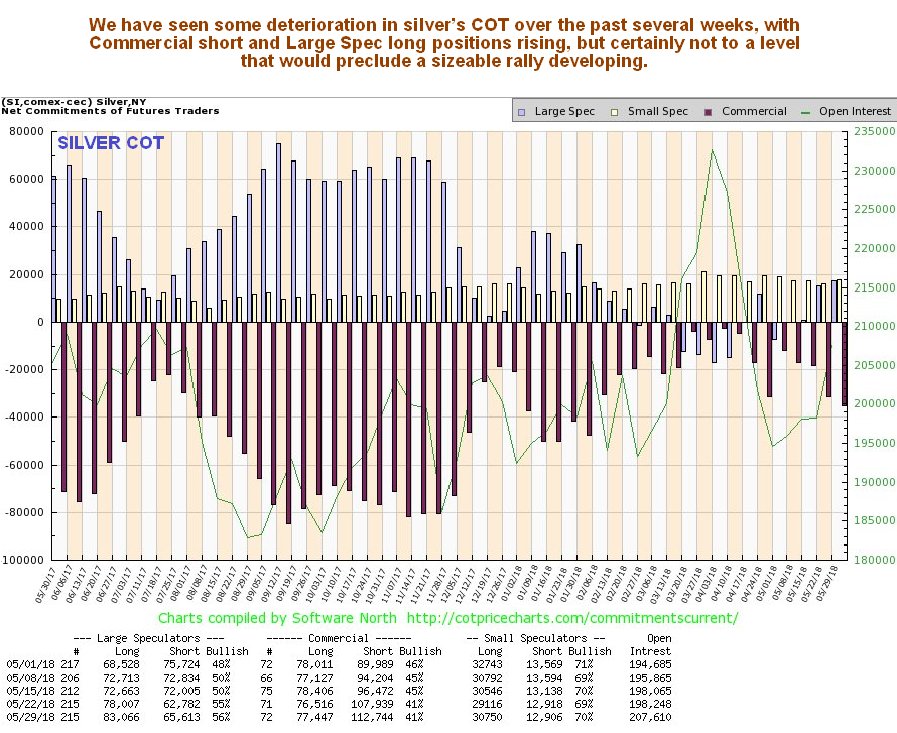
Silver’s latest COT shows some deterioration in the COT structure over the past several weeks, with Commercial short and Large Spec long positions rising – but certainly not to levels that would preclude a significant rally developing…
Click on chart to popup a larger, clearer version.
Finally, we have the news from the bullion broker Sharps Pixley in London that as of this coming Friday 8th June, they will be drastically reducing their coverage of silver, because it is no longer commercially viable, as they say “A combination of a diminishing pool of “quality” silver stories, coupled with an inability to attract site sponsors from the silver sector to defray costs has meant that we have been working ever harder for no commercial gain.” If this isn’t a contrarian buy signal, then I don’t know what is.
About the author