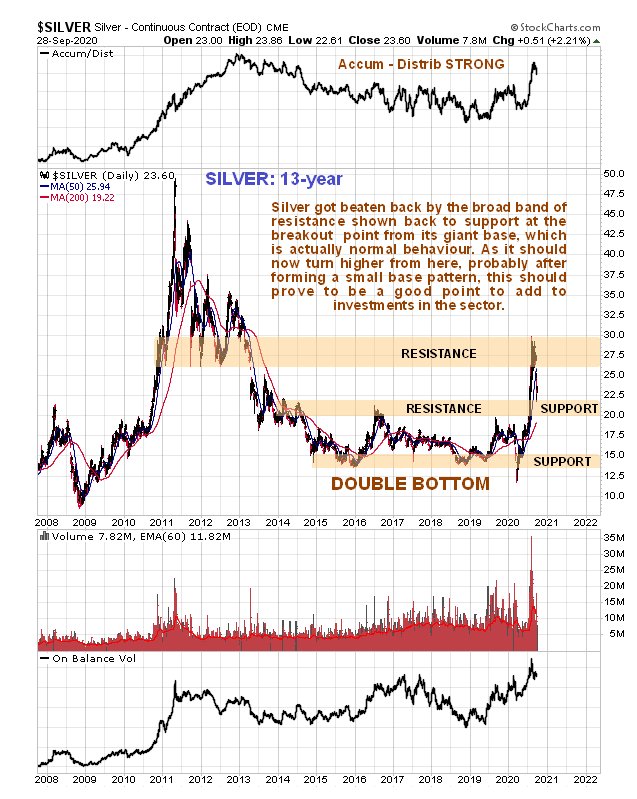
More than a few traders are confused about what is going on with silver here after its recent reaction, but when we look at its long-term chart the situation quickly becomes clear. So we will start this update by looking at silver’s 13-year chart in order to get big picture” perspective.
On the latest 13-year chart we see that only broke out of its giant 7-year long base pattern as recently as July. The high-volume surge that occurred upon its breaking out was a sign that it was genuine. What has happened in recent weeks is that it has reacted back to test support at the upper boundary of the base pattern, which is normal. In the last update we were too optimistic in thinking it would continue higher, but the good news is not just that the post-breakout reaction is perfectly normal, but that this reaction back to support is a healthy development that is “recharging the batteries” for the next upleg.

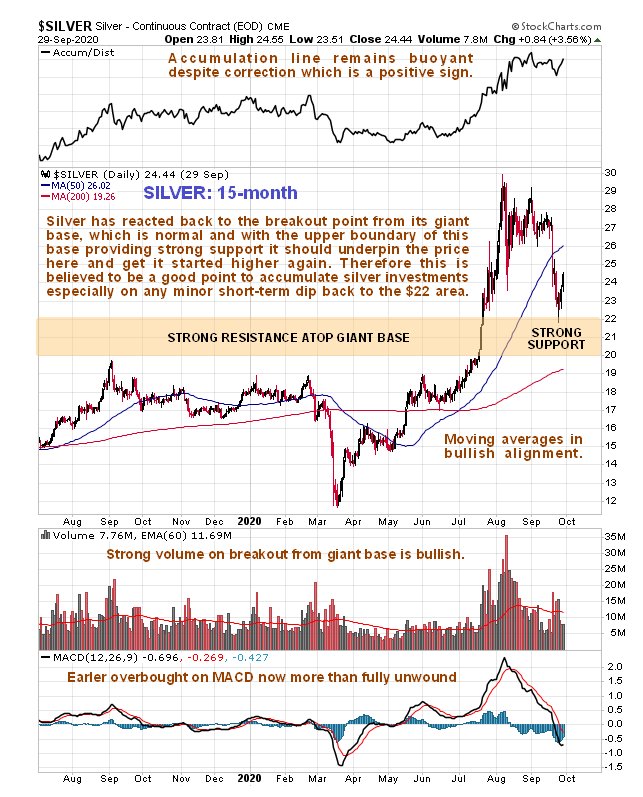
On the 15-month chart we see in more detail a picture that looks entirely bullish with the normal post breakout reaction of recent weeks back to strong support serving to unwind the earlier overbought condition resulting from the breakout as shown by the MACD indicator so that silver is now somewhat oversold. Bullish factors that should contribute to a new upleg developing in due course include a positive volume pattern, with the Accumulation line holding up very well indeed as silver has reacted back and the bullishly aligned moving averages. We can therefore reasonably conclude that we are at an excellent point to increase holdings in all manner of silver investments ahead of the next (2nd) upwave unfolding.

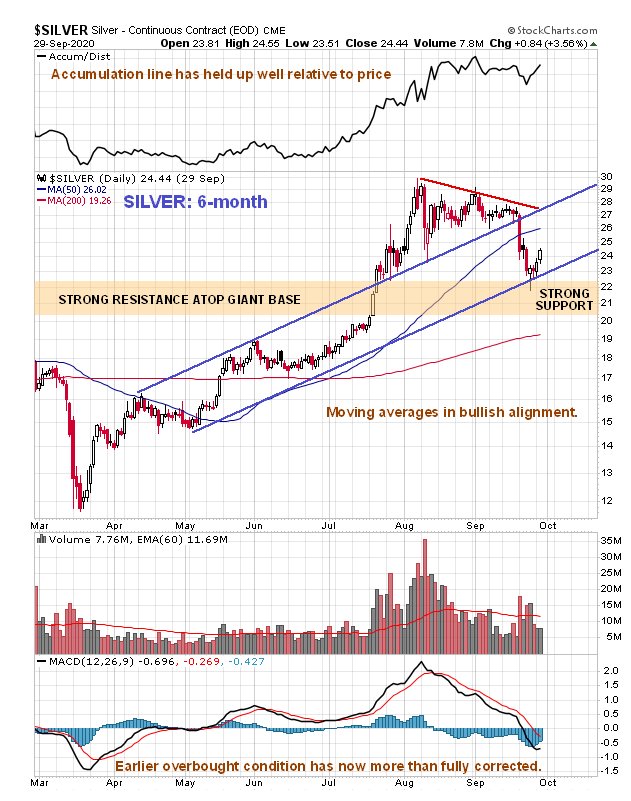
The 6-month chart shows a parallel uptrend channel that seems to be still operative. When silver broke out of its giant base in July it bust out the top of this channel, so that it no longer looked valid, but rather curiously when it broke down from the Triangle perched above the upper boundary of this channel over a week ago it dropped sharply, but the decline halted at the lower boundary of the channel with a bull hammer, which is a strong sign that it has hit bottom. The backing and filling that we are now seeing thus looks like an intermediate base that will be followed by a new 2wnd upleg that will take silver to new highs.

The conclusion is that we are now being presented with an opportunity to build positions in silver investments ahead of the next upleg that is likely to be substantial.
Finally the latest silver COT chart shows that readings are still moderate and certainly at levels that permit another sizeable rally.
End of update.

