Over the last 125 years, the silver chart has formed two remarkable, similar patterns. The chart below shows a yearly silver chart (only closing values):
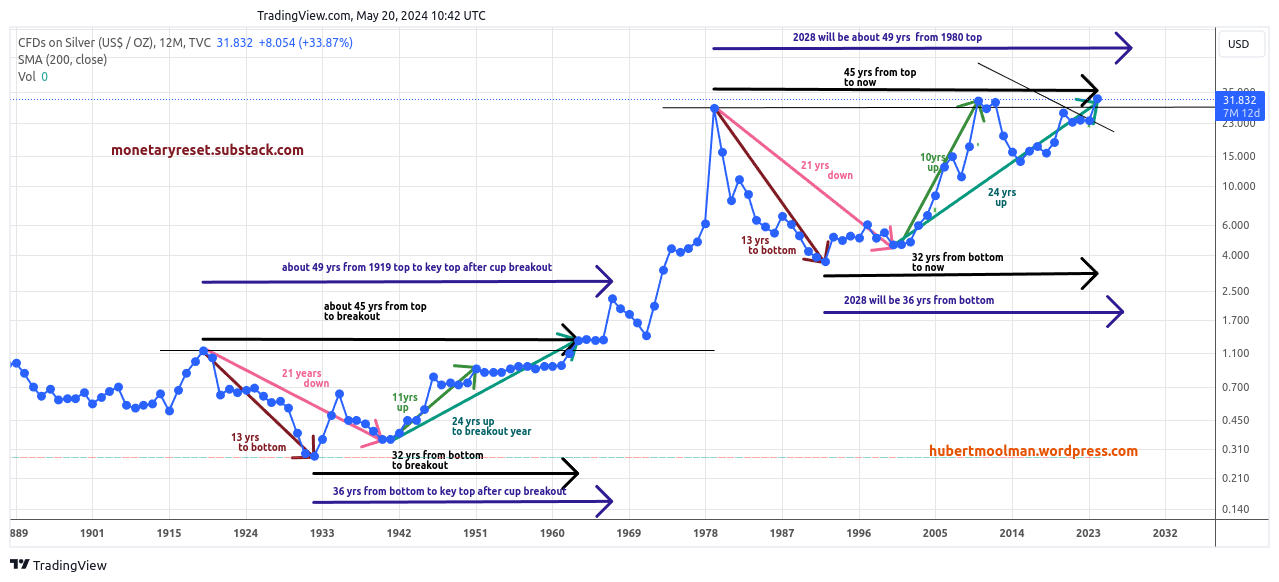
It is amazing how the 49-year pattern from 1919 to 1968 has a similar form to the one that started circa 1980. Here, I have pointed out their similarity as it relates to time. There may be rounding differences due to the yearly closing balances.
The first cup started at the 1919 peak, and it took about 13 years to get to the bottom (1932), whereas it took about 21 years to get to the secondary bottom in 1940. In a similar manner, the second cup started at the 1980 peak, and it also took about 13 years to get to the 1992 bottom and about 21 years to get to the secondary bottom in 2000.
It took about 24 years from the secondary bottom in 1940 to the break out of the cup in 1963. About 24 years have passed since the secondary bottom in 2000. So, this year is likely the breakout year, provided the pattern stays true to the original one.
Furthermore, provided that the current pattern stays true to the original one, silver could make a possible top around 2028.
It is interesting to note that from the peak in 1919 to the interim peak in 1967, it is about 49 years, which is the number of years before a jubilee occurs. Is this just a coincidence, or could 2028/2029 be a year of jubilee?
If somehow this is the case, then it is likely that we might see a slew of sovereign debt defaults by that time (or a little after), including that of the US. Even if this is just a coincidence, there is a strong indication that we are now in a period where significant debt defaults may occur.
Warm regards
Hubert Moolman