Silver is still near all-time lows in many ways. One of the most significant measures wherein silver is at an all-time low, is its price relative to the amount of US dollars (US monetary base) in existence.
Below, is a long-term chart of the silver price relative to the US monetary base:
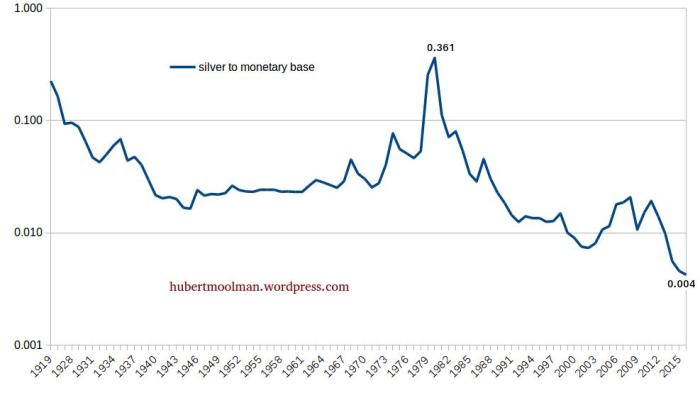
As you can see it is at all-time lows (0.004), but actually even lower, since this chart was done before the massive amounts of US dollars that were created this year. It is currently at 0.0035.
There are way more US dollars in existence today than at any point in history, but yet the silver price is not reflecting that reality.
Another measure wherein silver is at an all-time low is of course debt, and this I explained here.
The point is that silver is still really cheap. It can only be expensive if it comes into its own as a monetary asset. No industrial demand or other demand as a commodity (especially given the outlook of the world economy) will cause silver to be expensive or in a bubble.
Only when debt-levels are at significant lows, can silver be near highs.
Only when the Dow has had a real crash could silver perhaps be overvalued at some point after.
Only when silver is considered an actual monetary asset (like the US dollar or gold), and actually part of monetary reserves world-wide could it possibly be considered fairly valued.
Currently, it is really one of the easiest decisions to make silver part of one’s investment portfolio.
Below, is a long term chart of silver:
Click on chart to ENLARGE
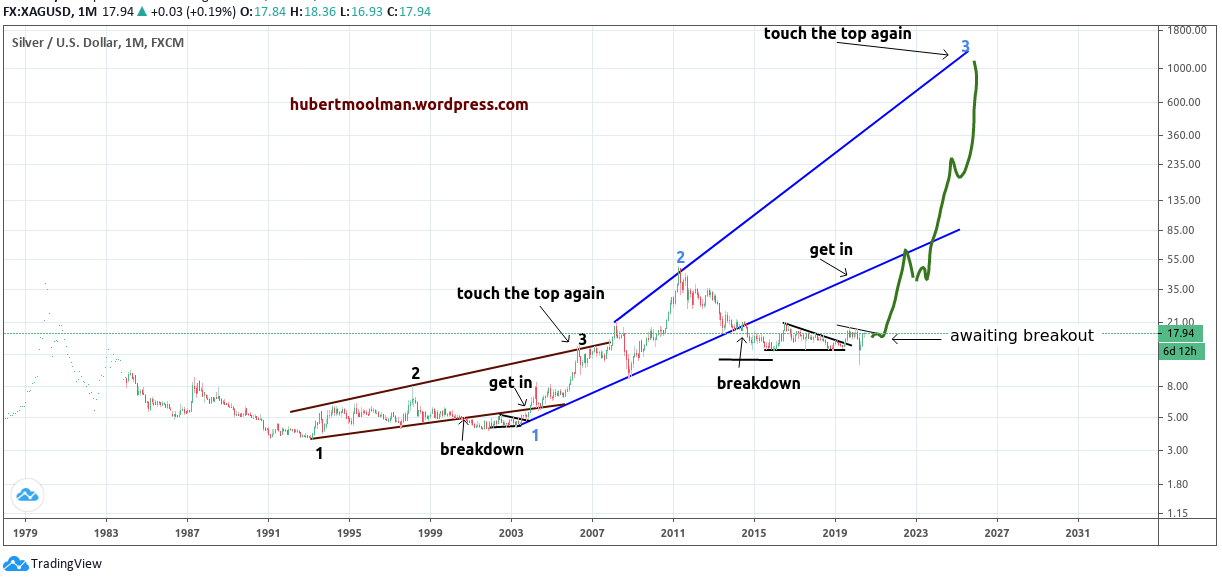
This is another illustration of how the silver price is currently relatively low.
On the chart, the first phase of the silver bull market was from 1993 to the end of 2001, and the second phase is from 2001 to the 2020 and beyond.
It appears that there is a similarity between the two phases. I have drawn some lines, and marked some patterns to show how they could be similar.
The first phase is marked 1 to 3, in black, and the second 1 to 3, in blue. Both of the phases appear to occur within in a broadening channel, from which they both broke down, after point 2.
As long as silver is below the blue broadening channel it is extremely cheap. Just like it was from about September 2000 to November 2003 when it was below the black broadening channel.
So, if you missed out on buying silver in 1999 to 2003, then now is your chance.
After breaking down from the channel there was a consolidation that ended at a new point 1. The first phase managed to get back inside the broadening channel again. If the current pattern follows and do the same (by getting inside the channel), then we will see some high silver prices, but still not expensive.
Only near the top of the broadening channel would I consider silver to be relatively expensive.
For more of these charts and this kind of fractal analysis, you are welcome to subscribe to my premium service. I have also recently completed a Silver Fractal Analysis as well as a Gold Mining Fractal Analysis Report.