Excerpt from this week's: Technical Scoop: Market Odds, Golden Value, Energy Divergence
Gold and Precious Metals (Energy too)
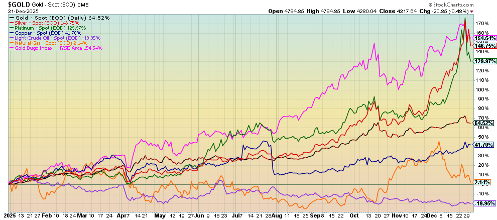
Gold plus other Selected Commodities Price Performance 2025
Source: www.stockcharts.com
2025 was a golden year. Or, more specifically, it was a silver year. Gold rose an impressive 64.5% in 2025. But silver was up 146.8%. Platinum was no slouch, up 130.0%. For the precious metals it was the best year since 1979. And, less we forget, the precious metals stocks benefited with the Gold Bugs Index (HUI) up 154.6% and the TSX Gold Index (TGD) up 142.8%. Apparently, the big winner was Orvana Minerals (ORV/TSX), up 758% in 2025. Can they do it again in 2026? Certainly, the conditions remain that propelled the precious metals to a record year. Global geopolitical tensions, domestic political tensions, the rise of right-wing populist parties and the decline in democracy, uncertain economics, and growing debt are everywhere. Gold is the safe-haven. Increasing safe-haven demand is a sign of stress in the global economy and financial system.
The real story of 2025 is silver. Some are saying that precious metal stocks, particularly silver, are acting like meme stocks. Silver as GameStop (GME)? Hardly. Silver is a metal in high demand for solar panels, EVs, electronics, medical tech, AI, and more. The trouble is that physical silver is in short supply. Now China has placed export controls on silver, tightening supply chains even further. China is the world’s second largest silver producer, behind Mexico. But China only produces a bit over half of what Mexico produces. Peru is just behind China.
While physical silver is in short supply, paper silver (i.e., silver futures and other derivatives) is a humongous market. There are 356 ounces of paper silver to one ounce of physical silver. There are those who are short silver futures, thus providing a potential source of buying to cover offside shorts. Then along came the Chicago
Mercantile Exchange (CME) and, amidst concern over the growing frothiness in the precious metals markets, they raised margin requirements. That helped cause the huge hiccup decline on December 29. An outside day reversal from record highs. Silver fell nearly 9% that day. Forced liquidation. Rumours that a financial institution (unknown at this time) was going under as the result of failure to meet the margin call.
But that’s the paper market. Over in the physical market there are growing shortages. They are paying upwards of $80/ounce in Shanghai, a significant premium, to New York. Companies are seeking deals with silver producers at $80/ounce. Silver is trading at $80/ounce at SilverGoldBull (www.silvergoldbull.com, www.silvergoldbull.ca). Spot silver is above futures silver. That’s called backwardation. Silver is trading at $130/ounce in Japan, $106 in Kuwait, and $97 in Korea, reflecting this divergence in the paper market vs. the physical market. These levels are based somewhat on hearsay. But is a bank about to implode? Banks face a possible liquidity risk on silver, but is bankruptcy imminent? Not necessarily. Futures traders are demanding physical silver as settlement rather than cash or rolling contracts, adding to the supply woes. An excellent article in much more detail and depth than we can provide is found on the CCN site (https://www.ccn.com/education/crypto/silver-130-vs-71-physical-repricing-banks-collapse-bitcoin-crash/).
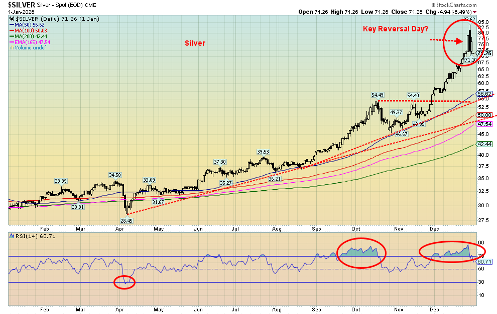
Source: www.stockcharts.com
If there was an outside day reversal in silver (note: gold did not do the same thing), then we could have a bit more correction time ahead of us. Maybe this shouldn’t be a surprise. The 2011 high near $50 (inflation-adjusted) is $72 today. A huge cup and handle formation, formed from 1980 to 2022 suggested $71 as the initial target.
That we have exceeded that level but are currently correcting near it suggests to us that once this correction is over, we should move to the next target near $100. The inflation-adjusted high of 1980, also near $50, is $197 today. Could we do it? Many believe we can.
Gold/Silver Ratio 2000–2025
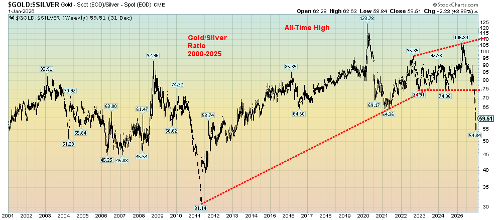
Source: www.stockcharts.com
The system is broken. The rush into physical silver and gold reflects a growing malaise. Distrust is everywhere: in the economy (trade wars, rising unemployment, sticky inflation, sliding GDP), in the political realm (geopolitical and domestic), and in paper assets (bonds, stocks, derivatives). The result is a move out of paper assets and fiat currencies into physical assets: i.e., gold and silver. The debt is not a cyclical problem – it’s structural. Examples of debt blow-ups litter history. Banking crises, debt crises, and political crises resulting in revolution, civil war, or global war are not accidents. They happen with regularity. The Great Depression, followed by World War II but preceded by the Roaring Twenties – a period of excess, inequality, and transformational technological advances – was not an accident. This time is not different. It will happen again. Are we on the cusp of something similar?
The gold/silver ratio has broken down sharply in favour of silver. Last at 54.84, the 2011 low near 31 is within sight. The pattern suggests a fall to at least 42.
The bull market for both gold and silver is not over – it’s just on pause. Last week’s hiccup was not fundamental. It was manipulated. We could be sitting on the cusp of a further breakdown for gold. Nonetheless, only a breakdown under $3,900 would be of major concern.
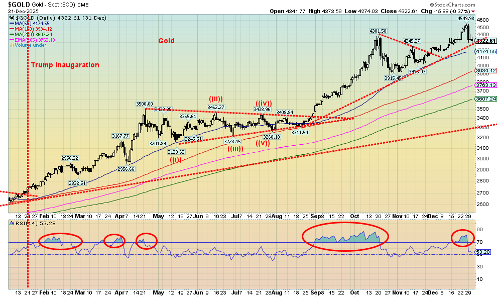
Source: www.stockcharts.com
Read the FULL report here: Technical Scoop: Market Odds, Golden Value, Energy Divergence
Disclaimer
David Chapman is not a registered advisory service and is not an exempt market dealer (EMD) nor a licensed financial advisor. He does not and cannot give individualised market advice. David Chapman has worked in the financial industry for over 40 years including large financial corporations, banks, and investment dealers. The information in this newsletter is intended only for informational and educational purposes. It should not be construed as an offer, a solicitation of an offer or sale of any security. Every effort is made to provide accurate and complete information. However, we cannot guarantee that there will be no errors. We make no claims, promises or guarantees about the accuracy, completeness, or adequacy of the contents of this commentary and expressly disclaim liability for errors and omissions in the contents of this commentary. David Chapman will always use his best efforts to ensure the accuracy and timeliness of all information. The reader assumes all risk when trading in securities and David Chapman advises consulting a licensed professional financial advisor or portfolio manager such as Enriched Investing Incorporated before proceeding with any trade or idea presented in this newsletter. David Chapman may own shares in companies mentioned in this newsletter. Before making an investment, prospective investors should review each security’s offering documents which summarize the objectives, fees, expenses and associated risks. David Chapman shares his ideas and opinions for informational and educational purposes only and expects the reader to perform due diligence before considering a position in any security. That includes consulting with your own licensed professional financial advisor such as Enriched Investing Incorporated. Performance is not guaranteed, values change frequently, and past performance may not be repeated.
About the author


Website: https://www.enrichedinvesting.com
Disclaimer: David Chapman is not a registered advisory service and is not an exempt market dealer (EMD) nor a licensed financial advisor. We do not and cannot give individualised market advice. David Chapman has worked in the financial industry for over 40 years including large financial corporations, banks, and investment dealers. The information in this newsletter is intended only for informational and educational purposes. It should not be considered a solicitation of an offer or sale of any security. The reader assumes all risk when trading in securities and David Chapman advises consulting a licensed professional financial advisor before proceeding with any trade or idea presented in this newsletter. David Chapman may own shares in companies mentioned in this newsletter. We share our ideas and opinions for informational and educational purposes only and expect the reader to perform due diligence before considering a position in any security. That includes consulting with your own licensed professional financial advisor.