Excerpt from this week's: Technical Scoop: Cut Fallout, Overdue Wobble, Pullback Opportunity
this past week.
Source: www.stockcharts.com
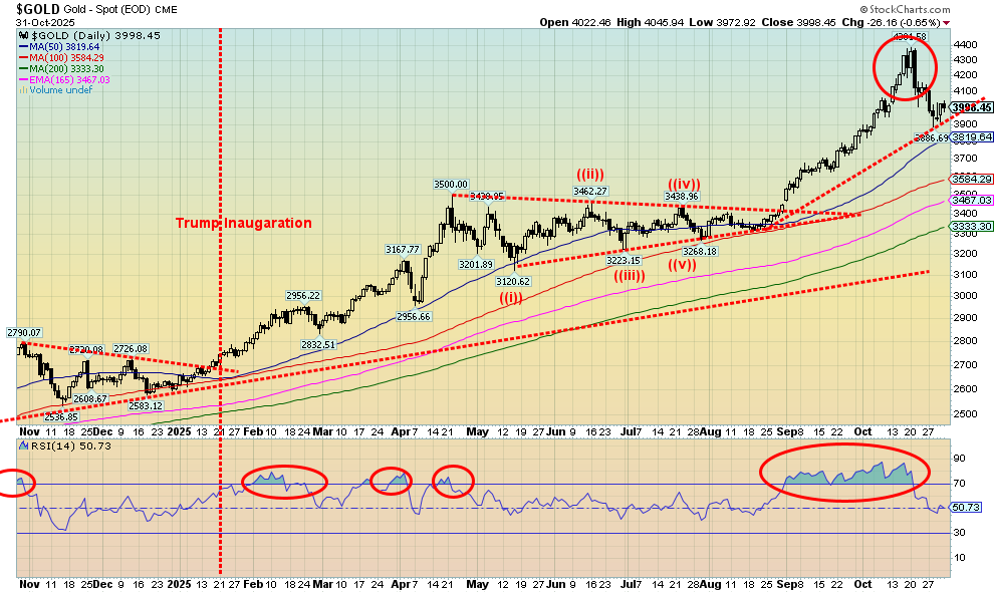
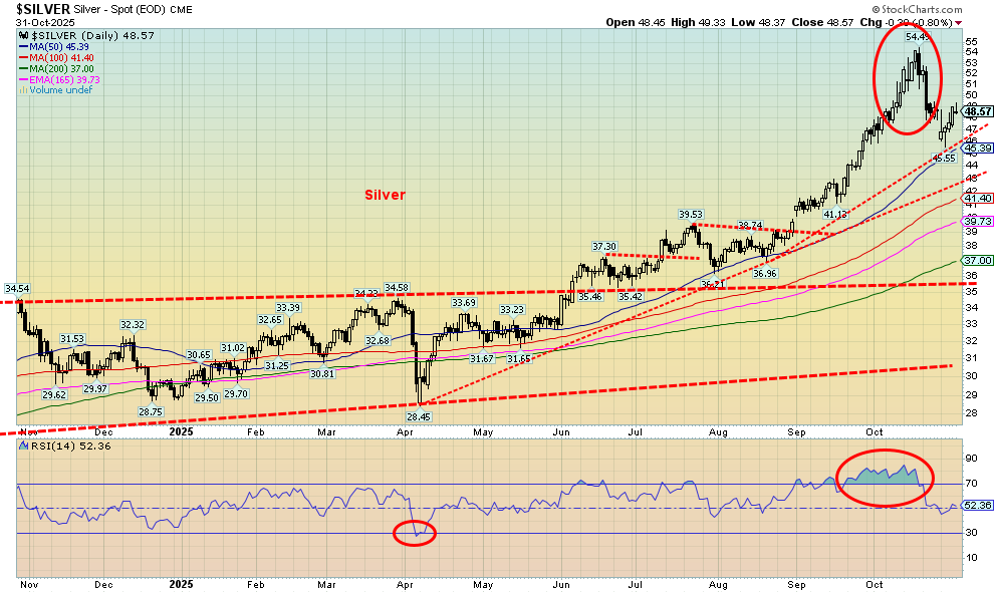
Gold fell again this past week, mostly because of a strengthening US$ Index and some unloading of leveraged positions in gold. The leveraged players want to play when the market goes up but, being leveraged, they are subject to margin calls if the market falls. Still, gold’s performance in October saw it close higher for the third consecutive month. It’s gained almost 21% during that time or $689. Now it has fallen for two consecutive weeks, an overdue correction. And it remains up 51.4% on the year. Silver is even better, up 66.1% on the year.
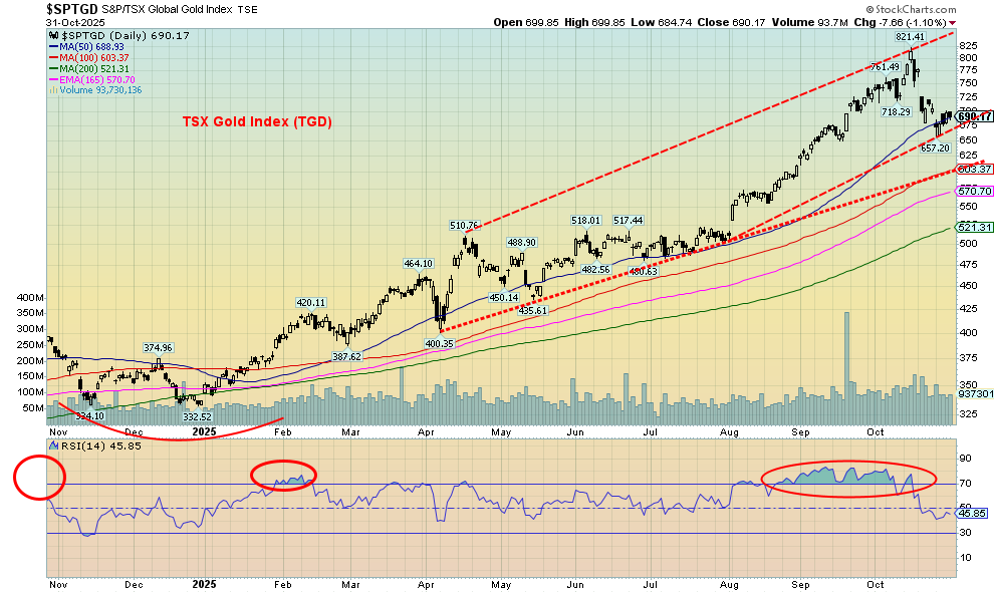
On the week, gold fell 2.7% while silver outperformed, ending the week flat. Platinum fell 1.1% but is still up 71.7% on the year. Of the near precious metals, palladium was up 0.6% while copper was up a tiny 0.2%. Palladium is up 59.4% on the year while copper is up 26.3%. The gold stock indices fell as the Gold Bugs Index (HUI) lost 1.5% and the TSX Gold Index (TGD) fell almost 2.0%. Both remain up over 100% on the year.
Technically, we appear to have found some support near $3,900 while the 50-day MA is just below at $3,820. A break under $3,800 could suggest further declines to $3,600. The decline over the past two weeks is being described as a liquidity event, not a fundamental event. The rise had been steep and many participants were highly leveraged. A drop like this sends the leveraged players to the sidelines, possibly with margin calls. We’ve mused as to whether this decline is a liquidity event in that the gold market smells a rat and is getting liquid, even as the prediction remains firm that we could eventually see higher prices ahead.
Higher prices remain as central bank gold-buying is not about to stop. They are purchasing upwards of 1,000 tonnes annually. The BRICS nations are still trying to get out from under U.S. dollar hegemony but building their gold reserves and lessening their holdings of U.S. treasuries. The U.S. has $38 trillion of debt, which is rising at least $2 trillion per year. It’s unsustainable. Gold is a hedge against monetary destruction.
We need to regain above $4,275 to suggest new highs. Only new highs will end this correction. We had expected some weakness into November/December and we appear to be on schedule. After that, another sharp rise could occur into 2026 before a possible top in March/April. The reasons for holding gold have not gone away. Political and economic uncertainty and unsustainable debt are the two prime reasons. The Russia/Ukraine war and the war in the Middle East (Israel/Hamas) are not getting resolved, despite the so-called cease fire in the Middle East. Domestic political clashes are erupting in the U.S. and more marches are planned against the presidency of Donald Trump. And, need we repeat it, the U.S. debt is unsustainable.
Despite a little bounce back, we suspect this correction is not over yet. A decline to $3,600/$3,700 would not be a surprise.
Source: www.stockcharts.com
The one positive thing about this past week was that silver outperformed gold. Silver was flat while gold fell 2.7%. That suggests to us that the recent decline for gold, silver, and the gold stocks is probably only a correction and not the start of new major decline. Silver found support near the 50-day MA before rebounding slightly. We still have a way to go to suggest new highs. We have to break above $52.40 to suggest that. A drop under $45 suggests we will see the next support near $43. We’d prefer not to see a break of $43 as that would suggest a steeper decline. The 200-day MA is down at $37, a level we do not expect to see. Like gold, silver was experiencing some profit-taking and responding to the stronger US$ Index. Nonetheless, we are encouraged with silver’s outperformance this past week. The gold/silver ratio is still extremely high at 82.15. We’re even above the recent low at 76.77. As we’ve noted many times, we have never seen such a period where gold relative to silver has remained so high. A decline is underway but we need to get under 70 to really suggest a decline in favour of silver.
Source: www.stockcharts.com
It should come as no surprise that, when you are up 100%+, profit-taking might kick in. It has happened with gold, silver, and especially the gold stocks – after a big 68% move from lows in June to the recent high, some might think of profit-taking. The gold stocks are up over 100% in 2025 and many individual stocks even more. So, the recent 20% correction for the TSX Gold Index (TGD) should not be a surprise. Even at that, the TGD remains up 104.9% in 2025 while the Gold Bugs Index (HUI) is still up 110.8%.
On the week, the TGD fell 2.0% while the HUI was off 1.5%. That’s certainly less than the previous week when both fell some 7%+. So far, the 50-day MA appears to be holding the decline. But a drop through 650 could suggest a further decline 600. We can’t help but notice that volume has died down, indicating that this move is most likely just a correction and not the start of a deeper bear move. But be warned that this correction doesn’t appear to be over. There is resistance up to 725, then 750. We have to get over 780 to suggest new highs ahead. Could a correction to the 200-day MA (520) take place? Yes, but we can’t determine if we’ll fall that low until we break under 600.
Read the FULL report here: Technical Scoop: Cut Fallout, Overdue Wobble, Pullback Opportunity
Copyright David Chapman 2025
Disclaimer
David Chapman is not a registered advisory service and is not an exempt market dealer (EMD) nor a licensed financial advisor. He does not and cannot give individualised market advice. David Chapman has worked in the financial industry for over 40 years including large financial corporations, banks, and investment dealers. The information in this newsletter is intended only for informational and educational purposes. It should not be construed as an offer, a solicitation of an offer or sale of any security. Every effort is made to provide accurate and complete information. However, we cannot guarantee that there will be no errors. We make no claims, promises or guarantees about the accuracy, completeness, or adequacy of the contents of this commentary and expressly disclaim liability for errors and omissions in the contents of this commentary. David Chapman will always use his best efforts to ensure the accuracy and timeliness of all information. The reader assumes all risk when trading in securities and David Chapman advises consulting a licensed professional financial advisor or portfolio manager such as Enriched Investing Incorporated before proceeding with any trade or idea presented in this newsletter. David Chapman may own shares in companies mentioned in this newsletter. Before making an investment, prospective investors should review each security’s offering documents which summarize the objectives, fees, expenses and associated risks. David Chapman shares his ideas and opinions for informational and educational purposes only and expects the reader to perform due diligence before considering a position in any security. That includes consulting with your own licensed professional financial advisor such as Enriched Investing Incorporated. Performance is not guaranteed, values change frequently, and past performance may not be repeated.
About the author


Website: https://www.enrichedinvesting.com
Disclaimer: David Chapman is not a registered advisory service and is not an exempt market dealer (EMD) nor a licensed financial advisor. We do not and cannot give individualised market advice. David Chapman has worked in the financial industry for over 40 years including large financial corporations, banks, and investment dealers. The information in this newsletter is intended only for informational and educational purposes. It should not be considered a solicitation of an offer or sale of any security. The reader assumes all risk when trading in securities and David Chapman advises consulting a licensed professional financial advisor before proceeding with any trade or idea presented in this newsletter. David Chapman may own shares in companies mentioned in this newsletter. We share our ideas and opinions for informational and educational purposes only and expect the reader to perform due diligence before considering a position in any security. That includes consulting with your own licensed professional financial advisor.