
Excerpt from this week's: Technical Scoop: Debt Chart, Gold Falter, Yields Up
Gold and silver
Source: www.stockcharts.com
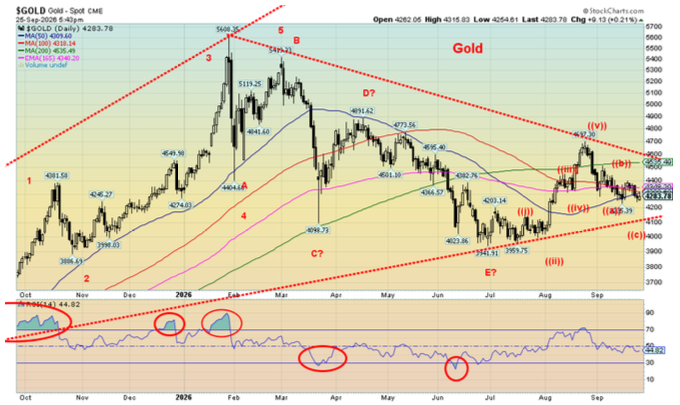
Gold prices continue to struggle due to two prime reasons: interest rates keep chugging higher and the US$ Index keeps chugging higher. The conflict in the Gulf is unresolved and continues to show signs that a solution is far away. The Strait of Hormuz remains shut and the Bab-el-Mandeb Strait remains mostly closed as well. The price pressure for oil and gas is to the upside. That’s inflationary and ensures prices will remain elevated. The consensus is that the Fed will hike rates again, despite the rantings of the president. U.S. economic data remains unexpectedly stronger than expected.
All that begs the question, why gold? Well, $365 trillion of global debt remains a prime reason. The U.S.’s $40 trillion federal debt and yearly budget deficits of upwards of $2 trillion is another reason. The fear of a global debt crisis remains.
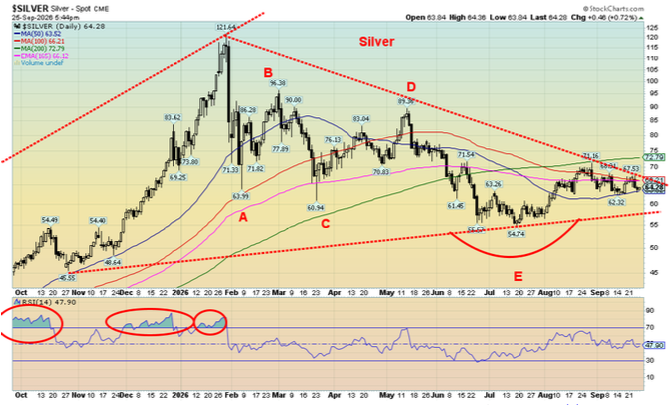
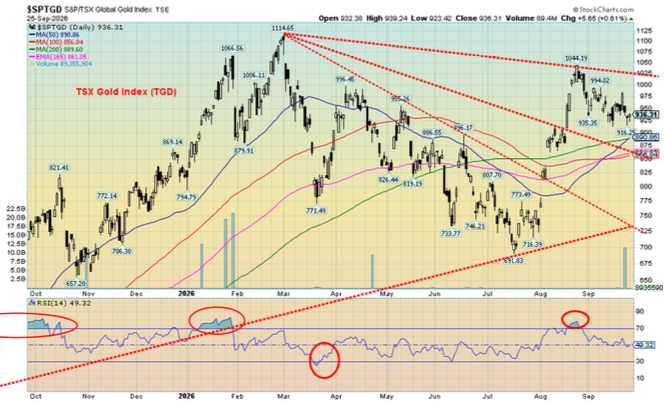
Is all this a gold bull trap? Right now, the expectation is that gold will continue its recent decline, even though it’s a very slow decline. This past week gold fell 2.3%, silver dropped 3.4%, and platinum was off 1.6%. All three are down on the year with gold off 0.7%, silver down 9.8%, and platinum down 13.1%. Palladium also fell 3.2% this past week and is down 21.2% in 2026. But copper, which we view as a leading indicator, made new all-time highs, up 0.9% in the week and up 18.8% on the year. The gold stocks, despite a pullback this past week, remained up on the year. The Gold Bugs Index (HUI) fell 2.4% this past week but is up 12.1% in 2026 and the TSX Gold Index (TGD) dropped 1.9% but is up 14.5% in 2026.
Source: www.stockcharts.com
Our line in the sand for gold is down at $4,100. We believe that needs to hold. Under $4,000 a bigger drop could get underway. To the upside, $4,600 is elusive. Above $4,700 we should get an uptrend under way. For silver, the danger point is a drop under $58. The upside remains elusive, but we need to break above $72 before we’ll feel more comfortable. The TGD continues to form what looks like a huge fan pattern, but the breakout doesn’t come until we are above 1,025. Above 1,050 things look better.
Pressure from rising interest rates, a rising US$ Index, and thoughts the Fed has more hikes in mind will keep some pressure on gold prices. Interestingly, during the inflationary 1970s, gold prices rose in tandem with rising interest rates, both the Fed and the 10-year. Notably, however, was that the US$ Index was falling during this period.
The period into December is notably weak for gold prices. But after that we usually get the best upside moves. Bottoms usually occur in mid-December, but we’ve also seen them bottom in November. All this suggests that we could see continued weakness for gold prices going forward but that also doesn’t mean they’ll collapse. $4,100 is important to hold.
Source: www.stockcharts.com
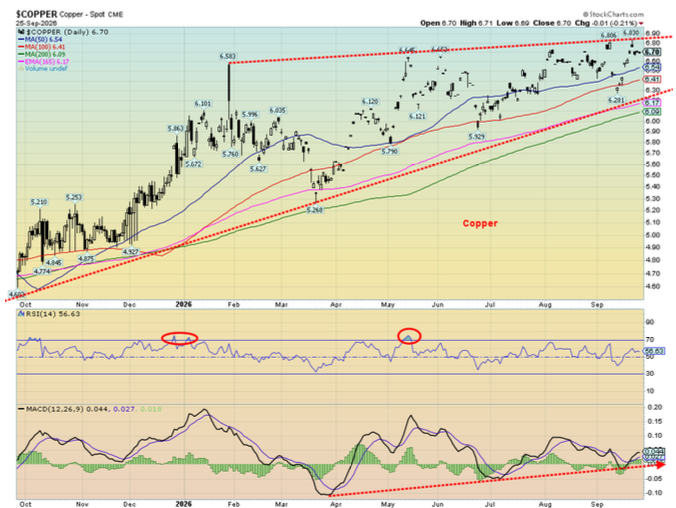
Copper remains in an uptrend. However, there may be overhead resistance at the recent highs near $7. It will be important now to break above $7. The MACD indicator is in a buy mode, and the RSI remains up but nowhere near overbought. Copper continues to be the leader. A note of caution is that while the copper miners remain in an uptrend, we’d have preferred that the Sprott Copper Miners (COPP/NYSE, COPP/TSX) also had made new highs. Like gold, we prefer to see the gold miner’s lead. Freeport McMoran (FCX) remains below its recent all-time highs. FCX is a leading copper company, number two behind the largest BHP Group (BHP).
Source: www.stockcharts.com
Read the FULL report here: Technical Scoop: Debt Chart, Gold Falter, Yields Up
Copyright David Chapman 2026
DisclaimerDavid Chapman is not a registered advisory service and is not an exempt market dealer (EMD) nor a licensed financial advisor. He does not and cannot give individualised market advice. David Chapman has worked in the financial industry for over 40 years including large financial corporations, banks, and investment dealers. The information in this newsletter is intended only for informational and educational purposes. It should not be construed as an offer, a solicitation of an offer or sale of any security. Every effort is made to provide accurate and complete information. However, we cannot guarantee that there will be no errors. We make no claims, promises or guarantees about the accuracy, completeness, or adequacy of the contents of this commentary and expressly disclaim liability for errors and omissions in the contents of this commentary. David Chapman will always use his best efforts to ensure the accuracy and timeliness of all information. The reader assumes all risk when trading in securities and David Chapman advises consulting a licensed professional financial advisor or portfolio manager such as Enriched Investing Incorporated before proceeding with any trade or idea presented in this newsletter. David Chapman may own shares in companies mentioned in this newsletter. Before making an investment, prospective investors should review each security’s offering documents which summarize the objectives, fees, expenses and associated risks. Although Artificial Intelligence (AI) may be deployed from time to time, AI output is monitored and adjusted, if necessary, for accuracy. David Chapman shares his ideas and opinions for informational and educational purposes only and expects the reader to perform due diligence before considering a position in any security. That includes consulting with your own licensed professional financial advisor such as Enriched Investing Incorporated. Performance is not guaranteed, values change frequently, and past performance may not be repeated.
About the author


Website: https://www.enrichedinvesting.com
Disclaimer: David Chapman is not a registered advisory service and is not an exempt market dealer (EMD) nor a licensed financial advisor. We do not and cannot give individualised market advice. David Chapman has worked in the financial industry for over 40 years including large financial corporations, banks, and investment dealers. The information in this newsletter is intended only for informational and educational purposes. It should not be considered a solicitation of an offer or sale of any security. The reader assumes all risk when trading in securities and David Chapman advises consulting a licensed professional financial advisor before proceeding with any trade or idea presented in this newsletter. David Chapman may own shares in companies mentioned in this newsletter. We share our ideas and opinions for informational and educational purposes only and expect the reader to perform due diligence before considering a position in any security. That includes consulting with your own licensed professional financial advisor.