Excerpt from this week's: Technical Scoop: Dovish Culmination, Long Inversion, Differed Dollar

Source: www.stockcharts.com
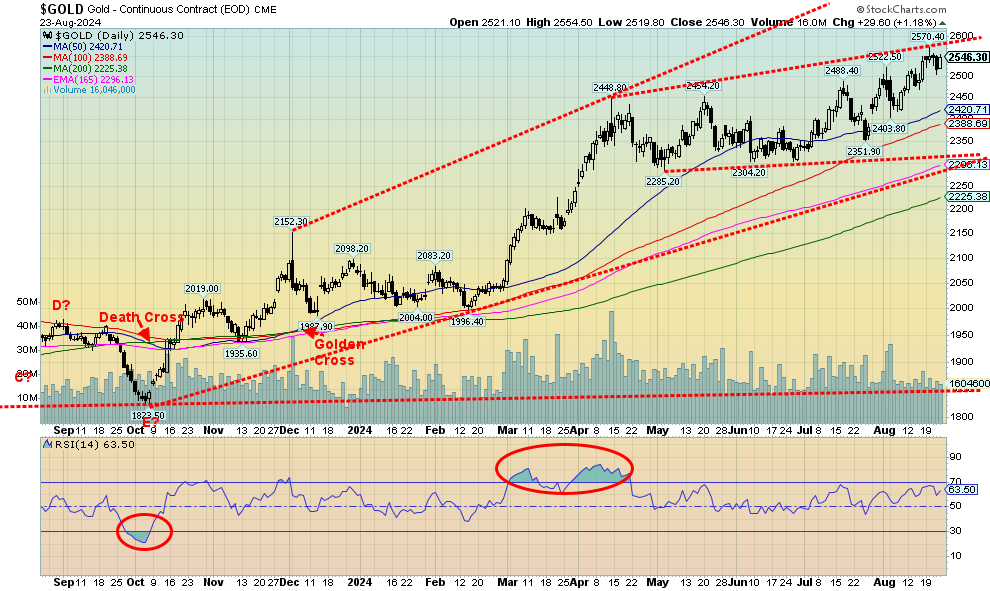
Thanks to Jerome Powell and thoughts of an interest rate cut coming, gold prices held $2,500 after hitting a new all-time high at $2,570. On the week, gold rose 0.3%. This continues what we believe is a stealth rally in gold. The pattern that formed after that high in March 2024 still appears as a rising or ascending triangle. That’s bullish. This past week silver led with a gain of 3.4%. That was also quite positive. Besides Powell signaling interest rate cuts, gold has been having a banner year, thanks to strong central bank buying, strong demand particularly out of Asia (India and China), and safe haven status thanks to geopolitical risk with the wars in Russia/Ukraine, Israel/Hamas (and others), and a potentially divisive U.S. election.
Besides gold and silver, platinum gained 0.4%. However, palladium fell 0.1% while copper regained $4.20, up 1.5%. Copper rising and potentially leading again is also positive for gold. But it was Powell’s rate cut musings that helped spark gold’s rise on Friday, as well as a rise for other commodities, including oil and copper. $2,600 is now in sight. Support is seen down to $2,500, but below that we have further support at $2,400 and even better down to $2,325. Not that we expect to fall that far on any pullback. We continue to have what we see as a stealth rally for gold and if funds started shifting more into the precious metals market, including the gold stocks, it is such a small market that it would only take about a 1% shift out of the broader market. As to the gold stocks, the Gold Bugs Index (HUI) gained 2.4% while the TSX Gold Index (TGD) was up 0.8% this past week. Both saw fresh 52-week highs earlier in the week.
The message is simple. Buy gold and gold-related products. Gold is preferred as, unlike gold stocks, it has no liability.
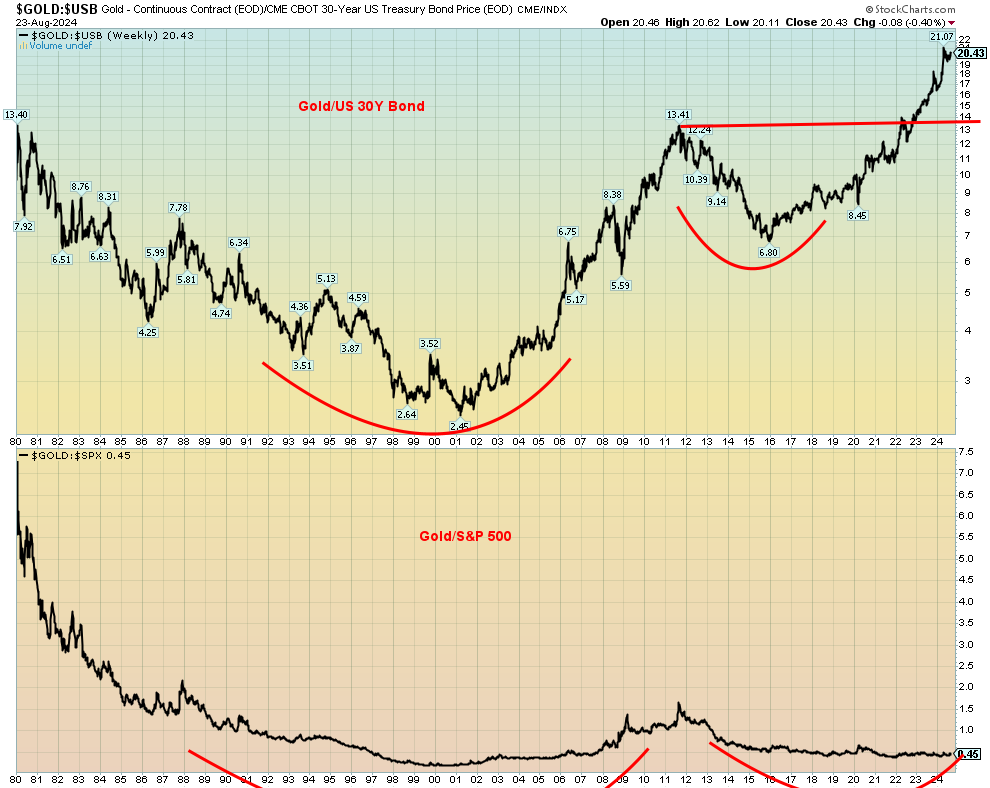
Gold/US 30Y Bond Ratio, Gold/S&P 500 Ratio 1980–2024

Source: www.stockcharts.com
Does one hold gold, bonds, or stocks? The chart above depicts the Gold/US 30Y Bond Ratio and the Gold/S&P 500 Ratio. In the first instance, gold has clearly broken away in its favour. Hold gold over bonds. Note what appears to be a multi-year cup and handle pattern. The first target at 20.02 has been seen and exceeded, suggesting we could move to the next target up to 24.10. The Gold/S&P 500 Ratio is somewhat unclear. However, we note a long period forming what appears to be a rounding bottom. That pattern broke out in 2007 and culminated in the gold top in 2011. The current pattern is not dissimilar to what was seen from 1990 to 2006 before it broke out in favour of gold. That it hasn’t is testament to the strength of the U.S. stock market. Gold has kept pace, but neither have broken away from the other. The pattern, however, suggests it should break out in favour of gold. That gold is favoured over U.S. treasuries may be reflected in the action of central banks that have been unloading U.S. treasuries in favour of gold.

Source: www.stockcharts.com
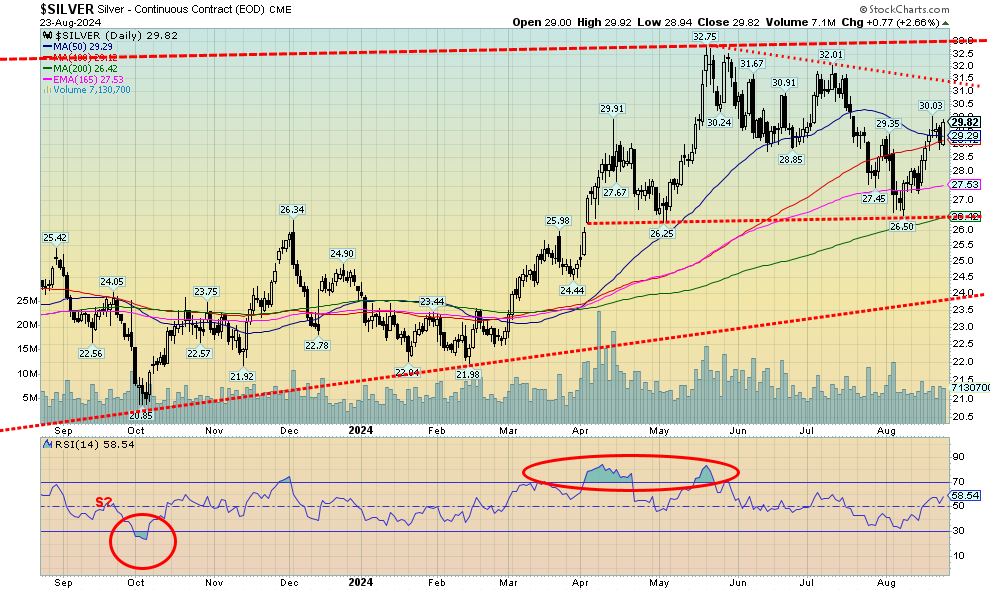
One good thing about silver’s action this past week is that it finally appears to be taking leadership amongst the precious metals. We have often noted that a really good rally won’t get underway until silver takes the lead. This past week silver gained 3.4% to gold’s 0.3%. It was the second week in a row that silver has led. But before we get too excited, silver still lags gold in a number of areas. Gold has been making all-time highs, while silver is not even close. Gold has broken out to new highs but silver has not, despite recent gains. We first need to get over $31 to suggest new highs above the recent high of $32.75 and we need to get over $33 to suggest we could now be on our way to targets up to $39/$40. There is support now at $29, but below that we could then fall back to $27. Silver’s RSI is still only at 58.5, suggesting we have considerable room to move higher. While silver is responding to the same thing as gold, namely interest rate cuts and a falling US$ Index, silver also remains in deficit supply even as demand has been rising, thanks to green energy projects. What we also need to see is a pickup in volume for silver, not dissimilar to what we saw last April 2024 and to a lesser extent in May 2024.

Source: www.stockcharts.com
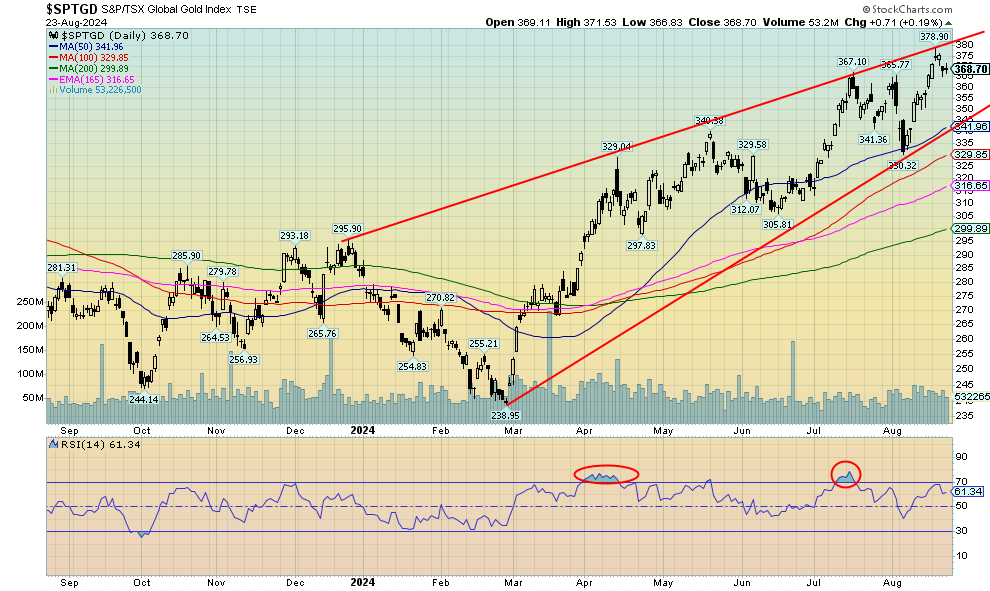
Gold stocks enjoyed an up week, but after hitting a high on Tuesday August 20 the stocks pulled back on what may have been profit-taking. On the week, the TSX Gold Index (TGD) was up 0.8% while the Gold Bugs Index (HUI) gained 2.4%. Anglo Gold (AU) is not a component of the TGD and it enjoyed a strong up week, giving the HUI the edge. Nonetheless, both indices did make fresh 52-week highs on Tuesday before pulling back. We did hit the top of what may be bull channel this past week. However, the breaking of what may have been a double top suggests to us that we are still poised to go higher. Potential targets are up to 404. The all-time high is 455 set back in 2011. At this point we are still over 20% away from that high. The HUI has a lot more work as its high was 639 in 2011 vs. 319 today. That leaves the HUI needing to gain 100% from current levels to reach that high. For the TGD, there is support at 365, but below that good support doesn’t come in until 340/342. Below that level the rally may be over. The index is still not overvalued here, nor is it overbought here with an RSI at 61.3. It still has considerable room to move higher.
Read the FULL report here: Technical Scoop: Dovish Culmination, Long Inversion, Differed Dollar
Disclaimer
David Chapman is not a registered advisory service and is not an exempt market dealer (EMD) nor a licensed financial advisor. He does not and cannot give individualised market advice. David Chapman has worked in the financial industry for over 40 years including large financial corporations, banks, and investment dealers. The information in this newsletter is intended only for informational and educational purposes. It should not be construed as an offer, a solicitation of an offer or sale of any security. Every effort is made to provide accurate and complete information. However, we cannot guarantee that there will be no errors. We make no claims, promises or guarantees about the accuracy, completeness, or adequacy of the contents of this commentary and expressly disclaim liability for errors and omissions in the contents of this commentary. David Chapman will always use his best efforts to ensure the accuracy and timeliness of all information. The reader assumes all risk when trading in securities and David Chapman advises consulting a licensed professional financial advisor or portfolio manager such as Enriched Investing Incorporated before proceeding with any trade or idea presented in this newsletter. David Chapman may own shares in companies mentioned in this newsletter. Before making an investment, prospective investors should review each security’s offering documents which summarize the objectives, fees, expenses and associated risks. David Chapman shares his ideas and opinions for informational and educational purposes only and expects the reader to perform due diligence before considering a position in any security. That includes consulting with your own licensed professional financial advisor such as Enriched Investing Incorporated. Performance is not guaranteed, values change frequently, and past performance may not be repeated.


