Excerpt from Technical Scoop: FOMC, Gold, Canadian Elections, Inflation, Climate Change
 Source: www.stockcharts.com
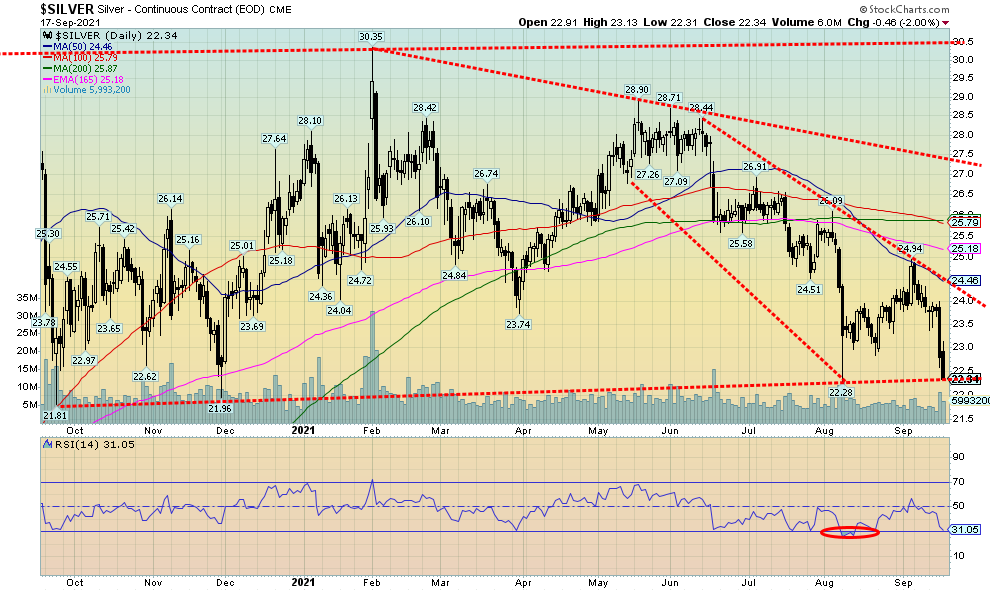
Silver was hammered this past week, down 6.5% on the week including a drop of 6.1% Thursday and Friday this past week. Silver is now not far from making fresh 52-week lows. The low of $22.31 was barely above the March low of $22.28. The lows seen last September and November at $21.81 and $21.96 are not that far away. We have considered $22 a bit of a line in the sand that we would not want to see fall. Intraday pokes under the level are okay as long as any probe down there is on low volume. Silver’s RSI has fallen to 31, not far from the bear levels of under 30. As well, while gold is down it is not confirming the drop in silver, a potential divergence. We note that the DSI indicator from trade-futures.com has fallen to 10% bulls, the lowest level seen since March 2020 when it hit 8%. The print in March 2020 signaled a bottom. While the DSI indicator can still fall further with probes under 10%, gold is looking a little better and if gold starts to rise silver will follow. We actually prefer silver to lead. As we saw this week silver led the decline even outpacing the miners. A favourite silver stock of ours, Gatos Silver (GATO), closed at $16.40, well above the $11.61 low of March 2021. Another potential divergence. However, we can’t say the same for Pan American Silver (PAAS), which has been making fresh 52-week lows over the past month. Silver has work to do to crawl out of this hole. A breakout doesn’t come until we clear over $24.50. Regaining $24 will be an accomplishment as it is necessary. But a more serious breakout doesn’t come until we are over $26. The recent high was just under $25. And, of course, what’s important is that we hold $22 (give or take a little).
Source: www.cotpricecharts.com
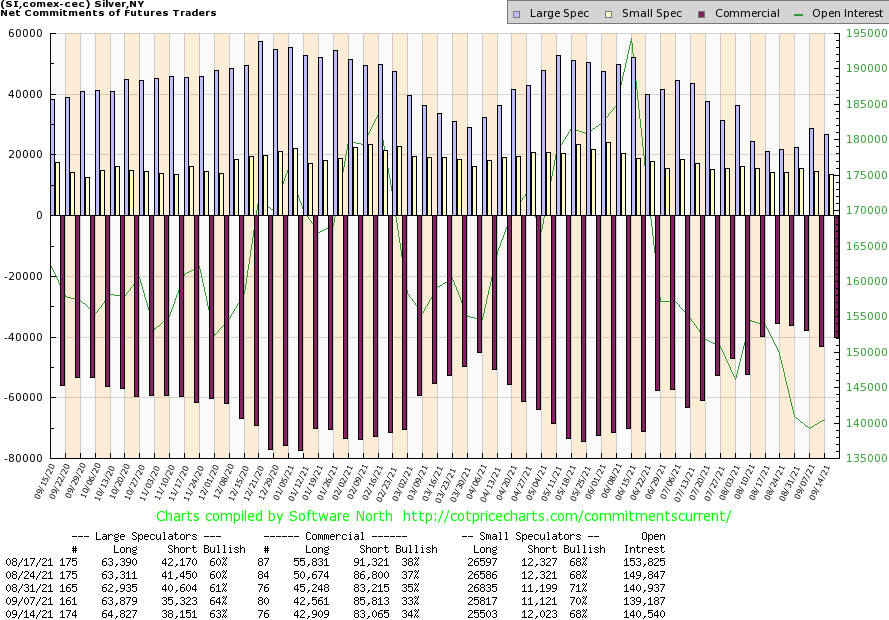
The commercial COT for silver improved this past week, rising to 34% from 33%. Short open interest fell around 2,800 contracts while long open interest rose about 500 contracts. That’s not overwhelming for sure, but it is a positive step. And these numbers are only until September 14 so it missed the big drop of September 16. A reduction in short open interest suggests short covering. The large speculators COT slipped to 63% from 64% as they added almost 3,000 short contracts. But they added some longs as well, up about 1,000 contracts. That’s an improvement but we’d like to see more with next week’s report.
Source: www.stockcharts.com
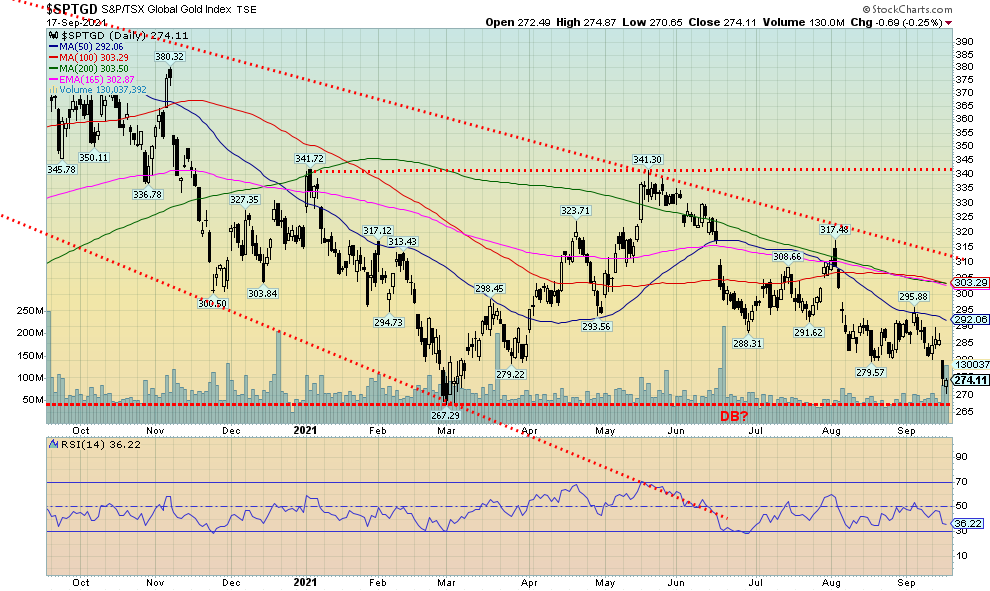
The pain continues for the gold miners. This past week the TSX Gold Index (TGD) fell another 2.6% while the Gold Bugs Index (HUI) dropped 2.3%. With a low of 270.65 it was just above the March low of 267.29. In what may be a bit of encouragement, the TGD left a hammer pattern on the charts Friday. A hammer pattern is Japanese candlestick pattern whereby the lower shadow is almost double the size of the real body and the real body is in the upper part and is relatively short. The TGD also left a gap on the charts between 280 and 284.50 and the temptation might be to try and fill that gap. The HUI, on the other hand, did make fresh 52-week lows this past week at 234.96 vs. a low of 247.99 in March. It too left a hammer on the charts. The hammer pattern frequently shows up following a steep decline. It can, though it’s not guaranteed, signal a potential low. Another encouraging sign was that the drop experienced by the gold miners was relatively mild compared to the drop seen for both gold (down 2.3%) and silver (down 6.5%). Usually, the losses for the miner are double that or more for gold. Regaining into the gap would be positive. Above 292 things begin to improve and over 295 we could rise to 300/305. A significant breakout would occur above 310. Ideally, the TGD does not make a new low, setting up a potential double bottom with the March low. The neckline would be up around 340. That’s a bit away from here. Lots of damage to repair in the interim. Not making new lows would be very helpful.
Source: www.stockcharts.com
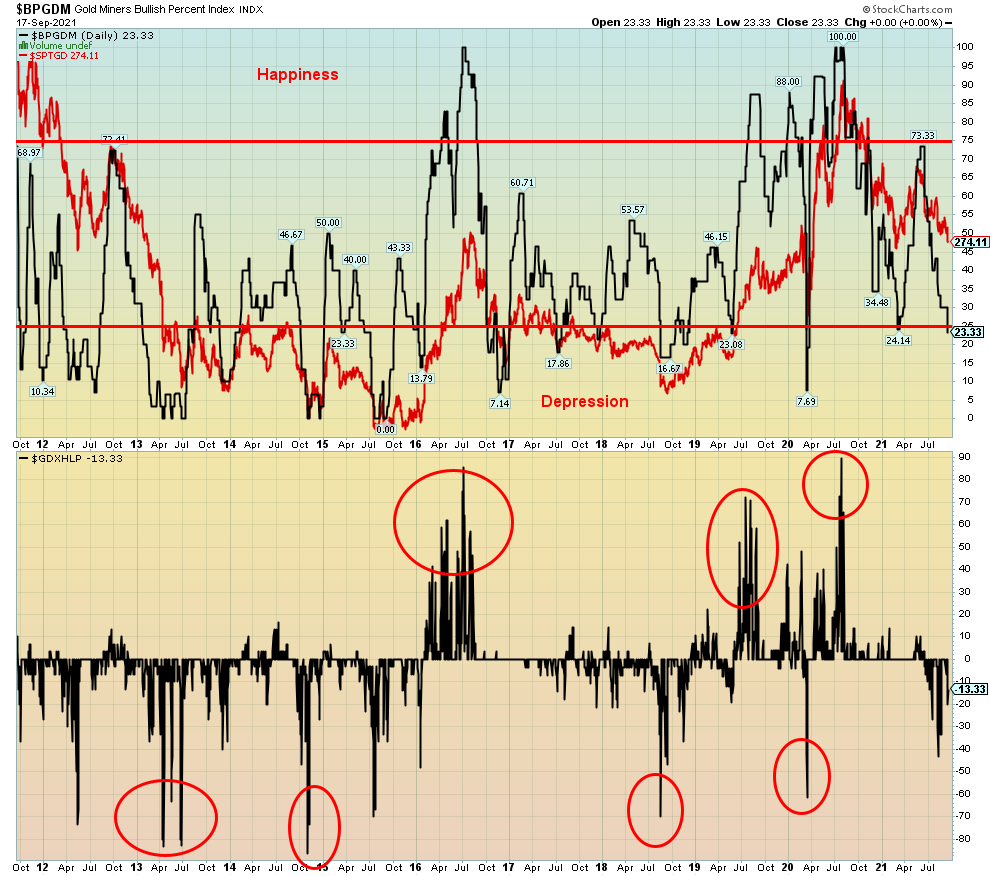
For the first time since the March 2021 low the Gold Miners Bullish Percent Index (BPGDM) has slipped under 25 (last at 23.33). As well, the Gold Miners New Highs-New Lows Percent Index is also at its lowest since August. Given it is currently somewhat higher it is a bit of a divergence with the earlier print. But it is not significant at this time. As low as the BPGDM has gone it could go a lot lower. The ultimate was in December 2015 when it hit zero. Since then, the lowest seen was the March 2020 pandemic crash when it fell to 7.69. The period 2012–2015 did see the BPGDM hit below 25 on numerous occasions. But gold and the gold miners were in a bear market at that time. Is the glass half full or half empty? The TGD is down 34% from its August 2020 high but up 58% from the March 2020 pandemic crash. The short and intermediate trend is pointed down but the long-term trend continues to cling to an uptrend. Nonetheless, the BPGDM is signaling that the sentiment towards the gold miners has turned bearish. However, it is not at what we call extreme bearishness.
Excerpt from Technical Scoop: FOMC, Gold, Canadian Elections, Inflation, Climate Change
About the author


Website: https://www.enrichedinvesting.com
Disclaimer: David Chapman is not a registered advisory service and is not an exempt market dealer (EMD) nor a licensed financial advisor. We do not and cannot give individualised market advice. David Chapman has worked in the financial industry for over 40 years including large financial corporations, banks, and investment dealers. The information in this newsletter is intended only for informational and educational purposes. It should not be considered a solicitation of an offer or sale of any security. The reader assumes all risk when trading in securities and David Chapman advises consulting a licensed professional financial advisor before proceeding with any trade or idea presented in this newsletter. David Chapman may own shares in companies mentioned in this newsletter. We share our ideas and opinions for informational and educational purposes only and expect the reader to perform due diligence before considering a position in any security. That includes consulting with your own licensed professional financial advisor.