Excerpt from this week's: Technical Scoop: Tariff Spook, Buoyed Economy, Shutdown Impact
Gold and Silver
![]()
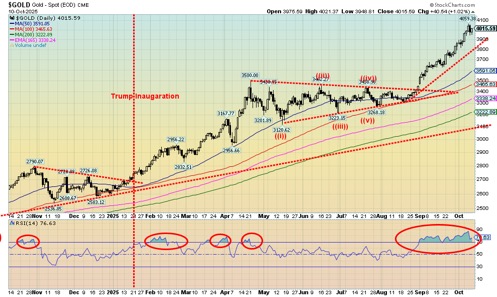
Source: www.stockcharts.com
What’s going to stop the gold and silver market? A few things. First, that extremely overbought condition that has persisted since August. We’ve never seen one that has lasted as long as this one. Second, that stock markets took a tumble on Friday after 100% tariffs were imposed on China, on top of the current tariffs. During the meltdowns in 2008 and 2020, gold and gold stocks followed the markets down. But holding up the best was gold itself, not so much the stocks. Third, that we’ve going almost straight up since August, so a pause is healthy for the long-term viability.
We clipped this from Morningstar (morningstar.com) with data provided by Dow Jones (www.dowjones.com). It’s revealing.
Front Month Comex Gold for October delivery gained $95.10 per troy ounce, or 2.45% to $3975.90 this week. Note the following:
- up for eight consecutive weeks
- longest winning streak since the week ending February 21, 2025, when the market rose for eight straight weeks
- up 10 of the past 11 weeks
- today it is up $29.60 or 0.75%
- third highest close in history
- up 13 of the past 16 sessions
- today's settlement value is the third highest this year
- off 1.67% from its 52-week high of $4043.30 hit on Wednesday, October 8, 2025
- up 54.96% from its 52-week low of $2565.70 hit on Friday, November 15, 2024
- rose 49.60% from 52 weeks ago
- off 1.67% from its 2025 settlement high of $4043.30 hit on Wednesday, October 8, 2025
- up 50.69% from its 2025 settlement low of $2638.40 hit on Monday, January 6, 2025
- off 1.67% from its record high of $4043.30 hit Wednesday on October 8, 2025
- month-to-date it is up 3.52%
- year-to-date it is up $1346.70 or 51.22%
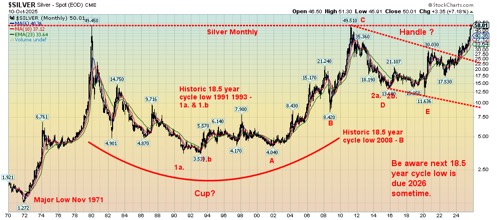
Gold gained 3.4% this past week. But the real star of the week was silver that, after 45 years, has finally made an all-time high. Silver was up 4.3% – yes, to new all-time highs with the high at $51.30. Interestingly, silver has moved into backwardation, meaning the spot price is now higher than the first futures price. Why? Shortages of silver have put pressure on the spot price. Silver breaking above $50 after 45 years is momentous and signals to us that a more explosive move for silver could be coming.
Not to be outdone after 14 years, the Gold Bugs Index (HUI) took out its 2011 high, losing 1.1% on the week. The TSX Gold Index (TGD) also faltered, following another all-time high down 1.9%. Not a good sign, even as gold and silver made all-time highs. But the gold stocks tend to follow the market more and the stock markets fell sharply on Friday, so gold stocks followed. Remember the old adage that you can’t go broke taking a profit.
Other metals were mixed. Platinum made new 52-week highs but closed down 1.3%. Palladium had a good week, up 13.3%, and made a 52-week high. Copper, spooked by the market fall on Friday and anticipating a possible recession, fell 4.8%, following an encouraging move over $5. Copper stocks followed copper down.
Currencies were pretty benign on the week as the US$ Index gained 1.2% but dropped 0.7% on Friday along with the stock market. All the other currencies were down with the Japanese yen hit, down 2.5%.
Oil prices fell again, thanks to the truce agreement with Israel and Gaza. Tensions in the Middle East fell. WTI oil fell 4.2% below $60 and Brent crude was down 3.7%. Natural gas (NG) didn’t fare any better, down 6.0%, but NG at the EU Dutch Hub was up 0.9% on ongoing conflicts with Russia/Ukraine. Energy stocks fell with the market, with the ARCA Oil & Gas Index (XOI) off 4.3% while the TSX Energy Index (TEN) fell 1.7%. The energy sector woes continue, but the stocks have outperformed, suggesting to us that oil prices could rise again in the near future.
Gold is overdue for a correction. If that’s correct, then it should be just a correction, nothing more. November/December has in the past seen important lows. The 31-month cycle suggests a potential low for
November/December. The last significant low was October 2022 so in fact we are overdue. Some have suggested a 20% correction, so be aware.
Silver, after hitting over $50 for the first time ever, is also due for a pullback. The stocks typically suffer the most in a pullback. Support for gold is at $3,800, $3,600, and $3,400. Below $3,400 is serious danger as it could signal that the gold bull is over. Below $3,300 it confirms it’s over. We are not expecting the latter, but even a 10% correction takes us to around $3,600.
For silver, support is seen at $46 and $44. Silver is some 44% above its 200-day MA while gold is about 25% above its 200-day MA. Both are a bit of a stretch, begging for the correction. For the gold stock indices, the HUI has support at 580 and 540. The TGD at 700 and 650. Falling that far would be modest corrections. More spooking is the 200-day MA support at 495 for the TGD and 410 for the HUI.
We may be starting an overdue correction for gold, silver, and gold stocks. It’s healthy and a new leg up would most likely get underway in December/January. But taking profits now is not unwise. The junior development miners could also suffer, due to their volatility at the best of times.
Silver 1970–2025 (monthly)
![]()
Source: www.stockcharts.com
Read the FULL report here: Technical Scoop: Tariff Spook, Buoyed Economy, Shutdown Impact
Copyright David Chapman 2025
Disclaimer
David Chapman is not a registered advisory service and is not an exempt market dealer (EMD) nor a licensed financial advisor. He does not and cannot give individualised market advice. David Chapman has worked in the financial industry for over 40 years including large financial corporations, banks, and investment dealers. The information in this newsletter is intended only for informational and educational purposes. It should not be construed as an offer, a solicitation of an offer or sale of any security. Every effort is made to provide accurate and complete information. However, we cannot guarantee that there will be no errors. We make no claims, promises or guarantees about the accuracy, completeness, or adequacy of the contents of this commentary and expressly disclaim liability for errors and omissions in the contents of this commentary. David Chapman will always use his best efforts to ensure the accuracy and timeliness of all information. The reader assumes all risk when trading in securities and David Chapman advises consulting a licensed professional financial advisor or portfolio manager such as Enriched Investing Incorporated before proceeding with any trade or idea presented in this newsletter. David Chapman may own shares in companies mentioned in this newsletter. Before making an investment, prospective investors should review each security’s offering documents which summarize the objectives, fees, expenses and associated risks. David Chapman shares his ideas and opinions for informational and educational purposes only and expects the reader to perform due diligence before considering a position in any security. That includes consulting with your own licensed professional financial advisor such as Enriched Investing Incorporated. Performance is not guaranteed, values change frequently, and past performance may not be repeated.
About the author


Website: https://www.enrichedinvesting.com
Disclaimer: David Chapman is not a registered advisory service and is not an exempt market dealer (EMD) nor a licensed financial advisor. We do not and cannot give individualised market advice. David Chapman has worked in the financial industry for over 40 years including large financial corporations, banks, and investment dealers. The information in this newsletter is intended only for informational and educational purposes. It should not be considered a solicitation of an offer or sale of any security. The reader assumes all risk when trading in securities and David Chapman advises consulting a licensed professional financial advisor before proceeding with any trade or idea presented in this newsletter. David Chapman may own shares in companies mentioned in this newsletter. We share our ideas and opinions for informational and educational purposes only and expect the reader to perform due diligence before considering a position in any security. That includes consulting with your own licensed professional financial advisor.