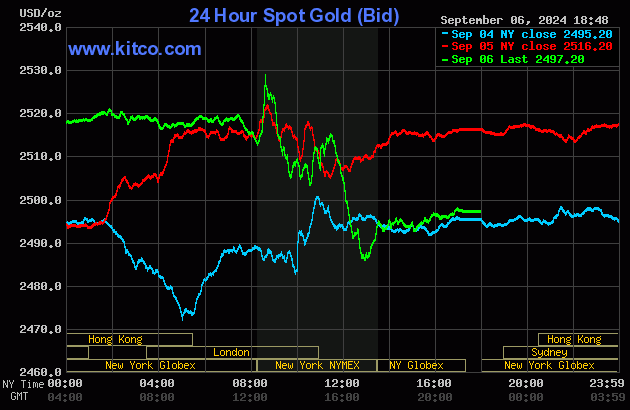
The gold price didn't do much through almost all of the Globex trading session on Friday, but was then sold down a bit starting at or shortly after the noon silver fix in London -- and that lasted until five minutes before the 8:20 a.m. COMEX open in New York. It shot higher on that b.s. jobs report number...but 'da boyz' were laying in wait...engineering it two sharps steps lower -- and setting its low tick at 12:40 p.m. EDT. It was allowed to rally a bit from there until the 1:30 p.m. COMEX close -- and it didn't do much after that.
The high and low ticks in gold, both of which were set in COMEX trading in New York, were reported as $2,536.10 and $2,490.70 in the October contract -- and $2,559.80 and $2,513.90 in December. The October/December price spread differential in gold at the close in New York yesterday was $23.10... December/February was $21.40 -- and February/April was $17.40 an ounce.
Gold was closed on Friday afternoon in New York at $2,497.20 spot, down $19.00 on the day -- and 13 bucks off its Kitco-recorded low tick. Net volume was very heavy at 218,500 contracts -- and there were a bit over 9,500 contracts worth of roll-over/switch volume on top of that.
I saw that 96 gold, plus 72 silver contracts were traded in September yesterday -- and what that means, if anything, won't be known until we see tonight's Daily Delivery and Preliminary Reports.
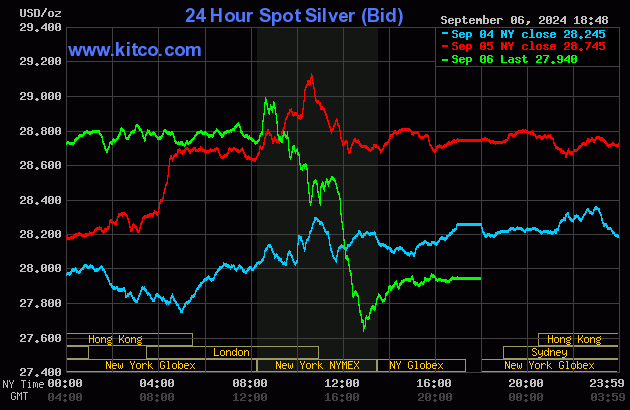
Silver's price was managed in an almost identical fashion as gold's...with its low tick coming around 12:55 p.m. in COMEX trading in New York.
The high and low ticks in it were reported by the CME Group as $29.47 and $28.01 in the December contract...an intraday move of $1.46...a hair under 5 percent. The September/December price spread differential in silver at the close in New York yesterday was 37.5 cents...December/March was 36.4 cents -- and March/May was 22.2 cents an ounce.
Silver was closed in New York on Friday afternoon at $27.94 spot...down 80.5 cents from Thursday -- and 31 cents off its Kitco-recorded low tick. Net volume was certainly on the heavier side...but not overly so considering the price action...at a bit over 86,000 contracts -- and there were around 2,800 contracts worth of roll-over/switch volume out of December and into future months in this precious metal...mostly March and May of 2025.
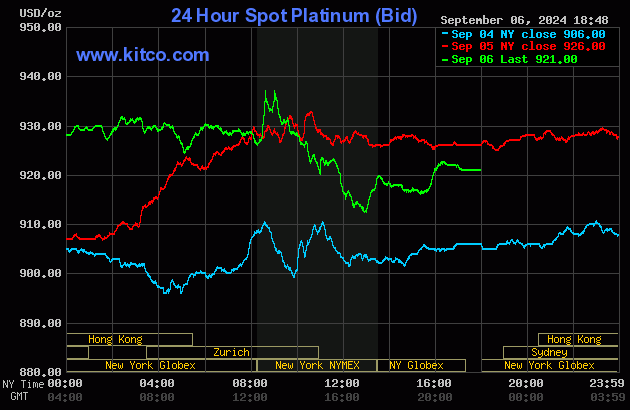
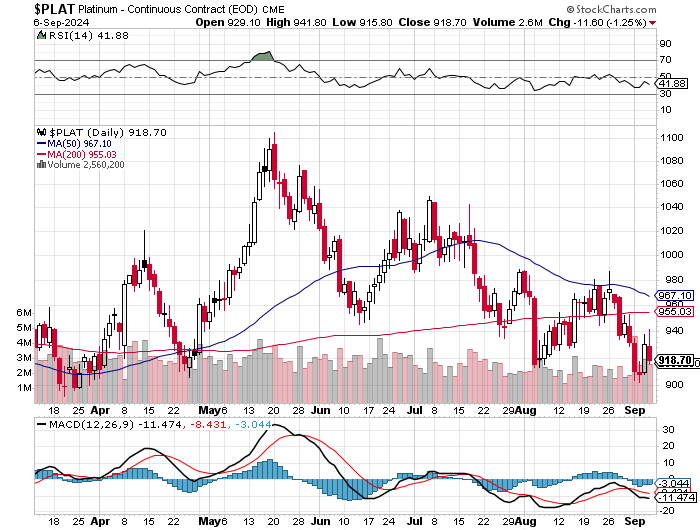
It was the same for platinum -- and after its 1 p.m. EDT low tick was set in COMEX trading in New York, it was allowed to take two small steps higher until around 4:20 p.m. in after-hours trading. It didn't do much after that. Platinum was closed at $921 spot, down only 5 bucks on the day -- and 9 dollars off its Kitco-recorded low tick.
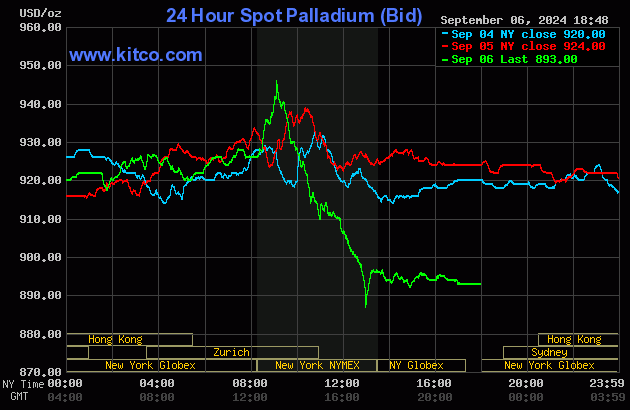
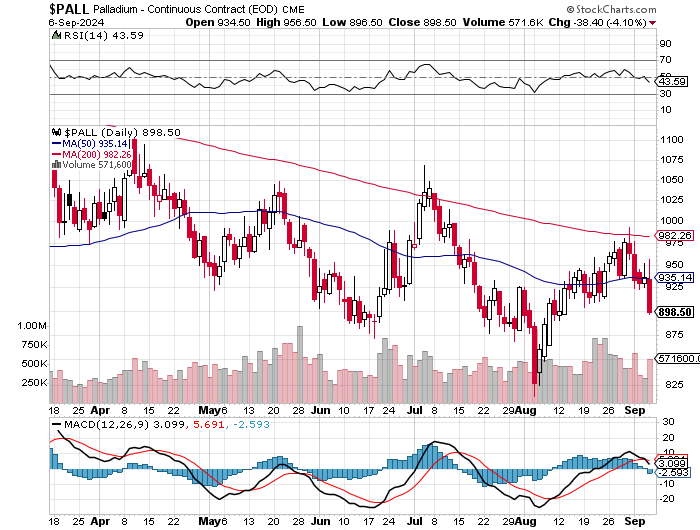
Palladium wandered quietly sideways until it blew higher at 8:30 a.m. in New York. Its 9 a.m. EDT $946 high tick was brutally capped -- and it was even more brutally engineered lower until its low tick was set a minute or two before 1 p.m. Its sharp rally from that juncture was capped within a few minutes -- and it was sold very quietly lower from there until trading ended at 5:00 p.m. EDT. Palladium was closed at $893 spot, down 31 bucks on the day...53 bucks off its high tick -- and 7 dollars off its Kitco-recorded low tick.
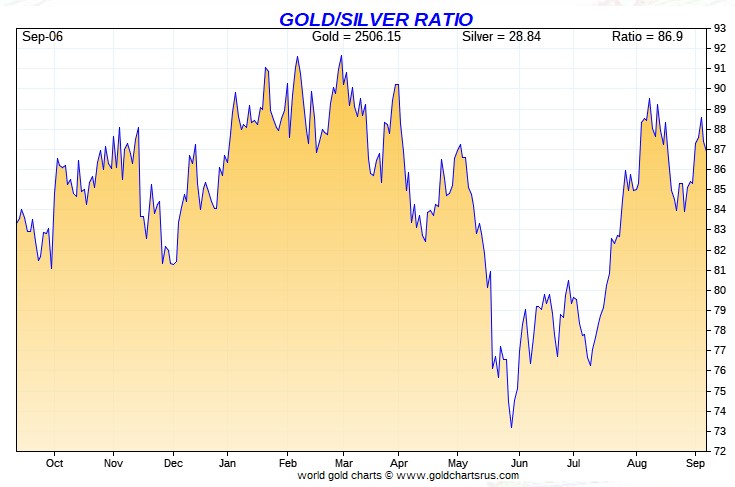
Based on the kitco.com spot closing prices in silver and gold posted above, the gold/silver ratio worked out to 89.4 to 1 on Friday...compared to 87.5 to 1 on Thursday.
Here's the 1-year Gold/Silver Ratio Chart...courtesy of Nick Laird and, for whatever reason, the Friday data point is not on it. Click to enlarge.
![]()
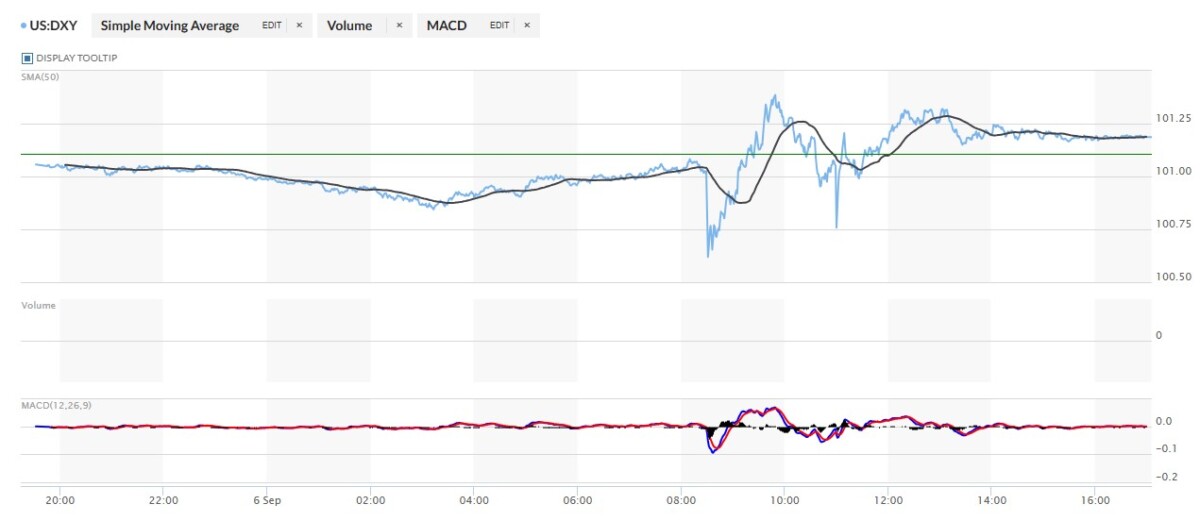
The dollar index closed very late on Thursday afternoon at 101.11 -- and then opened lower by 5 basis points once trading commenced at 7:32 p.m. EDT on Thursday evening, which was 7:32 a.m. China Standard Time on their Friday morning. It traded flat until 10:50 a.m. CST -- and then began to decline noticeably...ending at 8:13 a.m. in London. It crawled quietly and a tad unevenly higher from there until a trap door opened at 8:30 a.m. in New York. But the usual 'gentle hands' were waiting -- and it 'rallied' until 9:50 a.m. EDT -- and then headed lower anew until it was saved once more at precisely 11:00 a.m. EDT...the London close. It then 'rallied again until 12:20 p.m...traded flat until 1:08 p.m...declined a bit until 1:25 p.m. -- and didn't do much of anything after that.
The dollar index finished the Friday trading session in New York at 101.18 -- up 7 basis points from its close on Thursday.
Here's the DXY chart for Friday...thanks to marketwatch.com as usual. Click to enlarge.
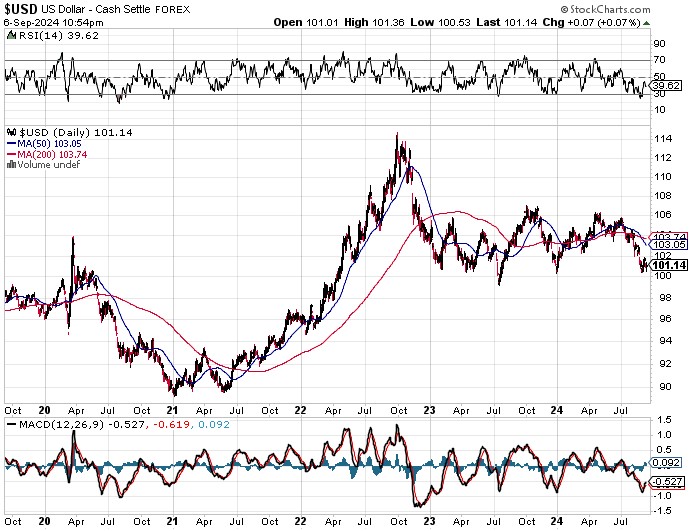
And here's the 5-year U.S. dollar index chart that appears in this spot every Saturday column, courtesy of stockcharts.com as always. The delta between its close...101.14...and the close on the DXY chart above, was 4 basis points below its spot close. Click to enlarge.
The currencies and precious metal prices were being equally managed during the COMEX trading session in New York. Nothing resembling free-market forces were allowed to prevail in either.
U.S. 10-year Treasury: 3.7100%...down 0.0210 (-0.5629%)...as of the 1:59 p.m. CDT close
Here's the 5-year 10-year U.S. Treasury chart from the yahoo.com Internet site -- which puts the yield curve into a somewhat longer-term perspective. Click to enlarge.
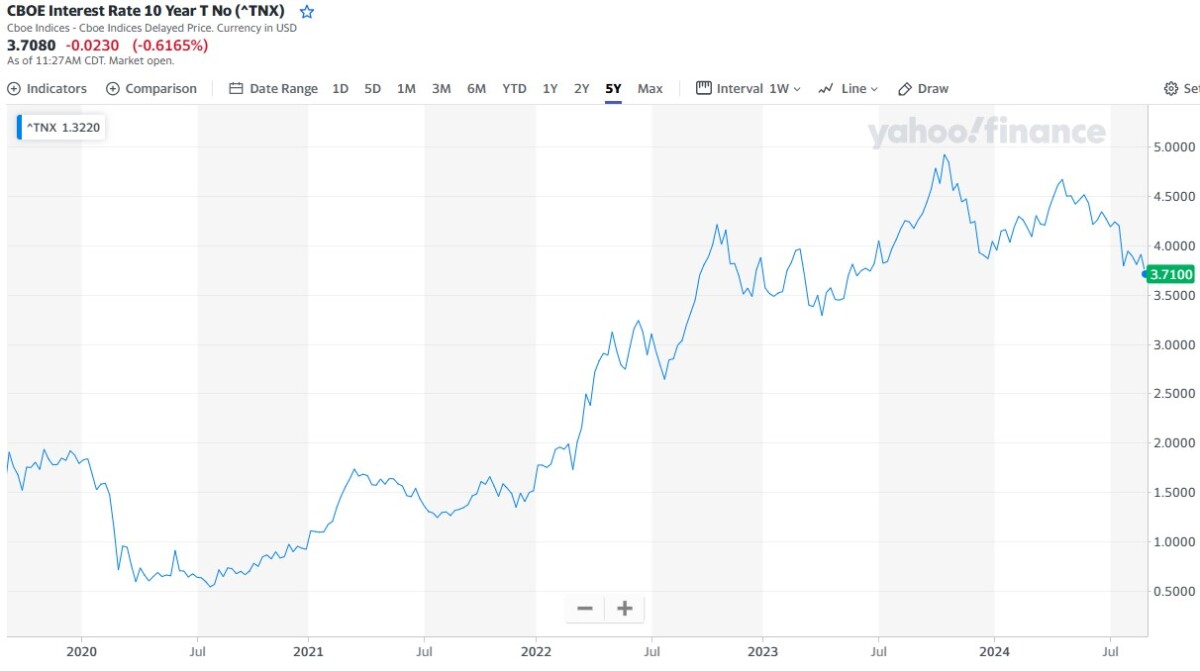
For the holiday-shortened week, the ten-year was down about 21 basis points -- and as I keep pointing out, the Fed has had the yield curve mostly under lock-down since 19 October of last year.
![]()
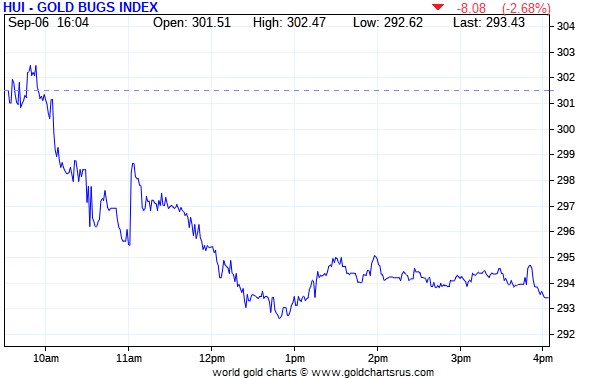
The gold shares opened about unchanged and they then ticked a bit higher until around 9:45 a.m. in early morning trading in New York. They were sold down pretty hard from that point until around 1:50 p.m. EDT...rallied a bit until minutes before the 1:30 p.m. COMEX close -- and then crawled quietly and a bit unevenly lower until the markets closed at 4:00 p.m. EDT. The HUI closed down 2.68 percent.
Here's Nick's 1-year Silver Sentiment Index chart, updated with Friday's candle. It got smacked by a further 4.22 percent. Click to enlarge.
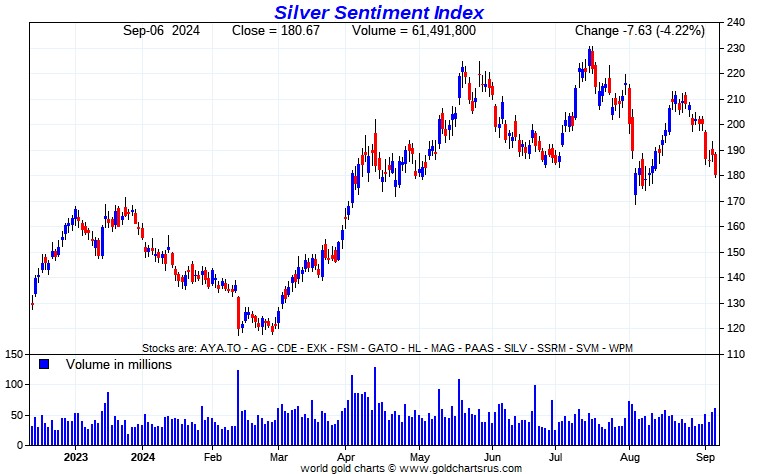
There certainly weren't any stars yesterday -- and the two biggest underperformers were SilverCrest Metals and Gatos Silver, closing down 5.74 and 5.58 percent respectively.
Except for this news item from Aya Gold & Silver, I didn't see any news yesterday on any of the other silver companies that comprise the above Silver Sentiment Index.
The silver price premium in Shanghai over the U.S. price on Friday was 9.37 percent.
The reddit.com/Wallstreetsilver website, now under 'new' but not improved management, is linked here. The link to two other silver forums are here -- and here.
![]()
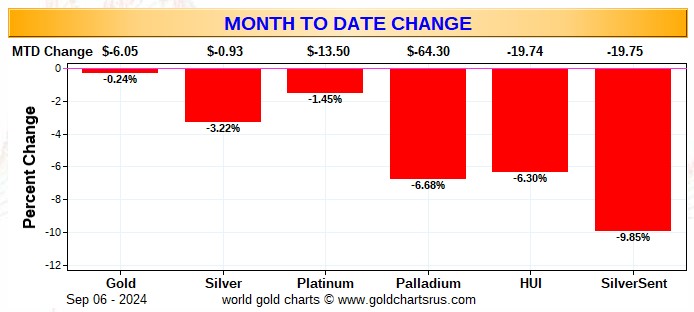
Because of the holiday-shortened week, I only have two of the three usual charts that appear in this spot in every weekend missive. They show the changes in gold, silver, platinum and palladium in both percent and dollar and cents terms, as of their Friday closes in New York — along with the changes in the HUI and the new Silver Sentiment Index.
The weekly chart will return next week.
Here's the month-to-date chart...only four trading days old, which also doubles as the weekly chart for this one week only -- and the gross underperformance of the silver shares is the glaringly obvious standout once again...not helped at all by the big price pressure that we had in silver this past week. Of course the performance of the gold equities is nothing to write home about, either.
What this year-to-date chart doesn't show is that the big gains in gold and silver that took place during the first two weeks of August, have all but vanished since then. This is particularly true of silver and its equities -- and is completely obvious if you scroll back to the 1-year Silver Sentiment Index chart a few paragraphs up. Click to enlarge.
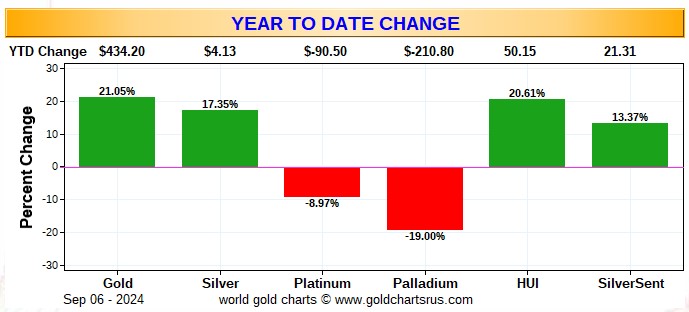
Of course -- and as I mention in this spot every Saturday -- and will continue to do so...is that if the silver price was sitting very close to its all-time $50 high, like gold is very close to its all-time high of $2,560 or thereabouts...it's a given that the silver equities would be outperforming their golden cousins by an absolute country mile, or maybe two.
![]()
The CME Daily Delivery Report for gold on Thursday was updated by the CME Group sometime on Friday, as it now shows that 702 gold contracts were actually posted for delivery within the COMEX-approved depositories on Monday. It showed zero for gold when I saw this report on Thursday night.
The only short/issuer that mattered was Citigroup, issuing 700 contracts out of its house account. There was a big list of long/stoppers -- and the three largest by far were Wells Fargo Securities, JPMorgan and British bank HSBC... picking up 283, 177 and 102 contracts...Wells Fargo for their house account. The next two down the list were Advantage and Morgan Stanley, stopping 79 and 35 contracts for their respective client accounts.
This changes the CME Preliminary Report for gold on Thursday, as it now shows that gold open interest in September fell by 28 contracts, leaving 899 still open, minus the 702 contracts mentioned in the previous paragraph. Wednesday's Daily Delivery Report showed that 14 gold contracts were actually posted for delivery on Friday/yesterday...so that meant that 702-28=674 more gold contract just got added to September deliveries.
The silver deliveries reported on Thursday night by the CME Group were not changed -- and were as reported in Friday's column.
The CME Daily Delivery Report for Friday -- and Day 6 of September deliveries showed that 212 gold -- and 56 silver contracts were posted for delivery within the COMEX-approved depositories on Tuesday.
In gold, the only two short/issuers of the three in total that mattered were BofA Securities and Advantage, as they issued 130 and 79 contracts respectively...BofA Securities from their house account. There was a fairly impressive list of long/stoppers...with the three biggest being Wells Fargo Securities, Advantage and JPMorgan, picking up 76, 41 and 38 contracts respectively...Wells Fargo for their own account. After them were British bank HSBC, Morgan Stanley and Scotia Capital/Scotiabank, stopping 22, 19 and 12 contracts...Scotia Capital for its house account.
In silver, the two short/issuers were Advantage and ADM, issuing 50 and 6 contracts out of their respective client accounts. The three largest of the five long/stoppers in total were Scotia Capital/Scotiabank, Advantage and Citigroup, picking up 28, 11 and 8 contracts...Scotia Capital for its house account.
In palladium, there were 35 contracts issued and stopped.
The link to yesterday's Issuers and Stoppers Report is here.
Month-to-date there have already been 3,296 gold contracts issued/reissued and stopped -- and that number in silver is 4,734 contracts. In platinum it's 47 contracts -- and in palladium...51.
The CME Preliminary Report for theFriday trading session showed that gold open interest in September declined by 625 COMEX contracts, leaving 274 still open, minus the 212 contracts mentioned a few paragraphs ago. Thursday's revised Daily Delivery Report above showed that 702 contracts are out for delivery on Monday, so that means that 702-625=77 more gold contracts just got added to September deliveries.
Silver o.i. rose by 46 contracts, leaving 136 still around, minus the 56 contracts mentioned a bunch of paragraphs ago. Thursday's Daily Delivery Report showed that 10 silver contracts were actually posted for delivery on Monday, so that means that 46+10=56 more silver contracts were added to the September delivery month -- and it's a given that those are the same 56 contracts that are out for delivery on Tuesday as per the above Daily Delivery Report.
Total gold open interest on Friday actually rose by 774 COMEX contracts...a big surprise, as I was expecting a huge drop after yesterday's price decline -- and total silver o.i.also rose, it by a net 1,429 COMEX contracts...another 'man bites dog' number. Both these are subject to some revisions by the time the CME Group gets around to posting the final figures on their Internet site later on Monday morning CDT. I'll be checking the final numbers on Monday for sure...as both these numbers are very counterintuitive.
Because of that big delivery reporting error in gold by the CME Group on Thursday, I checked the final changes in total open interest in both gold and silver for Thursday against the Preliminary Report numbers. In gold, the preliminary number showed an increase of 9,431 COMEX contracts...but that had been cut down to an increase of only 561 contracts in the final report... which I was more than happy to see. In silver, the preliminary number showed a drop of 1,790 contracts. The final number was a decline of 1,849 contracts.
![]()
For the fourth day in a row there were no reported changes in GLD...but an authorized participant removed 45,621 troy ounces of silver from SLV -- and an amount that small is usually indicative of a fee payment of some kind. There were also 13,873 troy ounces of gold taken out of GLDM.
In other gold and silver ETFs and mutual funds on Planet Earth on Friday, net of any changes in COMEX, GLD, GLDM and SLV inventories, there were a net 45,059 troy ounces of gold added -- and a net 43,474 troy ounces of silver were added as well.
There was a sales report from the U.S. Mint yesterday...the first one in September...as they reported selling 7,500 troy ounces of gold eagles -- 2,500 one-ounce 24K gold buffaloes -- and 850,000 silver eagles. The question still remains as to who is buying all these silver eagles.
I was just looking at silver eagle sales for all of 2024 -- and for the eight complete sales months of the year so far...five of those have involved sales of exactly 1,700,000 silver eagles. It will be interesting to see if we end up with that same number for September...as we're exactly half-way there after Friday's sales report.
![]()
There was very decent activity in gold over at the COMEX-approved depositories on the U.S. east coast on Thursday. There were 81,226 troy ounces received at JPMorgan -- and 55, 402 troy ounces departed Brink's, Inc. There was no paper activity -- and the link to this is here.
The only activity in silver was the one good delivery bar/1,022 troy ounces that left Delaware. But in the paper department there were a net 105,543 troy ounces transferred from the Registered category and back into Eligible.
Five different depositories were involved -- and the two largest amounts were the 128,720 troy ounces transferred from the Registered category and back into Eligible over at Asahi -- and the 107,240 troy ounces transferred in the opposite direction over at Manfra, Tordella & Brookes, Inc.
The link to Thursday's COMEX silver activity is here.
There was pretty decent activity over at the COMEX-approved gold kilobar depositories in Hong Kong on their Thursday...all of it at Brink's, Inc. as usual. They reported receiving 700 kilobars -- and shipped out 1,171 of them. The link to this, in troy ounces, is here.
The Shanghai Futures Exchange reported that a net 128,218 troy ounces of silver were removed from their inventories on their Friday, which now stands at 32.453 million troy ounces.
![]()
Here are the usual 20-year charts that show up in this space in every weekend column. They show the total amounts of physical gold and silver held in all know depositories, ETFs and mutual funds as of the close of business on Friday.
During the week just past, there were a net 48,000 troy ounces of gold added...and a net 303,000 troy ounces of silver were added as well. Click to enlarge.
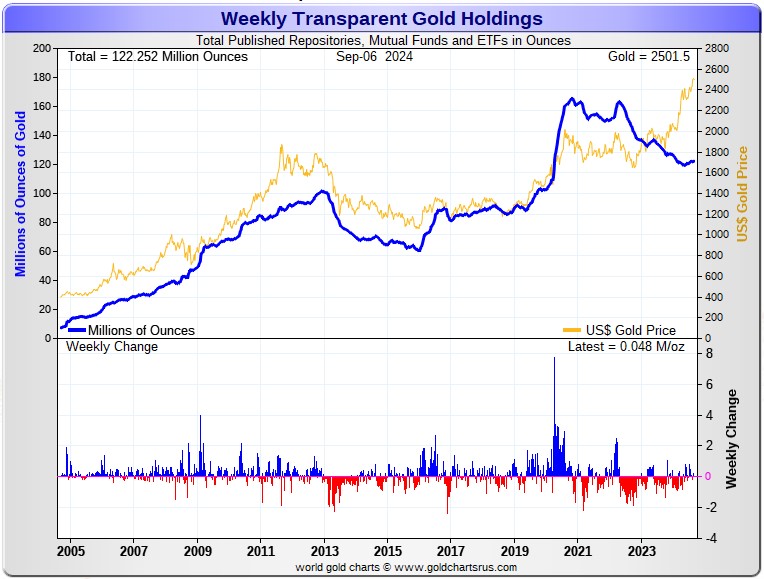
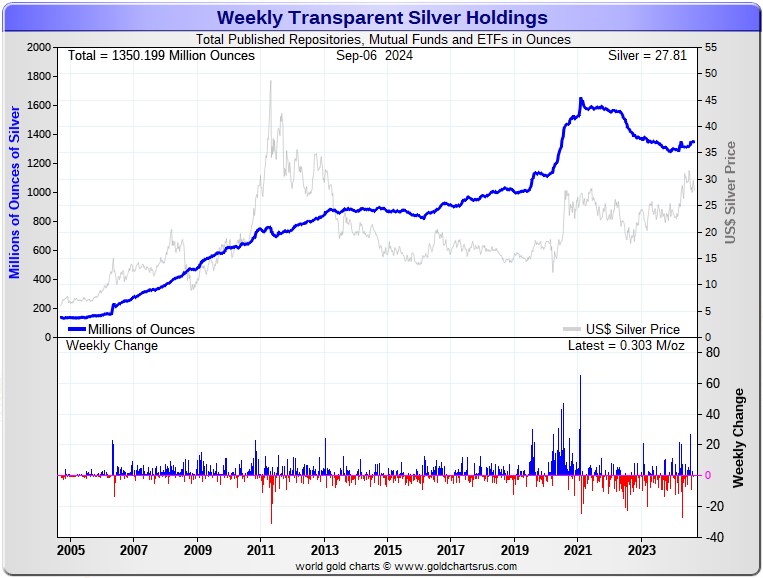
According to Nick Laird's data on his website, there were a net 239,000 troy ounces of gold, plus a net 1.407 million troy ounces of silver were added to, all the world's known depositories, mutual funds and ETFs during the last four weeks.
Retail bullion sales are still exceedingly slow...so one has to wonder [as mentioned a bit further up] about those 1,700,000 silver eagles that the mint reported selling in August...plus the 850,000 reported sold yesterday. Who bought those? Premiums vary, depending on the dealer. They're very high at Kitco...but somewhat to much lower in most other places.
At some point there will be huge quantities of silver required by all the silver ETFs and mutual funds once institutional buying finally kicks in...which there hasn't been much of in the last month...except for the COMEX, Sprott, ZKB and SLV.
And as Ted stated a while ago now, it would appear that JPMorgan has parted with most of the at least one billion troy ounces that they'd accumulated since the drive-by shooting that commenced at the Globex open at 6:00 p.m. EDT on Sunday, April 30, 2011.
If they continue in this vein, they are going to have to cough up even more ounces to feed this year's deficit...another 215 million of them according to that latest report from The Silver Institute...which I'm sure didn't include the approximately 120 million ounces that India purchased earlier in the year... plus most of the 13.9 million ounces that China imported in June -- and the 5.6 million ounces that India bought in July...plus what went into the COMEX and some silver ETFs over the last month.
The physical demand in silver at the wholesale level continues unabated -- but certainly cooled off this past week. But the amount of silver being physically moved, withdrawn, or changing ownership is still ongoing. This frantic in/out activity, as Ted had been pointing out for years, is a sure sign that 1,000 oz. good delivery bars are getting ever harder to come by.
New silver has to be brought in from other sources [JPMorgan] to meet the ongoing demand for physical metal. This will continue until available supplies are depleted...which will be the moment that JPMorgan & Friends stop providing silver to feed this deepening structural deficit, now in its fourth year.
The vast majority of precious metals being held in these depositories are by those who won't be selling until the silver price is many multiples of what it is today.
Sprott's PSLV is the third largest depository of silver on Planet Earth with 176.5 million troy ounces -- and some distance behind the COMEX, where there are 306.0 million troy ounces being held...minus the 103 million troy ounces mentioned in the next paragraph.
It's now been proven beyond a shadow of a doubt that 103 million troy ounces of that amount in the COMEX is actually held in trust for SLV by JPMorgan according to a letter Ted received from the CFTC earlier this year. That brings JPMorgan's actual silver warehouse stocks down to around the 32 million troy ounce mark...quite a bit different than the 135.00 million they indicate they have -- up about 170,000 troy ounces from what they showed last Friday.
But PSLV is still some distance behind SLV, as they are the largest silver depository, with 466.2 million troy ounces as of Friday's close...up a net 200,000 troy ounces from a week ago.
The latest short report from two weeks ago, showed that the short position in SLV rose by 9.77 percent...from 13.14 million shares sold short in the prior short report...up to 14.43 million shares in the current report.
BlackRock issued a warning several years ago to all those short SLV, that there might come a time when there wouldn't be enough metal for them to cover. That would only be true if JPMorgan decides not to supply it to whatever entity requires it...which is most certainly a U.S. bullion bank, or perhaps more than one.
The next short report will be posted on The Wall Street Journal's website very early on Wednesday evening EDT on September 11.
Then there's that other little matter of the 1-billion ounce short position in silver held by Bank of America in the OTC market...with JPMorgan & Friends on the long side. Ted said it hadn't gone away -- and he'd also come to the conclusion that they're short around 25 million ounces of gold with these same parties as well. The latest report for the end of Q1/2024 from the OCC came out about two months ago now -- and after carefully scrutiny, I noted that nothing much had changed since the end of Q4/2023.
![]()
The Commitment of Traders Report for positions held at the close of COMEX trading on Tuesday, showed declines in the commercial net short positions in both gold and silver -- and the most in the latter, as expected.
In silver, the Commercial net short position fell by a hefty 7,611 COMEX contracts, or 38.055 million troy ounces of the stuff.
They arrived at that number by reducing their long position by 5,906 contracts, but also reduced their short position by 13,517 COMEX contracts -- and it's the difference between those two numbers that represents their change for the reporting week.
Under the hood in the Disaggregated COT Report it was all Managed Money trading selling that accounted for that change, as they decreased their net long position by 7,888 COMEX contracts...which they accomplished by reducing their gross long position by 2,635 contracts -- and also sold 5,253 short contracts. It's the sum of those two numbers that represents their change for the reporting week.
The Nonreportable/small traders were also sellers, reducing their net long position by 1,484 contracts...which made the Other Reportables buyers, as they increased their net long position by 1,761 contracts.
Doing the math: 7,888 plus 1,484 minus 1,761 equals 7,611 COMEX contracts...the change in the Commercial net short position.
The Commercial net short position in silver now stands at 64,529 COMEX contracts/322.645 million troy ounces...down those 7,611 contracts from the 72,140 COMEX contracts/360.700 million troy ounces they were short in the August 30 COT Report.
The Big 4 shorts actually increased their net short position, but only by 59 contracts, up to 51,323 contracts during the reporting week...from the 51,264 contracts they were short in last Friday's COT Report...which is obviously still hugely bearish.
The Big '5 through 8' shorts decreased their net short position by 1,664 contracts ...from the 23,791 contracts in last Friday's COT Report, down to 22,127 contracts in yesterday's COT Report. That's about 9,500 contracts more than they 'normally' hold short.
The Big 8 commercial shorts in total decreased their overall net short position from 75,055 contracts, down to 73,450 COMEX contracts week-over-week...a decline of only 1,605 COMEX contracts.
That 73,450 contract short position held by the Big 8 is hugely bearish, when you consider the fact that they were short only 53,041 contracts in the October 27, 2023 COT Report.
Making up the difference between the change in the commercial net short position...7,611 contracts -- and what the Big 8 traders did...1,605 contracts... Ted's raptors, the small commercial traders other than the Big 8, were the biggest buyers of all during this past reporting week...increasing their long position from the 2,915 contracts they held last week...up to the 8,921 contracts they were long in yesterday's COT Report...an increase of 6,006 contracts.
Here's Nick's 9-year COT chart for silver. Click to enlarge.
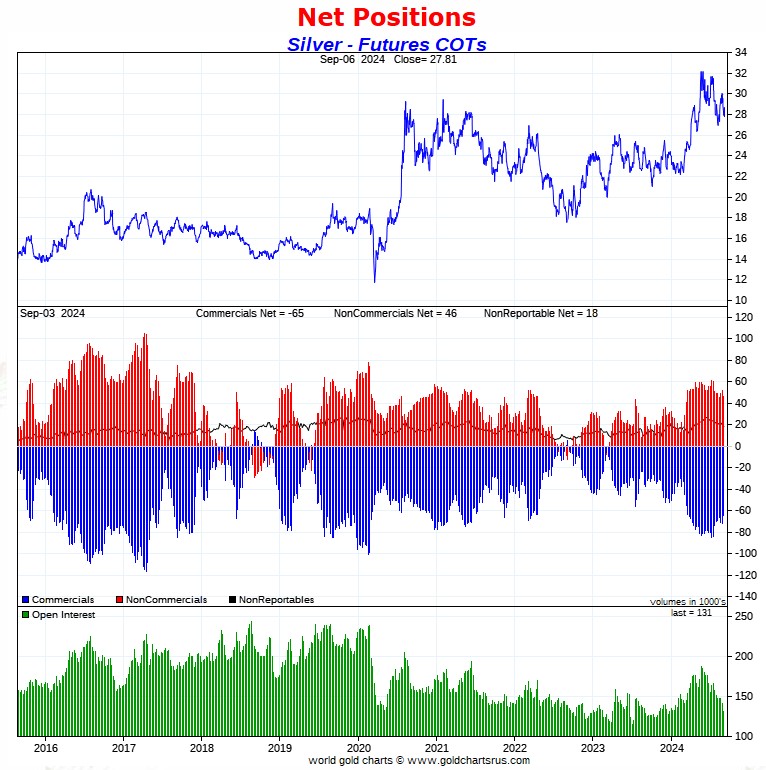
Judging by the fact that Ted's raptors were the biggest beneficiaries of silver's engineered price decline below its 50-day moving average during the reporting week, it's safe to conclude that their collusive trading was the cause of that.
But what is also obvious from this report is that the Big 4 are the short sellers of last resort...as they actually had to increase their short position during the reporting week. And as I've stated on many occasions...as had Ted...it's most likely the Biggest 1 or 2 shorts that are the last lines of defence against a 3-digit silver price.
The Big 8 collusive commercial shorts in silver, minus their uneconomic and market-neutral spread trades, remain short 56.1% of the entire open interest in silver in the COMEX futures market...up a tad from last week -- and what they do is all that matters.
In order to get back to a wildly bullish set up in silver, the Managed Money traders et al. would have to be coerced/tricked into puking up long positions, or going short something in the order 31,000 COMEX silver contracts. And despite what 'da boyz' accomplished on Friday, I just don't think that they can do it.
So, from a COMEX futures market perspective, the set-up remains very bearish in silver...but as Ted had mentioned on several occasions over the years, at some point what the numbers show in the COT Report won't matter, as the drumbeat of that structural supply/demand deficit grows ever louder. The manic in/out movement in silver in the COMEX, SLV and other ETFs and mutual funds, is the ongoing proof of that.
![]()
In gold, the commercial net short position fell by 10,432 COMEX contracts, or 1.043 million troy ounces of the stuff.
They arrived at that number by reducing their long position by 4,686 COMEX contracts, and also decreased their short position by 15,118 contracts. It's the difference between those two numbers that represents their change for the reporting week.
Under the hood in the Disaggregated COT Report, it was mostly a Managed Money affair, as they reduced their net long position by 8,201 COMEX contracts...which they accomplished by reducing their long position by 5,890 contracts -- and increased their short position by 2,311 contracts. It's the sum of those two numbers that represents their change for the reporting week.
The Nonreportable/small traders were also sellers during the reporting week...reducing their net long position by 3,545 contracts...which meant that the traders in the Other Reportables had to have increased their net long position, which they did to the tune of 1,314 COMEX contracts.
Doing the math: 8,201 plus 3,545 minus 1,314 equals 10,432 COMEX contracts, the change in the commercial net short position.
The commercial net short position in gold now sits at 311,887 COMEX contracts/31.189 million troy ounces of the stuff...down those 10,432 contracts from the 322,319 COMEX contracts/32.232 million troy ounces they were short in the August 30 COT Report. This is obviously an improvement ...but not a material amount by any stretch of the imagination.
The Big 4 shorts, like in silver, also increased their short position yet again -- and by a surprising 2,789 COMEX contracts...from 214,443 contracts they were short last week, up to 217,232 contracts in yesterday's report. Like I keep saying, I don't remember the last time that the Big 4 were short north of 200,000 contracts in gold -- and they've been above that mark [and rising] for the last five consecutive weeks. I'll have more on this below the chart -- and in the monthly Bank Participation Report a bit further down.
The Big '5 through 8' shorts decreased their net short position, them by 4,212 contracts...from the 81,394 contracts they held short in last Friday's COT Report, down to 77,182 contracts hold short in the current COT Report.
And because of the elevated short position held by the Big '5 through 8' commercial shorts, I still suspect that there's a managed money trader in their ranks -- and they would be in the No. 7 or 8 position at most.
The Big 8 short position decreased from 295,837 COMEX contracts/29.584 million troy ounces in last week's COT Report...down to 294,414 contracts/ 29.441 million troy ounces...a tiny decrease of only 1,423 contracts.
Ted's raptors...the small commercial traders other than the Big 8...were buyers for the second week in a row, as they decreased their grotesque 26,482 COMEX contract short position they held last week, down to 17,473 COMEX contracts in this week's COT Report...a drop of 9,009 contracts...still their fourth-highest short position on record.
Here's Nick Laird's 9-year COT Report chart for gold...updated with the above data. Click to enlarge.
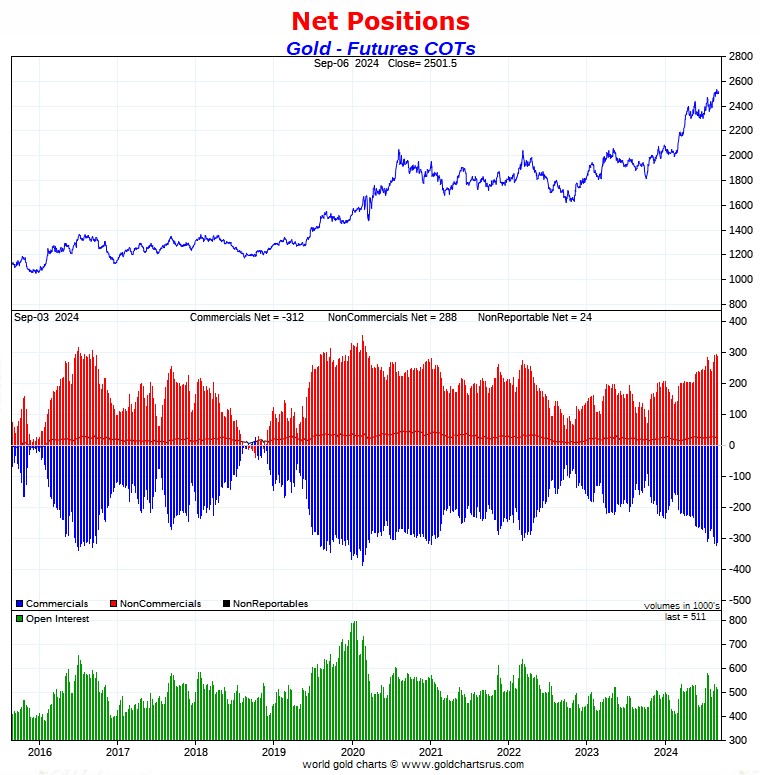
So, like in silver, since Ted' raptors...the small collusive commercial traders other than the Big 8 shorts...were the biggest beneficiary of gold's price decline during the reporting week...they were most likely the ones responsible for its price decline as well.
Please don't forget that the commercial shorts in gold are virtually all the same players as those that are short silver.
As I mentioned in this space last week, the Big 4 have been far more aggressive in going short gold than the traders in the Big '5 through 8' category -- and I get the impression that like in silver, in the Big 4 category, its mostly the Big '1 or 2' that are doing most of the shorting. That was on display in both again this week. They are the only ones keeping the lid on their respective prices.
The collusive commercial traders of whatever stripe are short 61.0 percent of total open interest in gold in the COMEX futures market -- and a bit more than that once their non-economic and market-neutral spread trades are subtracted out.
Despite the improvement in the commercial net short position in gold in yesterday's COT Report...plus the obvious improvement since the Tuesday cut-off for the next COT Report, the set-up in gold from a COMEX futures market perspective remains extremely bearish.
There's still no sign whatsoever that the Big 8 commercial shorts...all bullion banks and investment houses...are loosening their iron grip on the precious metals...which was patently obvious in their respective engineered price declines on Friday.
![]()
In the other metals, the Managed Money traders in palladium decreased their net short position by 975 COMEX contracts...but remain net short palladium by 12,780 contracts...57.8 percent of total open interest. All of the other four categories in the Disaggregated COT Report are net long palladium...the Swap Dealers in the commercial category in particular.
In platinum, the Managed Money traders decreased their net long position by 13,058 contracts during the reporting week -- and are now back on the short side to the tune of 9,291 COMEX contracts. The commercial traders in the Producer/Merchant category are meganet short 20,687 COMEX contracts... while the Swap Dealers in the commercial category are mega net long 10,546 COMEX contracts. The traders in both the Other Reportables and Nonreportable/small traders categories are net long platinum by very decent amounts as well...the Other Reportables in particular.
It's the world's banks in the Producer/Merchant category that are 'The Big Shorts' in platinum in the COMEX futures market, as per yesterday's Bank Participation Report, which I'll get into in a bit.
In copper, the Managed Money traders decreased their net long position by a further 4,311 COMEX contracts -- but remain net long copper by 12,276 COMEX contracts...about 307 million pounds of the stuff as of yesterday's COT Report...down from the 414 million pounds they were net long copper in last Friday's report.
Copper, like platinum, continues to be a wildly bifurcated market in the commercial category. The Producer/Merchant category is net short 38,087 copper contracts/952 million pounds -- while the Swap Dealers are net long 19,123 COMEX contracts/478 million pounds of the stuff.
Whether this means anything or not, will only be known in the fullness of time. Ted said it didn't mean anything as far as he was concerned, as they're all commercial traders in the commercial category. However, this bifurcation has been in place for as many years as I can remember -- and that's a lot.
In this vital industrial commodity, the world's banks...both U.S. and foreign... are net long 11.1 percent of the total open interest in copper in the COMEX futures market as shown in the September Bank Participation Report that came out yesterday...up from the 8.4 percent they were net long in August's.
At the moment it's the commodity trading houses such as Glencore and Trafigura et al., along with some hedge funds, that are net short copper in the Producer/Merchant category, as the Swap Dealers are net long, as pointed out above.
The next Bank Participation Report is due out on Friday, October 4.
![]()
Here’s Nick Laird’s “Days to Cover” chart, updated with the COT data for positions held at the close of COMEX trading on Tuesday, September 3. It shows the days of world production that it would take to cover the short positions of the Big 4 — and Big '5 through 8' traders in every physically traded commodity on the COMEX. Click to enlarge.
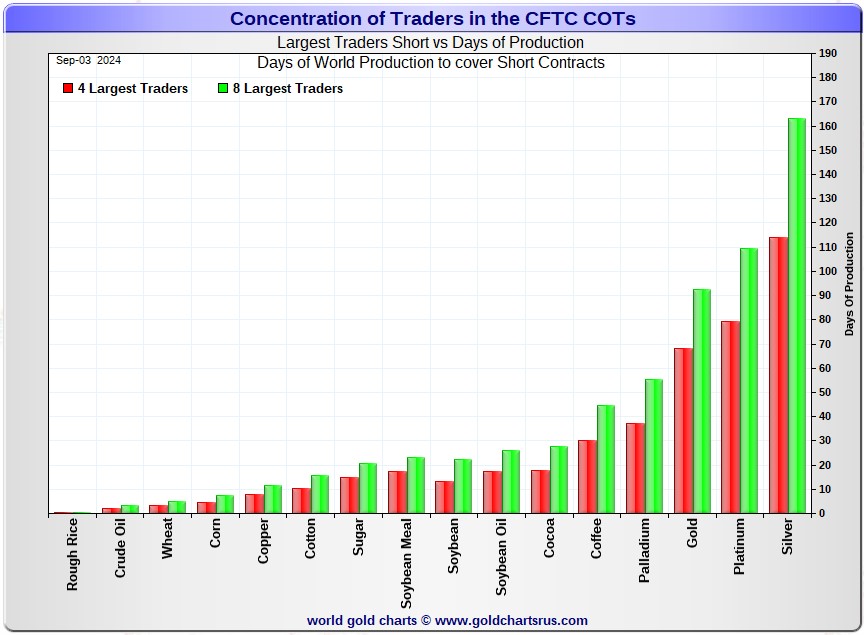
In this week's data, the Big 4 traders are short about 114 days of world silver production... unchanged from the last COT report. The ‘5 through 8’ large traders are short an additional 49 days of world silver production ...down 4 days from last Friday's COT Report, for a total of about 163 days that the Big 8 are short -- and obviously down 4 days from last week.
Those 163 days that the Big 8 traders are short, represents about 5.4 months of world silver production, or 367.25 million troy ounces/73,450 COMEX contracts of paper silver held short by these eight commercial traders. Several of the largest of these are now non-banking entities, as per Ted's discovery a year or so ago. September's Bank Participation Report that came out yesterday, continues to confirm that this is still the case -- and not just in silver, either.
The small commercial traders other than the Big 8 shorts, Ted's raptors, are now net long silver by 8,921 COMEX contracts...up big, as they increased their long position by 6,006 contracts during the past reporting week.
In gold, the Big 4 are short about 68 days of world gold production...up about 1 day from last Friday's COT Report. The '5 through 8' are short an additional 25 days of world production, down about 1 day from last week...for a total of 93 days of world gold production held short by the Big 8 -- and obviously unchanged from the prior COT Report.
The Big 8 commercial traders are short 56.1 percent of the entire open interest in silver in the COMEX futures market as of yesterday's COT Report, up a fair amount from the 53.0 percent that they were short in last Friday's COT Report -- and a tad higher than that mark once their market-neutral spread trades are subtracted out.
The non-economic and market-neutral spread trades are not reported in the Producer/ Merchant category by the CFTC -- and the reason as Ted had said was very simple. If one knew how many spread trades they had on, then you could calculate, to the contract, exactly how short they were in every COMEX commodity that they trade in -- and those numbers are closely guarded secrets by both the CFTC and the CME Group.
In gold, it's 57.6 percent of the total COMEX open interest that the Big 8 are short, up a bit from the 56.7 percent they were short in last Friday's COT Report -- and exactly 61.0 percent of total open interest once you add in what Ted's raptors [the small commercial traders other than the Big 8] are short on top of that...a further 17,473 COMEX contracts. This is the very definition of egregious.
Those weekly percentage increases in both silver and [especially] gold were mainly due to the fact that that total open interest in both dropped by decent amounts during the reporting week...silver in particular, which obviously affects the percentage calculation.
Ted was of the opinion that Bank of America is short about one billion ounces of silver in the OTC market, courtesy of JPMorgan & Friends. He was also of the opinion that they're short 25 million ounces of gold as well. And with the latest report from the OCC in hand, I see that their position remains mostly unchanged...maybe down a bit, but nothing material.
I've noted stories over the last few months about Warren Buffet starting to unload his BofA shares, the latest being this Zero Hedge offering from Friday headlined "Warren Buffett's BofA 'Dump-a-Thon' Nears $7 Billion as Questions Swirl as to Why" -- and linked here. If you're a Gregory Mannarino fan, he has always been of the firm belief that BofA will fail at some point.
The short position in SLV now sits at 14.43 million shares as of last short report that came out on two weeks ago...up 9.77 percent from the 13.14 million shares sold short in the prior report. The next short report is due out on Wednesday, September 11.
The situation regarding the Big 4/8 commercial short position in gold and silver remains obscene and grotesquely bearish...silver in particular...but now in the Big 4 [or Big 1&2] in gold for the fifth week in a row.
As Ted had been pointing out ad nauseam, the resolution of the Big 4/8 short positions will be the sole determinant of precious metal prices going forward -- and not a thing has changed over the years in that regard.
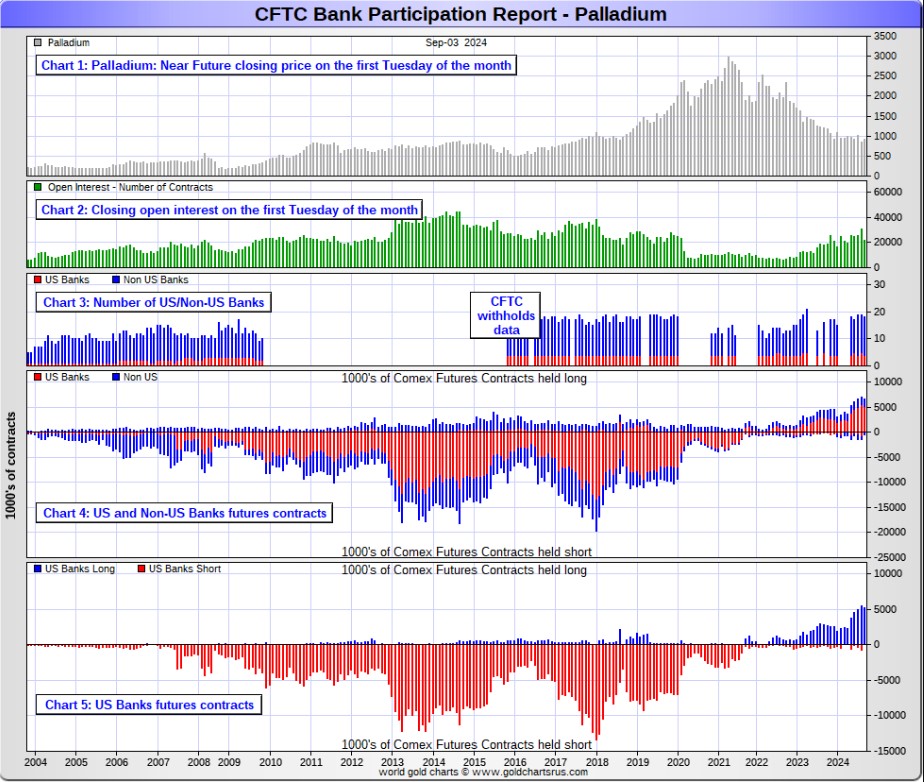
![]()
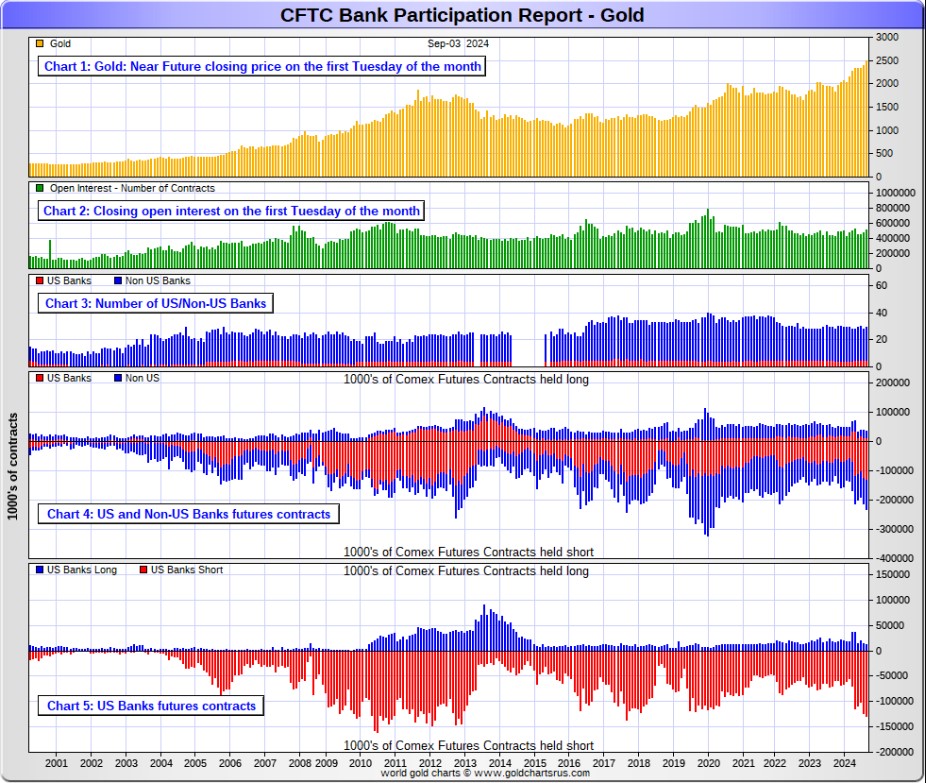
The August Bank Participation Report [BPR] data is extracted directly from yesterday's Commitment of Traders Report data. It shows the number of futures contracts, both long and short, that are held by all the U.S. and non-U.S. banks as of this past Tuesday’s cut-off in all COMEX-traded products.
For this one day a month we get to see what the world’s banks have been up to in the precious metals. They’re usually up to quite a bit -- and they certainly were again this past month.
[The September Bank Participation Report covers the four-week time period from August 6 to September 3 inclusive]
In gold, 5 U.S. banks are net short 116,087 COMEX contracts, up 7,262 contracts from the 108,825 contracts that these same 5 U.S. banks were short in August's BPR. This is the largest short position that the U.S. banks have held since September 2017. It's obscene.
Also in gold, 24 non-U.S. banks are net short 82,594 COMEX contracts, up 15,731 contracts from the 66,863 contracts that 23 non-U.S. banks were short in August's BPR.
At the low back in the August 2018 BPR...these same non-U.S. banks held a net short position in gold of only 1,960 contacts -- so they've been back on the short side in an enormous way ever since.
Although some of the largest U.S. and foreign bullion banks are in the Big 8 short category in gold, some of the hedge fund/commodity trading houses are short even more grotesque amounts of gold than the banks in that category. It's also a strong possibility that the BIS could be short gold in the COMEX futures market as well.
As of September's Bank Participation Report, 29 banks [both U.S. and foreign] are net short 38.9 percent of the entire open interest in gold in the COMEX futures market...up from the 36.6 percent that 28 banks were net short in the August BPR.
Here’s Nick’s BPR chart for gold going back to 2000. Charts #4 and #5 are the key ones here. Note the blow-out in the short positions of the non-U.S. banks [the blue bars in chart #4] when Scotiabank’s COMEX short position was outed by the CFTC in October of 2012. Click to enlarge.
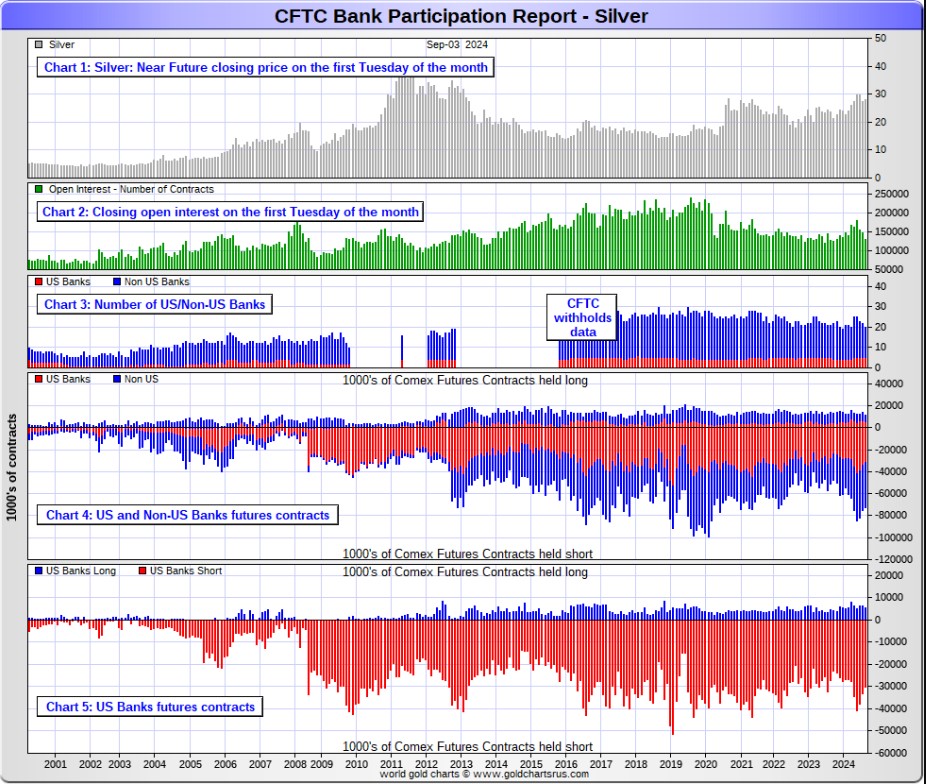
In silver, 5 U.S. banks are net short 24,543 COMEX contracts, down 2,361 contracts from the 26,904 contracts that these same 5 U.S. banks were short in the August BPR. This is the fourth month in a row that these U.S. banks have reduced their short position in silver.
The biggest short holders in silver of the five U.S. banks in total, would be Citigroup, Wells Fargo, Bank of America -- and maybe JPMorgan from time to time.
Also in silver, 15 non-U.S. banks are net short 37,176 COMEX contracts, up 2,913 contracts from the 34,263 contracts that 17 non-U.S. banks were short in the August BPR...their largest short position since June 2021...when they were short 39,562 COMEX contracts.
I would suspect that HSBC, Barclays and Standard Chartered hold by far the lion's share of the short position of these non-U.S. banks...as do some of Canada's banks as well. And, like in gold, the BIS could also be actively shorting silver. The remaining short positions divided up between the other 11 or so non-U.S. banks are immaterial — and have always been so. The same can be said of most of the 24 non-U.S. banks in gold.
As of August's Bank Participation Report, 20 banks [both U.S. and foreign] are net short 47.1 percent of the entire open interest in silver in the COMEX futures market...which is outrageous — up from the 41.4 percent that 22 banks were net short in the August BPR. That increase is mainly due to a big drop in total open interest during the reporting month.
Here’s the BPR chart for silver. Note in Chart #4 the blow-out in the non-U.S. bank short position [blue bars] in October of 2012 when Scotiabank was brought in from the cold. Also note August 2008 when JPMorgan took over the silver short position of Bear Stearns—the red bars. It’s very noticeable in Chart #4—and really stands out like the proverbial sore thumb it is in chart #5. Click to enlarge.
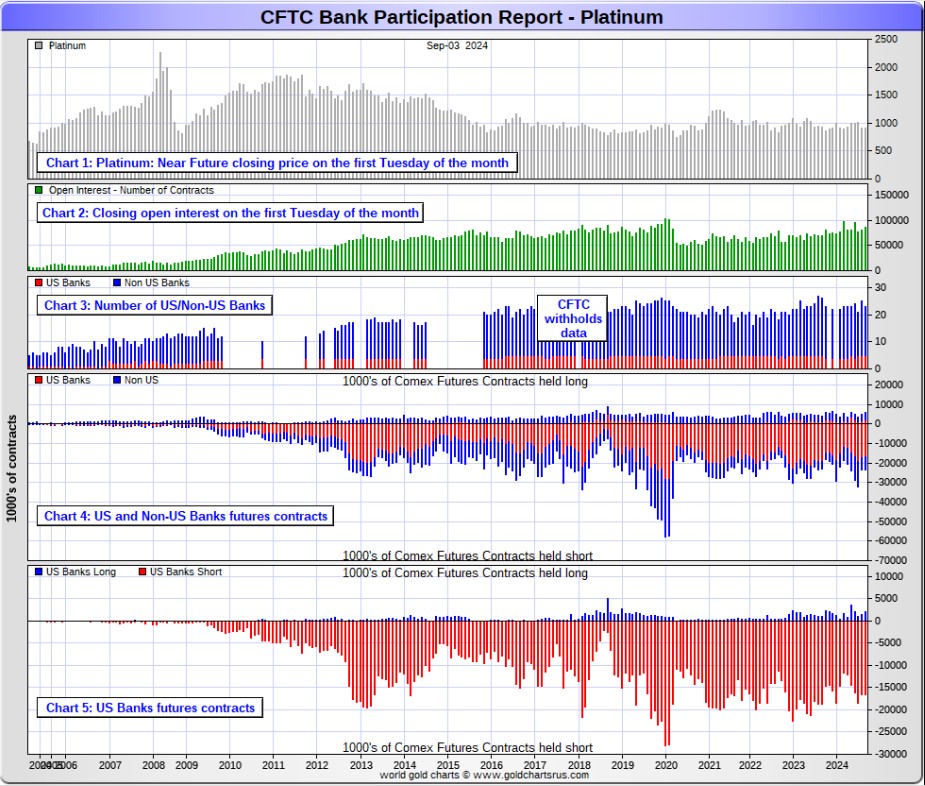
In platinum, 5 U.S. banks are net short 14,395 COMEX contracts in the September BPR, down a mere 747 contracts from the 15,142 contracts that these same 5 U.S. banks were short in the August BPR.
At the 'low' back in September of 2018, these U.S. banks were actually net long the platinum market by 2,573 contracts. So they have a very long way to go just to get back to market neutral in platinum...if they ever intend to, that is. They look permanently stuck on the short side to me, a fact that I point out regularly.
Also in platinum, 18 non-U.S. banks dropped their net short position by 483 contracts...down to 3,093 contracts, from the 3,576 contracts that 20 non-U.S. banks were net short in the August BPR.
Back in the December 2023 BPR, these non-U.S. banks were net short a microscopic 35 platinum contracts...so they've got some work to do if they ever want to get back to that number.
Platinum remains the big commercial shorts No. 2 problem child after silver...but a very distant No. 2 down the list. How it will ultimately be resolved is unknown, but most likely in a paper short squeeze, as the known stocks of platinum are minuscule compared to the size of the short positions held -- and that's just the short positions of the world's banks I'm talking about here.
Of course there's now a structural deficit in it [and palladium] as well.
And as of September's Bank Participation Report, 23 banks [both U.S. and foreign] were net short 20.1 percent of platinum's total open interest in the COMEX futures market, down from the 23.1 percent that 25 banks were net short in August's BPR.
Here's the Bank Participation Report chart for platinum. Click to enlarge.
In palladium, 4 U.S. banks are gross long another new record of 5,200 COMEX contracts in the September BPR, up 476 contracts from the 4,724 contracts that 5 U.S. banks were net long in the August BPR. For the first time that I can remember, the U.S. banks don't hold a single short contract in palladium...that's why I called it a 'gross long' position.
Also in palladium, 14 non-U.S. banks are net long 769 COMEX contracts, down from the 809 contracts that these same 14 non-U.S. banks were net long in the August BPR.
And as I've been commenting on for almost forever, the COMEX futures market in palladium is a market in name only, because it's so illiquid and thinly-traded. Its total open interest in yesterday's COT Report was only 22,098 contracts...compared to 87,185 contracts of total open interest in platinum...130,928 contracts in silver -- and 511,136 COMEX contracts in gold.
But I should point out that open interest in palladium has been on a slow but steady increase over the last few years, because I remember when it was less than 9,000 contracts. So it's nowhere near as illiquid as it used to be.
As I say in this spot every month, the only reason that there's a futures market at all in palladium, is so that the Big 8 commercial traders can control its price. That's all there is, there ain't no more.
As of this Bank Participation Report, 18 banks [both U.S. and foreign] are net long 27.0 percent of the entire COMEX open interest in palladium ...up big from the 17.9 percent of total open interest that 19 banks were net long in the August BPR. The reason that the percentage is up as much as it is, is because of the big decrease in total open interest during the month, which obviously affects the percentage calculation.
For the last 3+ years, the world's banks have not been involved in the palladium market in a material way. And with them still net long, it's all hedge funds and commodity trading houses that are left on the short side. The Big 8 commercial shorts, none of which are banks, are short 46.0 percent of total open interest in palladium as of yesterday's COT Report.
Here’s the palladium BPR chart. Although the world's banks are net long at the moment, it remains to be seen if they return as big short sellers again at some point like they've done in the past. Click to enlarge.
Excluding palladium for obvious reasons, and almost all of the non-U.S. banks in gold, silver and platinum...only a small handful of the world's banks, most likely no more than 5 or so in total -- and mostly U.S.-based...along with the BIS...continue to hold meaningful short positions in the other three precious metals.
As I pointed out above, some of the world's commodity trading houses and hedge funds are also mega net short the four precious metals...far more short than the U.S. banks in some cases. They have the ability to affect prices if they choose to exercise it...which I'm sure they're doing at times. But it's still the collusive bullion banks in the commercial category that are at Ground Zero of the price management scheme.
And as has been the case for years now, the short positions held by the Big 4/8 traders is the only thing that matters...especially the short positions of the Big 4...or maybe only the Big 1 or 2 in both silver and gold. How this is ultimately resolved [as Ted kept pointing out] will be the sole determinant of precious metal prices going forward.
The Big 8 commercial traders continue to have an iron grip on their respective prices -- and it will remain that way until they either relinquish control voluntarily, are told to step aside...or get overrun.
Considering the current state of affairs of the world as it stands today -- and the structural deficit in silver -- and now most likely the other three precious metals as well, the chance that these big bullion banks and commodity trading houses could get overrun at some point, is no longer zero -- and certainly within the realm of possibility if things go totally non-linear, as they just might.
But...as Ted kept reminding us from time to time...if they do finally get overrun, it will be for the very first time...which obviously wasn't allowed to happen this past week, either.
The next Bank Participation Report is due out on Friday, October 4.
I have about an average number of stories, articles and videos for you today.
![]()
CRITICAL READS
August payrolls grew by a less-than-expected 142,000, but unemployment rate ticked down to 4.2%
The U.S. economy created slightly fewer jobs than expected in August, reflecting a slowing labor market while also clearing the way for the Federal Reserve to lower interest rates later this month.
Nonfarm payrolls expanded by 142,000 during the month, up from 89,000 in July and below the 161,000 consensus forecast from Dow Jones, according to a report Friday from the Labor Department’s Bureau of Labor Statistics.
At the same time, the unemployment rate ticked down to 4.2%, as expected.
The labor force expanded by 120,000 for the month, helping push the jobless level down by 0.1 percentage point, though the labor force participation rate held at 62.7%. An alternative measure that includes discouraged workers and those holding part-time jobs for economic reasons edged up to 7.9%, its highest reading since October 2021.
The household survey, which is used to calculate the unemployment rate and is often more volatile than the survey of establishments, showed employment growth of 168,000. The balance, though, tilted toward part-time employment, which increased by 527,000, while full-time fell by 438,000.
Well, dear reader, it's up to you to decide whether you want to believe these numbers or not...but with the U.S. Presidential election two months away...I'm more than skeptical. This news item put in an appearance on the cnbc.com Internet site at 8:30 a.m. on Friday morning EDT -- and I thank Swedish reader Patrik Ekdahl for sending it our way. Another link to it is here. The Zero Hedge spin on this is headlined "June Payrolls Miss But Unemployment Rate Declines, Pulling Back From "Sahm Recession" Trigger as Wages Unexpectedly Rise" -- and linked here.
![]()
'D' for Dis-Equipoise -- Doug Noland
Nvidia sank 12.6% this week. The Semiconductor Index (SOX) slumped 12.2%, with the Nasdaq100 (NDX) down 5.9%. The S&P500 dropped 4.2%. The KBW Bank Index fell 5.5%. The VIX (equities volatility) Index jumped 7.38 to 22.38, the highest close since August 8th (as the index retreated from its August 5th spike). “Stocks Hit by Jobs in Worse Week Since March 2023.”
“Risk off” was global. Japan’s Nikkei 225 Index lost 5.8% this week, South Korea KOSPI 4.9%, Taiwan’s TWSE 3.7%, and China’s CSI 300 2.7%. Major equities indices were down 3.7% in France, 3.2% in Germany, and 3.1% in Italy.
“Stocks Trashed as Job Gains Fall Short of Forecasts.” The SOX sank 4.5% in Friday trading, with the Nasdaq100 down 2.7%. The afternoon chatter on Bloomberg Television questioned what in the jobs report might have justified the equities rout.
It’s a fluid, complex and extraordinary environment, just as we should expect at such a critical juncture for history’s greatest Bubble(s). With the backdrop so confounding, it would be surprising if market pundits, Wall Street strategists and the economic community weren’t befuddled.
Let’s see if the “financial sphere” and “economy sphere” analytical framework can lift the fog a little. Credit and speculative Bubbles have distinct impacts on the two individual but interconnected spheres. And when we contemplate the current backdrop, it is imperative to remind ourselves of the unprecedented Bubble excess experienced over the past five years. There was the $5 TN of QE commenced in pre-Covid September 2019. There were U.S. short-term rates reduced to zero in March 2020 and held below 1% until May 2022, while the Bank of Japan imposed negative rates for eight years - and were close to zero for 24. Government finance Bubble excess included $9 TN of Treasury issuance over five years.
Analysis that disregards the impact of unprecedented debt growth, monetization, market manipulation, and deeply ingrained speculative dynamics will fail to recognize key cycle inflection points. How was virtually everyone blindsided by developments in September 1929?
Doug's always worthwhile weekly commentary appeared on his website around midnight last night -- and another link to it was here. Gregory Mannarino's post market close rant for Friday is linked here -- and this one runs for 39 minutes.
![]()
Can Germany be saved? -- with Professor Jeffrey Sachs, Alexander Mercouris and Alex Christoforou
This 1 hour 34 minute video interview appeared on theduran.com Internet site on Thursday -- and I must admit that I haven't had time to watch it all yet...but will make amends over the weekend. I thank Roy Stephens for sending it our way -- and another link to it is here.
![]()
Embedded in thisZero Hedge article is a 49-minute video interview which included Sachs and American journalist Matt Taibbi.
Below the video is a longish essay by Jeffrey headlined the same as the ZH article..."How the Neocons Subverted Russia’s Financial Stabilization in the Early 1990s".
Both are certainly worth your while if you have the interest -- and another link to the Zero Hedge interview and essay is here.
![]()
Col. (ret.) Lawrence Wilkerson's last positions in government were as Secretary of State Colin Powell's Chief of Staff (2002-05), Associate Director of the State Department's Policy Planning staff under the directorship of Ambassador Richard N. Haass, and member of that staff responsible for East Asia and the Pacific, political-military and legislative affairs (2001-02).
Before serving at the State Department, Wilkerson served 31 years in the U.S. Army. During that time, he was a member of the faculty of the U.S. Naval War College (1987 to 1989), Special Assistant to General Powell when he was Chairman of the Joint Chiefs of Staff (1989-93), and Director and Deputy Director of the U.S. Marine Corps War College at Quantico, Virginia (1993-97). Wilkerson retired in 1997 and began work as an advisor to General Powell. He has also taught national security affairs at the George Washington University.
This 55-minute video interview from Tuesday is another item that had to wait for Saturday's column for both length and content reasons -- and the further along it gets, the more incredible it becomes...especially the Colonel's last comments. It's definitely worth watching -- and another link to it is here.
![]()
On a Highway to Hell -- Scott Ritter
Nuclear weapons offer an illusion of security. By allowing the U.S. nuclear posture to shift from deterrence to employment, there will be a scenario where the U.S. will use nuclear weapons. And then it’s lights out.
Successive U.S. administrations have eschewed arms control in favor of maintaining American strategic advantage over real and/or imagined adversaries.
This is accomplished by embracing nuclear weapons employment strategies that deviate from simple deterrence into war-fighting at every level of conflict, including scenarios that don’t involve a nuclear threat.
At a time when the U.S. advocates policies exacerbating already high levels of tension with nuclear-armed adversaries Russia and China, the Biden administration has signed off on a new nuclear employment plan that increases, rather that decreases, the probability of nuclear conflict.
Left unchecked, this policy can have only one possible outcome — total nuclear annihilation of humanity and the world we live in.
Scott Ritter is a former U.S. Marine Corps intelligence officer who served in the former Soviet Union implementing arms control treaties, in the Persian Gulf during Operation Desert Storm and in Iraq overseeing the disarmament of weapons of mass destruction.
This longish article from this past Sunday had to wait for today's column for content reasons as well. It's certainly worth your while -- and another link to it is here.
![]()
Diamond Prices Crash to Multi-Decade Lows as Art, Wine, & Rolex Markets Sour
The downturn in the diamond market is nothing short of breathtaking. Prices are in free fall as cash-strapped consumers have been shunning luxury goods, grappling with failed Bidenomics that unleashed an inflation storm and resulted in high interest rates. Compounding the issue, the rising demand for lab-grown diamonds has pressured the prices of natural stones.
According to Bloomberg data, citing the Diamond Standard Index, diamond prices have plunged to the lowest on record, with data going back to early 2002. The index has lost 45% of its value since March 2022. Click to enlarge.
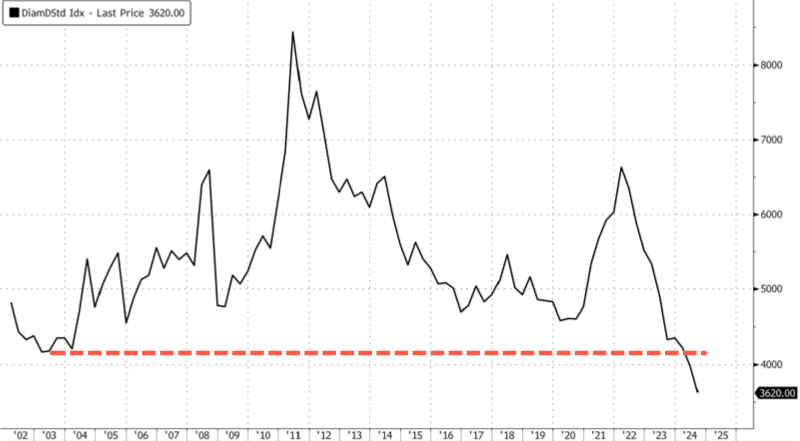
Since diamonds are a consumer-driven market, the fierce bear market in prices signals that the industry is in trouble, as well as signals that low/mid-tier consumers are in trouble.
De Beers, the world's largest diamond producer by value, recorded its worst year in two decades earlier this summer. Its parent company, Anglo American, recently announced plans to divest and spin off its 85% stake in the diamond subsidiary.
[To give you an idea of how lab-grown diamonds have killed the real diamond market, dear reader...there's currently a 3 carat emerald-cut D colour/ internally flawless/cut grade: excellent diamond for sale on eBay for US$212/ CAN$287. On a scale of 1 to 100...with 100 being the best possible quality... this stone is 100. If this was mined stone, it would retail for well north of US$50,000. Even a gemologist would not be able to tell the two apart.]
This interesting story showed up on the Zero Hedge Internet site at 9:05 p.m. EDT on Thursday evening -- and another link to it is here.
![]()
Russia's Finance Ministry plans to allocate 172.9 billion rubles for the purchase of foreign currency/gold under the fiscal rule from September 6 to October 4, with the daily volume of transactions equivalent to 8.2 billion rubles, the ministry said.
This is nearly 7-fold more than the daily volume of 1.12 billion rubles from August 7 to September 5, totaling 24.65 billion rubles.
The Finance Ministry expects windfall oil and gas revenue of 162 billion rubles in September. The deviation of actual oil and gas revenue from the expected monthly volume was 10.9 billion rubles in August.
I posted a story about this in yesterday's column. This isn't the first time during the last year that Russia said they were doing to buy gold for their own account...but didn't in the end...as their reserves have changed little since very early 2020 -- and not one iota since February 2023. As I said in my comments on yesterday's Zero Hedge story about this...we won't know what they did until The Central Bank of the Russian Federation reports their September data on Friday, October 18.
This article was posted on the interfax.com Internet site on Wednesday -- and I thank Roy Stephens for sending it along. Another link to it is here.
![]()
Perth Mint sales subdued as gold hits another record high
The Perth Mint sold 25,884 troy ounces (oz.) of gold and 647,382 oz of silver in minted product form during August 2024.
The Perth Mint’s General Manager Minted Products, Neil Vance, said the market appeared to be stabilising after a few years of sustained demand.
“Conversations with colleagues overseas in the industry reflect what we’re seeing here at The Perth Mint which is a return to the sales volumes we experienced pre-pandemic,” Mr Vance said.
“Mints have always been subject to the ebbs and flows of market demand for precious metals. It was unusual to experience the volume of sales we did for the length of time we did but it does appear we are returning to the market normal we’ve seen in previous years.”
This article put in an appearance on the perthmint.com Internet site on Friday -- and I found it on Sharps Pixley. Another link to it is here.
![]()
QUOTE of the DAY
![]()
The WRAP
"Understand this. Things are now in motion that cannot be undone." -- Gandalf the White
![]()
Today's pop 'blast from the past' is one year shy of being 60 years young -- and one of the earliest theme songs from a movie that was a smash hit on the pop charts. The 25-year old Welsh singer who was "thrilled to pieces" to be asked to perform it..."fainted in the recording booth when singing the song's final note." The movie, the song -- and the singer no need no introduction whatsoever -- and the link is here.
Today's classical 'blast from the past' is my absolute favourite piece of piano music...Sergei Rachmaninoff's Piano Concerto No. 2 in C minor, Op. 18... which he composed between June 1900 and April 1901.
Hailed now as one of the most beloved piano concerto of all time by any composer...British concert pianist Stephen Hough in an article in The Guardian posited that the composition is "his most popular, most often performed and, arguably, the most perfect structurally. It sounds as if it wrote itself, so naturally does the music flow".
And here's the definitive recording of that work on youtube.com...or anywhere else for that matter with 42.96 million views...with Ukraine-born pianist Anna Fedorova performing it to perfection in front of a sold-out house at the Concertgebouw in Amsterdam on 01 September 2013. She's accompanied by the Nordwestdeutsche Philharmonie Orchestra-- and Maestro Martin Panteleev conducts. The link is here.
![]()
As expected, all four precious metals gapped higher as the dollar index plunged on the 8:30 a.m. EDT b.s. jobs report. And also as expected, the Plunge Protection Team/'da boyz' were there in a heartbeat -- and by the time they were done, all four were closed down on the day...along with copper and WTIC. They even managed to close the DXY up on the day by a few basis points as well. These guys are shameless.
It was just another day where the prices of the precious metals weren't allowed to reflect the increasingly perilous financial situations that exist in other markets...the equity markets in particular.
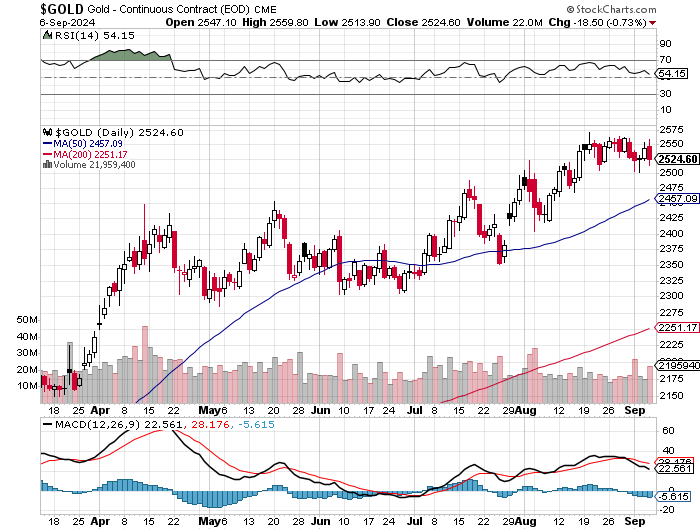
All of Thursday's gain in gold in the December contract, plus a bit more, were gone by the time the COMEX closed yesterday...but despite that, it remains far above any moving average that matters.
At its high tick at 8:30 a.m. in New York, silver blew above its 50-day moving average, but that wasn't allowed to last long -- and it was closed down 92 cents in the December contract. It had an intraday move of $1.46 between its high and low ticks in that month -- and the exact same price range in the spot market.
Platinum was also well up on the day before 'da boyz' appeared -- and over half of its Thursday gain in the October contract had vanished by the time they were through with it.
Palladium's big pre-jobs number gain also disappeared. It was closed down $31 in the spot market...but lower by $38.40 in the December contract...which is its current front month. 'Da boyz' now have it back below any moving average that matters once more -- and by a fair amount.
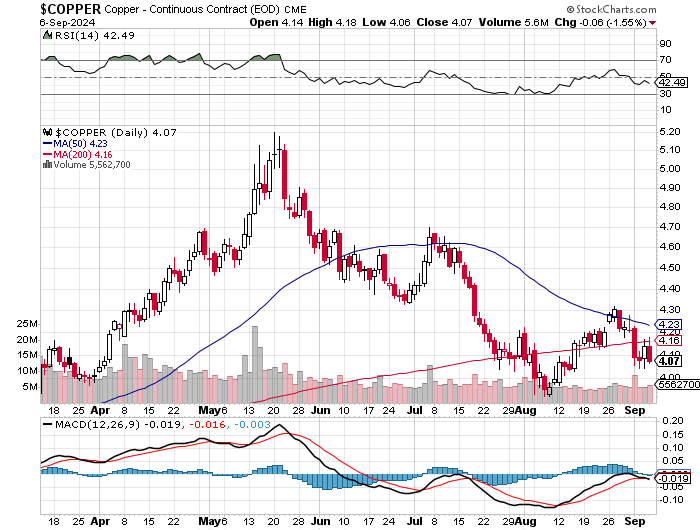
Copper was closed lower by 6 cents, taking back all of Thursday's gain...plus a bit more...although it did spend part of the day trading above its 200-day moving average. It was closed at $4.07/pound -- and also below any moving average that matters.
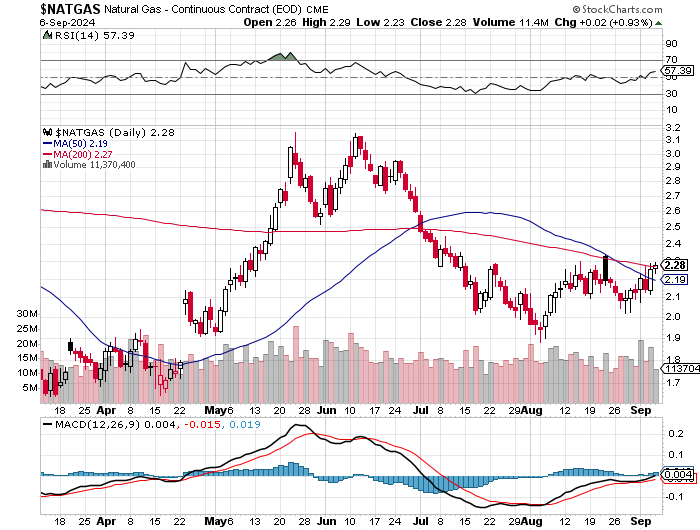
And, for the second day in a row, natural gas [chart included] closed higher... albeit by only 2 cents at $2.28/1,000 cubic feet -- and is now a penny above its 200-day moving average.
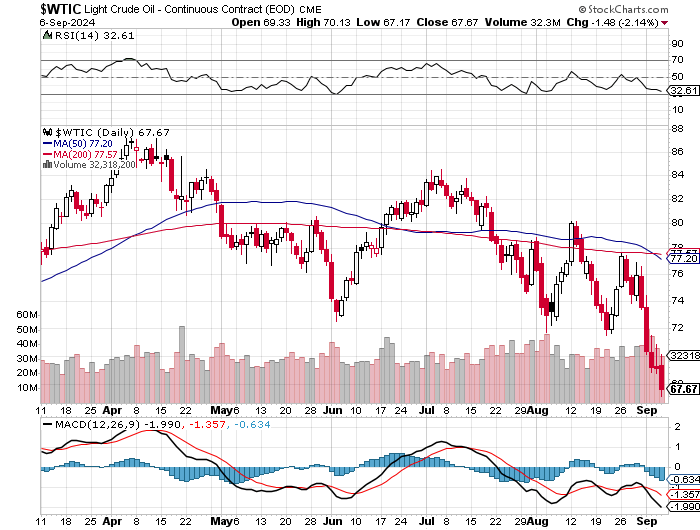
My comment that WTIC had most likely set a bottom after the news on it on Thursday was for naught, as it was closed lower by a further $1.48 on Friday...at $67.67/barrel...its lowest price since very late June of last year. This can't and won't last.
Here are the 6-month charts for the Big 6+1 commodities...courtesy of stockcharts.com as always and, if interested, their COMEX closing prices in their current front months on Friday should be noted. Click to enlarge.
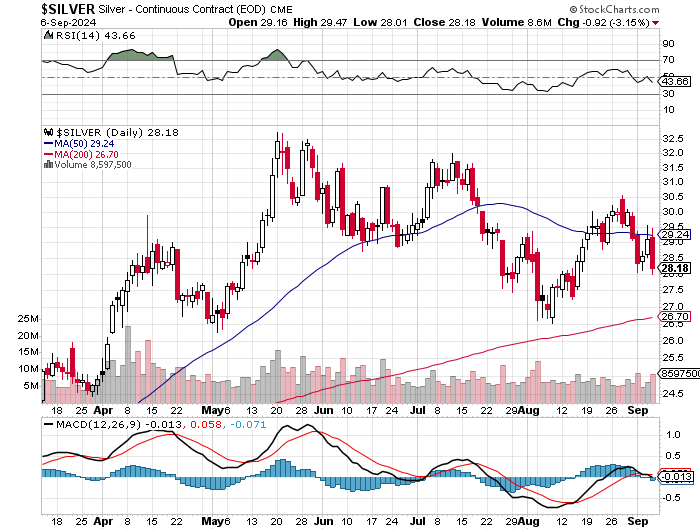
I was certainly happy to see that big drop in the Commercial net short position in silver in Friday's Commitment of Traders Report -- and was the sort of number I was hoping for considering that it was engineered decisively below its 50-day moving average during the reporting week. The drop in the commercial net short position in gold was a bit better than I was expecting.
But after Friday's blatantly obvious engineered price declines, I'm hoping for even more improvements in next Friday's COT Report. However, there are still two more trading days left in the current reporting week -- and anything can happen before the cut-off at the 1:30 p.m. COMEX close on Tuesday.
What I wasn't happy to see, was that the report showed no change in the short position of the collusive Big 4 traders in silver -- and a modest increase in the Big 4 short position in gold...so it's they [most likely now the Big 1 or 2 in that category] that are standing in the way of far higher prices.
And as I pointed out in the Bank Participation Report in gold further up, the short position held by the five U.S. banks involved in this price management scheme is the largest its been since September 2017. That's how desperate they are to prevent its price from reflecting reality.
Friday's COT Report only benefited the equally collusive smaller commercial traders in both silver and gold...the Big '5 through 8' -- and Ted's raptors, the smallest of the commercial traders other than the Big 4. The decreases in their respective short positions accounted for all of the drops in the commercial net short positions in both -- and then some in gold. It was their collusive efforts that caused the price declines we saw in the last reporting week -- as they were the sole beneficiaries...cui bono!
Of course that begs the question as to which of these three groups of collusive commercial traders were behind yesterday's engineered price declines and, barring anything unforeseen, we should know next Friday.
As to whether this is the start of another attempted 'wash, rinse and spin' cycle remains to be seen...because, from a COMEX futures market perspective, it's still a very bearish set-up in both silver and gold.
But if you examine their 6-month charts above, their respective RSI traces are both a very long way from being overbought...silver in particular. So what that means for prices going forward, is hard to tell -- and I'm certainly not going to be sticking my neck out.
But just from a supply/demand perspective...all four precious metals should be trading at multiples of their current prices...especially silver -- and there's only one reason why they're not.
From my vantage point here in Canada, the situation in the U.S. becomes more hopeless with each passing week -- and it grieves me to watch that great Republic slip away. But it was foretold decades ago in G. Edward Griffin's classic tome...The Creature From Jekyll Island -- and it's playing out exactly that way.
However, the psychopaths/sociopaths that inhabit the west's globalist and criminal power elite aren't getting everything their way...as the covid thingy was finally exposed for what it was...however, the debris trail in its wake has endured.
Next on the list of upcoming failures, if you're keeping up with the interviews I've been posting in the Critical Reads section for months now, is that their pet in Kiev is just about done for. The war is lost -- and unless nuclear weapons appear on the scene, Russia will prevail. If those weapons are used, then we're all done for. These western globalists, led by the U.S., appear to be in full retreat on the conflict in Ukraine...their dreams of prevailing over Putin and Mother Russia are in ruins...although one should never underestimate their treachery. I'm not.
That only leaves the situation in the Middle East on the front burner, as the world continues to wait for Iran's military response again Israel. They could be waiting a while, because as I've mentioned in this space twice before... "revenge is a dish best served cold". It's getting too cold for some as laid out in this Zero Hedge story from Friday headlined "U.S. Warns Israel That Carriers Can't Stay Indefinitely" -- and linked here.
But make no mistake about it, the likes of Benjamin Netanyahu and his ilk in Israel are just itching to go to war against Iran...doing all they can to provoke one -- and whatever response Iran delivers will be all the casus belli that they'll need. Neither Iran, nor the U.S. or Israeli militaries wants this war...but that doesn't matter...as what Bibi et al. want, they'll get...even if they have they have to start it themselves at some point. Then heaven help us all. For that reason, the Middle East remains on a hair trigger.
But there's a long 50+ war that the western globalist elite are also in the process of losing -- and being helped along by the BRICS+. That's the one against the precious metals in particular -- and the rest of the commodity complex in general. 'Da boyz' won the paper battle in the COMEX futures market again this week, but it's already preordained that the war in the physical market will be lost at some point....as they will soon run into that supply/demand brick wall in silver -- and in the other precious metals as well.
We're still waiting for that moment, of course...but in the current and deteriorating economic, financial and political environment that exists everywhere on Planet Earth...gold and silver remain the only realistic investment choice, at least as far as I'm concerned.
And it's for those reasons that, as always, I'm still 'all in' -- and will remain so to whatever end.
I'm done for the day -- and the week -- and I'll see you here on Tuesday.
Ed
About the author

SUBSCRIBE: https://edsteergoldsilver.com/

Ed Steer’s Daily Analysis of the Gold and Silver Markets
After eight years of writing about the precious metals for Casey Research, the folks at Stansberry & Associates—who just recently purchased controlling interest in the company—decided that my ‘niche market’ column didn’t fit into their plans.
Since the time that Casey Research was kind enough to offer me a stand-alone column, it became their most highly-rated blog almost from the outset—and has remained that way up to this date...