We are now entering the final part of the endgame of the latest fiat experiment and the actions of the Fed and other Central Banks virtually guarantee that most currencies, including and especially the dollar, will end up totally worthless, just like in the Weimar Republic in Germany in 1923. Needless to say, in such an environment, anything that has real value like gold and silver, will soar in price, and even make intrinsic gains as everyone eventually tries to get aboard the lifeboat.
Now we will turn to the most interesting very long-term chart for silver, which also goes back to 1980 to allow direct comparison with the silver to gold ratio chart above. The first point to note is that the big rally during the 1st half of 2016 stalled out almost exactly at the resistance at the 2008 highs. But by far the most important point to observe is that the unprecedented massive bullmarket that is now incubating HAS NOT EVEN OFFICIALLY STARTED YET, AND WON’T UNTIL SILVER BREAKS ABOVE THE KEY RESISTANCE SHOWN ON THE CHART APPROACHING $21. Until that happens reactions are possible, but once this breakout occurs the entire sector is likely to go ballistic.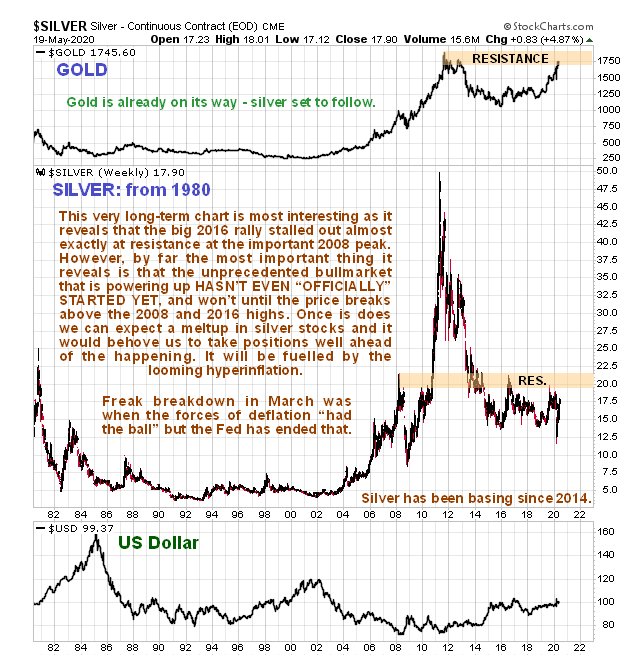
Now we will turn to the 1-year chart for silver to get a feel for what is going on right now. Whilst annotating this chart, I realized that we probably don’t need to panic about getting the silver stocks on board, because the really big action in most of them won’t start until the silver price breaks above the resistance approaching $21 that we looked at on the long-term chart, and on this chart we can see that it first has to contend with a quite strong zone of resistance approaching a line of peaks near to $19. While the current sharp advance looks like it will soon bring it to this resistance, it will arrive there in a very overbought state, which makes it quite likely that it will pause to react / consolidate, and any minor weakness at that juncture would provide us with an opportunity to load up the silver stocks on our list at somewhat better prices.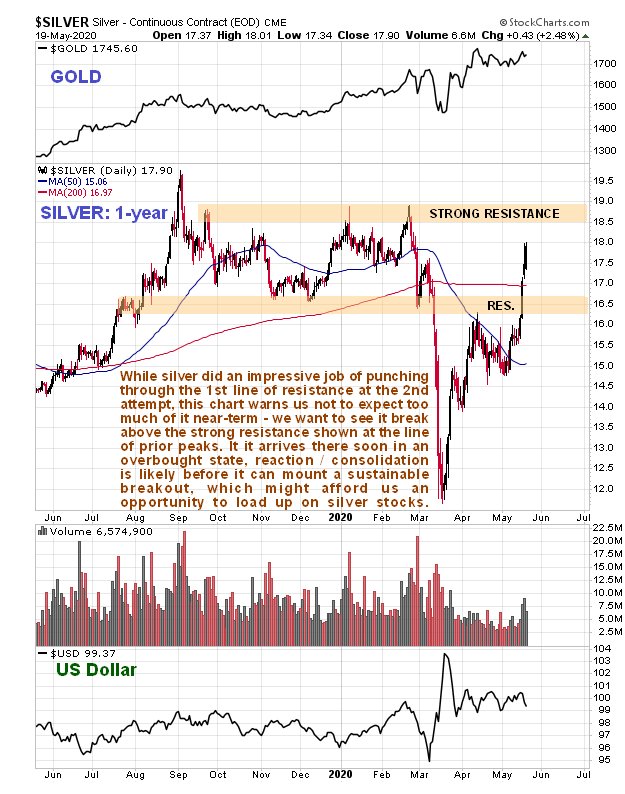
Following this introductory article will be the core article looking at the charts of the better mid and large cap silver stocks that is currently in preparation.
Massive deflationary forces are already ravaging the economy, with the virus scare acting as a catalyst, and already millions have already lost their jobs and millions more will as the economy comes to a screeching halt. In the face of this the Fed and other Central Banks have mobilized to try to head off complete collapse and an implosion of the debt markets leading to an interest rate spike, and also to protect and advance the interests of the super wealthy still further. The Fed’s balance sheet is expanding like a supernova that is starting to explode and it is set to expand at an even more rapid rate, made necessary by a severe decline in productivity and serious disruption of global supply chains. The reason that the virus was dispersed when it was is that governments feared that collapsing economies and widespread unemployment and poverty would lead to revolution, so they needed a way to keep the population under tight control, hence the lockdowns as unemployment in the US and elsewhere skyrockets with the virus as an excuse.
All of this means that both gold and silver are set to soar. As pointed out repeatedly by Egon Von Greyerz, it is not so much that gold and silver are gaining in value, but that currencies are losing value due to them growing in quantity exponentially. Gold and silver, whose value is intrinsic and cannot be destroyed, are simply moving to reflect the destruction in the purchasing power of fiat.
The “writing on the wall” was and is the yawning gap between the price of paper and the price of physical gold and silver. Recently it became huge, and given what is going on this gap was certainly not going to be closed by the price of physical gold and silver dropping – instead it would be closed by the price of paper gold and silver taking off higher, and that is what we have been seeing in recent weeks, as the biggest bullmarket in the Precious Metals sector in history by far gets started. Already, gold has broken out to new highs against most currencies and it is likely to do so before much longer against the dollar, even if a pullback occurs first.
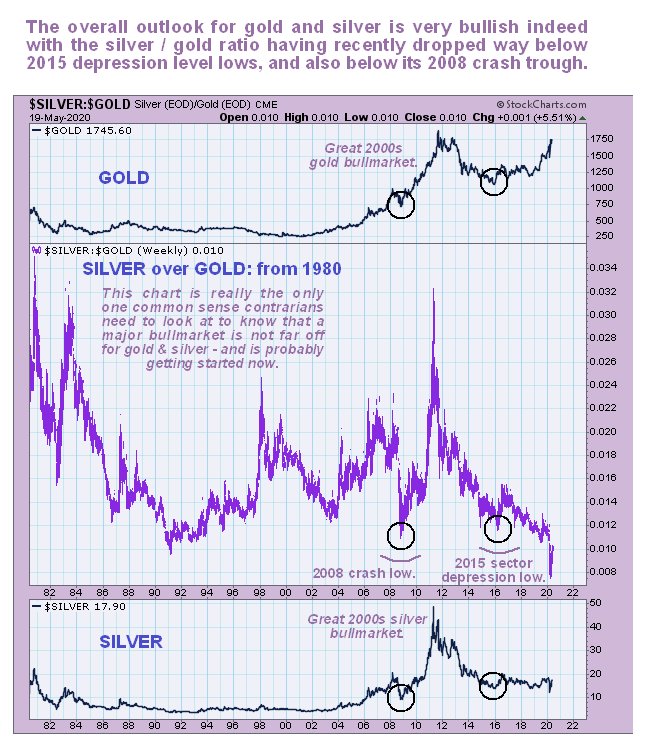
Another factor that we have for a long time now taken as a strong indication of an incubating bullmarket is the silver / gold ratio which recently reached an incredible low extreme as we can see on its long-term chart going back to 1980 below. Most low extremes on this indicator have coincided with sector bottoms, the most notable examples being at the 2008 crash low and 2015 – 2016 sector depression low, which were followed by major sector uptrends. Recently this ratio fell to a freak low which was a sure sign that the sector had hit bottom. Now it is recovering as silver at last starts to join the party. Gold has been rising for some time and is now starting to challenge its dollar highs and it has opened up a huge divergence with silver that will be resolved by a roaring bullmarket in silver.
Now we will turn to the most interesting very long-term chart for silver, which also goes back to 1980 to allow direct comparison with the silver to gold ratio chart above. The first point to note is that the big rally during the 1st half of 2016 stalled out almost exactly at the resistance at the 2008 highs. But by far the most important point to observe is that the unprecedented massive bullmarket that is now incubating HAS NOT EVEN OFFICIALLY STARTED YET, AND WON’T UNTIL SILVER BREAKS ABOVE THE KEY RESISTANCE SHOWN ON THE CHART APPROACHING $21. Until that happens reactions are possible, but once this breakout occurs the entire sector is likely to go ballistic.
Now we will turn to the 1-year chart for silver to get a feel for what is going on right now. Whilst annotating this chart, I realized that we probably don’t need to panic about getting the silver stocks on board, because the really big action in most of them won’t start until the silver price breaks above the resistance approaching $21 that we looked at on the long-term chart, and on this chart we can see that it first has to contend with a quite strong zone of resistance approaching a line of peaks near to $19. While the current sharp advance looks like it will soon bring it to this resistance, it will arrive there in a very overbought state, which makes it quite likely that it will pause to react / consolidate, and any minor weakness at that juncture would provide us with an opportunity to load up the silver stocks on our list at somewhat better prices.
Following this introductory article will be the core article looking at the charts of the better mid and large cap silver stocks that is currently in preparation.
About the author