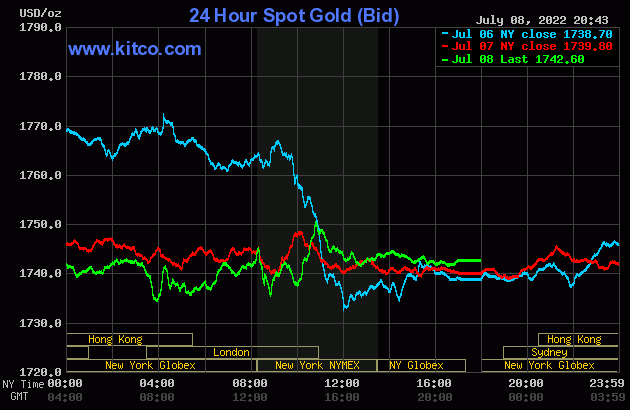
The gold price was forced to trade in a very tight range everywhere on Planet Earth on Friday -- and its rally that began around 8:50 a.m. in COMEX trading in New York, was capped around 10:45 a.m. EDT. It was sold lower for the next two hours -- and then didn't do much after that.
The low and high ticks in gold were recorded by the CME Group as $1,725.00 and $1,751.70 in the August contract. The August/October price spread differential in gold at the close in New York yesterday was $8.60 -- and October/December was $10.70 an ounce.
Gold was closed in New York on Friday afternoon at $1,742.60 spot, up $2.30 from Thursday. Net volume was on the lighter side at just under 133,500 contracts -- and there was a bit over 73,000 contracts worth of roll-over/switch volume out of August and into future months, with almost all going into October and December...mostly the latter month.
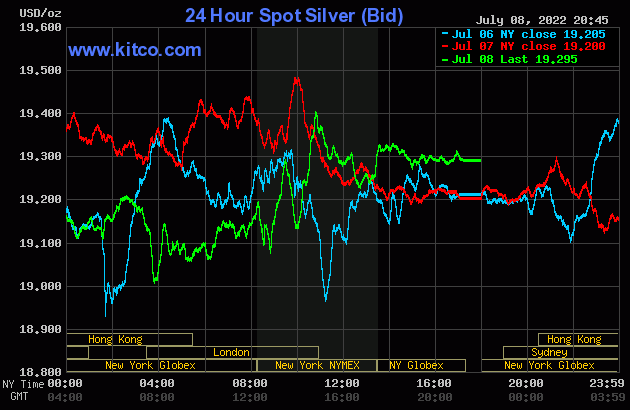
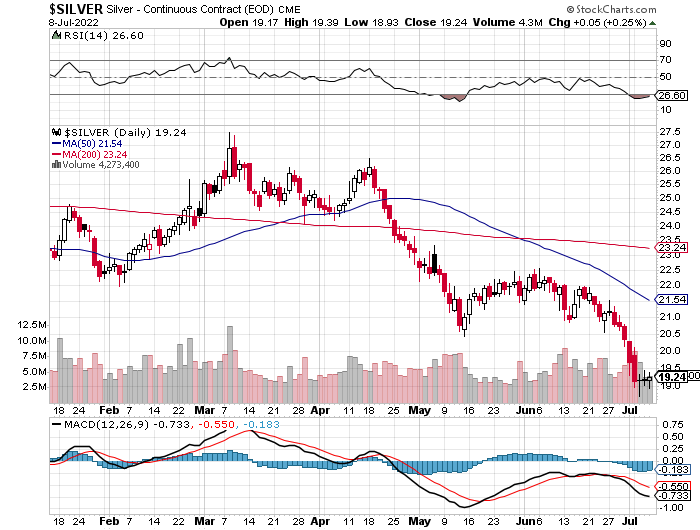
The silver price rallied a bit until around 9:15 a.m. China Standard Time in GLOBEX trading on their Friday morning -- and it was then stair-stepped lower to its low tick of the day, which came minutes before 9 a.m. in London...gold's low tick as well. It chopped higher from there -- and obviously on a very short leash, until its high tick, like gold's, was also set at 10:45 a.m. in COMEX trading in New York. It was hauled lower from there until about noon EDT -- and it then proceeded to chop/wander quietly sideways until the market closed at 5:00 p.m.
The low and high ticks in silver were reported as $18.935 and $19.39 in the September contract. The July/September price spread differential in silver at the close in New York on Friday afternoon was 6.9 cents -- and September/December was 16.9 cents an ounce.
Silver was closed on Friday afternoon in New York at $19.295 spot, up 9.5 cents from Thursday. Net volume was nothing special at 41,000 contracts -- and there was just about 2,700 contracts worth of roll-over/switch volume in this precious metal...mostly into December.
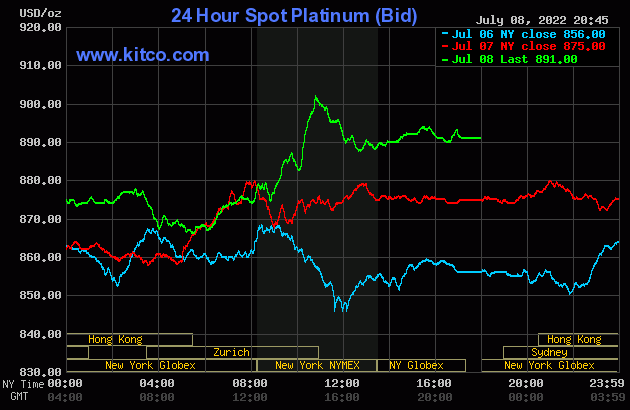
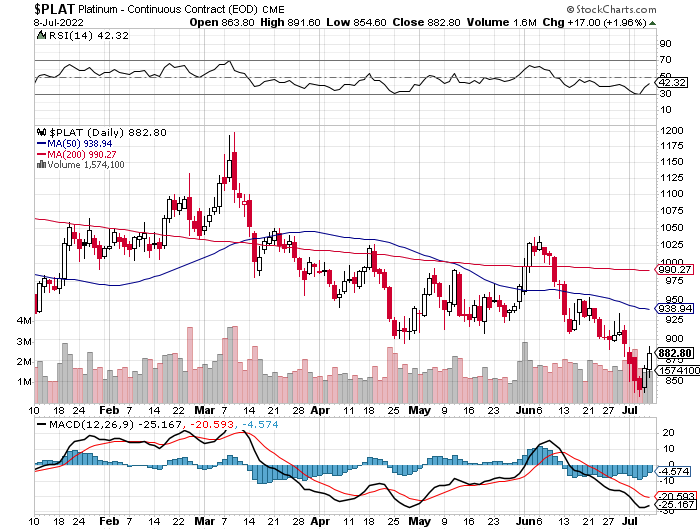
The platinum price wandered sideways to a bit higher in GLOBEX trading on Friday in the Far East, but ran into 'something' about fifteen minutes after the Zurich open. It was sold a bit lower until 10 a.m. CEST...traded flat until 11 a.m. CEST -- and then began a rally of some size. That one ran into 'something' around 8:50 a.m. in COMEX trading in New York -- and it was sold lower until around 12:40 p.m. EDT. It then managed to crawl a few dollars higher until the market closed at 5:00 p.m. Platinum was closed at $891 spot, up 16 bucks from Thursday.
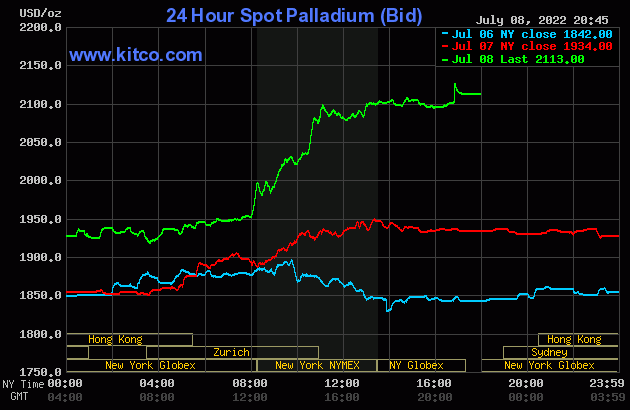
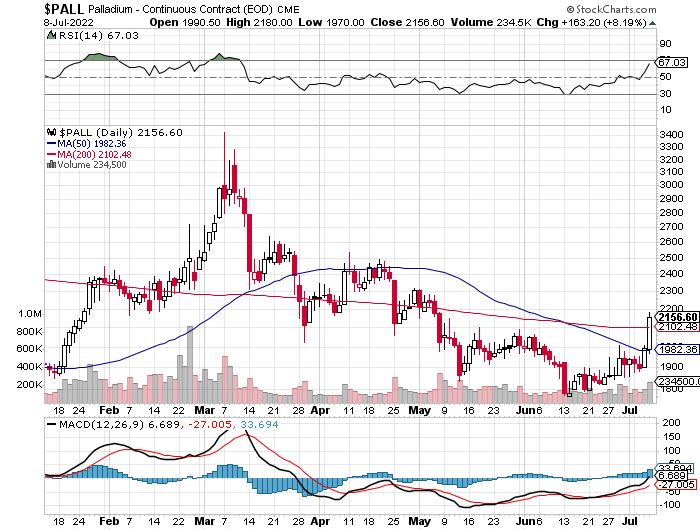
Palladium had a very quiet down/up move -- and was up about 20 bucks by 2 p.m. in GLOBEX trading in Zurich. It exploded higher in price from there -- and that lasted until a very few minutes after the 11 a.m. EDT Zurich close. It wandered very quietly sideways from that point until the price went vertical about ten minutes before the 5:00 p.m. EDT New York close. But a short seller of last resort was Johnny-on-the-spot -- and drove it a bit lower until trading ended. Palladium finished the Friday session in New York at $2,113 spot, up 179 dollars on the day.
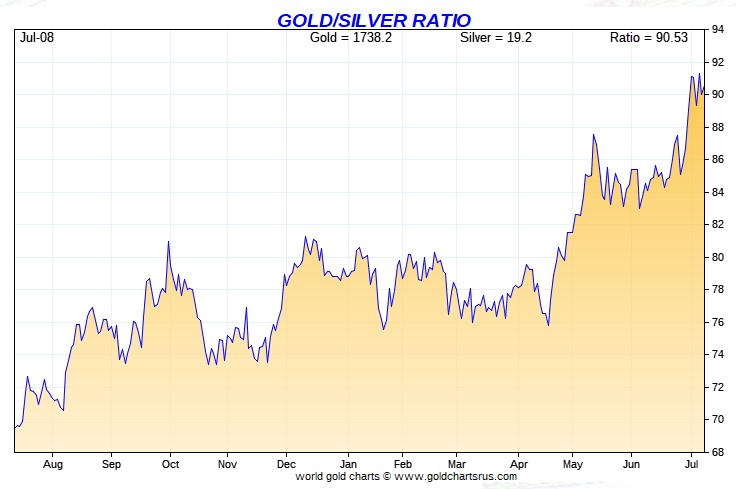
Based on the kitco.com spot closing prices in silver and gold posted above, the gold/silver ratio worked out to 90.3 to 1 on Friday...compared to 90.6 to 1 on Thursday.
Here's Nick's 1-year Gold/Silver Ratio Chart, updated with the last five days worth of data. Click to enlarge.
![]()
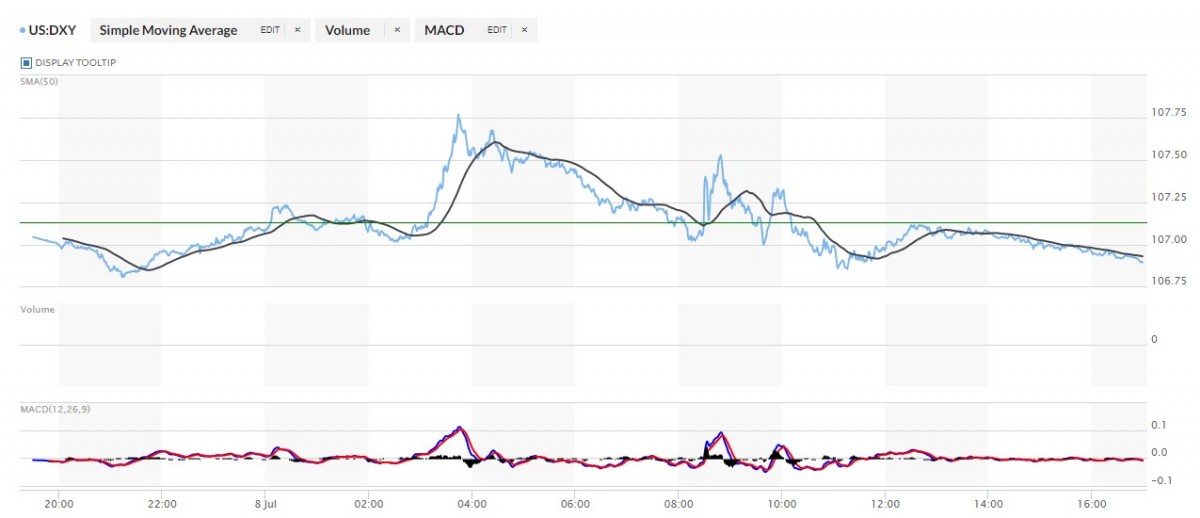
The dollar index closed very late on Thursday afternoon in New York at 107.13 -- and then opened lower by 9 basis points once trading commenced at 7:45 p.m. EDT on Thursday evening, which was 7:45 a.m. China Standard Time on their Friday morning. It crawled down to its low tick of the day, which came at 9:13 a.m. CST -- and its ensuing rally ended around 12:25 p.m. CST. It then wandered a bit lower until 2:33 p.m. CST -- and began to head a bit higher from there. But a far more substantial 'rally' began eight minutes after the London open -- and the DXY's high tick was printed at 8:44 a.m. BST. It wandered quietly lower from there, before jumping around a lot in morning trading in New York -- and its quiet decline resumed around 12:30 p.m. EDT. That continued until the market closed at 5:00 p.m.
The dollar index finished the Friday trading session in New York at 106.90...down 23 basis points from its close on Thursday.
Here's the DXY chart for Friday, thanks to marketwatch.com as usual. Click to enlarge.
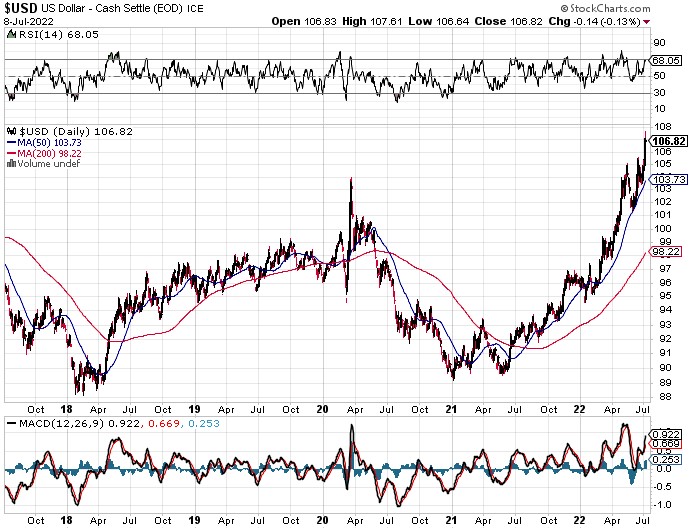
And here's the 5-year U.S. dollar index chart that appears in this spot every Saturday, courtesy of stockcharts.com as always. The delta between its close...106.82...and the close on the DXY chart above, was 8 basis points below its spot close yesterday. Click to enlarge.
One could say that there was some correlation between gold and silver prices during part of the morning COMEX trading session in New York. But the moment that the dollar index turned a bit higher around 10:50 a.m. EDT, 'da boyz' were there to take the gold and silver prices down a bit.
U.S. 10-Year Treasury: 3.1010%...up 0.0930 (+3.09%)...as of 02:59 p.m. EDT
Here's the 5-year 10-year U.S. Treasury chart from the yahoo.com Internet site -- and it puts the yield curve into a somewhat longer-term perspective. Click to enlarge.
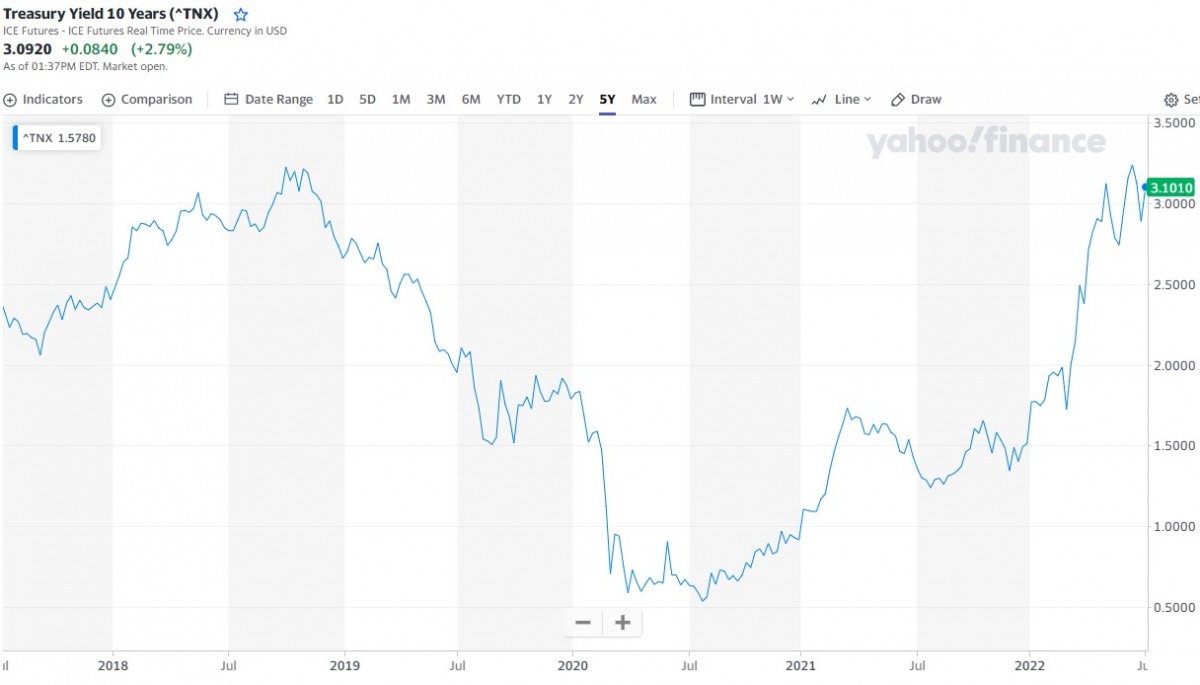
Only interventions on a massive scale by the world's central banks, led by the U.S. Fed, has prevented a melt-down in the debt market. As I said in this spot last week, this is terra incognita -- and all we can do is watch and wait and see what this hatches into as the weeks and months unfold. Nobody [in their right mind] would be buying fixed income paper in the inflationary environment that we're in today...unless their objective was to control interest rates.
![]()
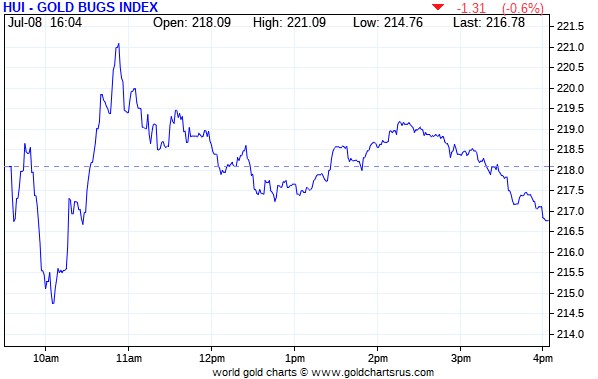
The gold shares followed the gold price almost like a shadow yesterday -- and despite gold's slightly positive close, its associated shares couldn't manage the same feat, as the HUI closed down 0.60 percent.
Computed manually, Nick Laird's Intraday Silver Sentiment/Silver 7 Index closed lower by 1.27 percent. Peñoles didn't traded yesterday, so the index was computed based on the six silver stocks that did.
Here's Nick's 3-year Silver Sentiment/Silver 7 Index chart that appears in every Saturday column, updated with Friday's candle. Click to enlarge.
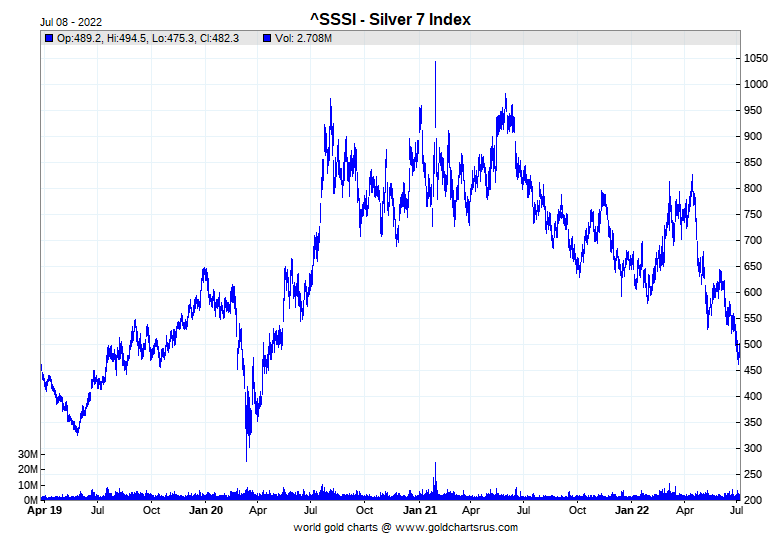
The 'star' yesterday was SSR Mining, the only one that closed higher on the day, as it finished the day up 0.73 percent. The two dogs were Coeur and Hecla Mining, closing lower by 3.42 and 2.67 percent respectively.
The latest silver eye candy from the reddit.com/Wallstreetsilver crowd is linked here.
![]()
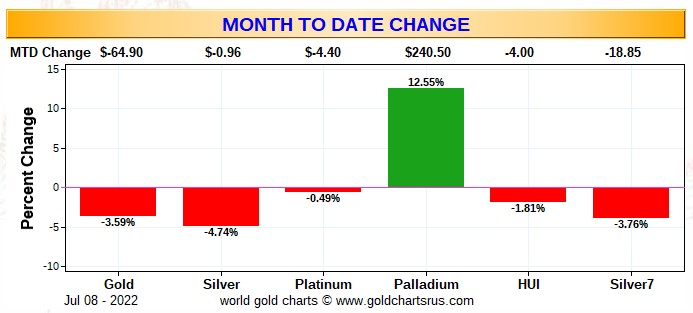
Here are two of the usual three charts that show up in every weekend missive. They show the changes in gold, silver, platinum and palladium in both percent and dollar and cents terms, as of their Friday closes in New York — along with the changes in the HUI and the Silver 7 Index.
There's no weekly chart, as Monday was the Independence Day holiday in the U.S. -- and the way Nick's program is set up, it would include the last five days of trading, which would include the previous Friday's data. The weekly chart will be back in this spot in next Saturday's column.
Here's the month-to-date chart, which is only five U.S. trading days long. The stand-out feature is palladium's big gains over the last two days -- and although both gold and silver are down month-to-date, the shares are outperforming their underlying precious metals because of the bottom fishing that's been going on this week.
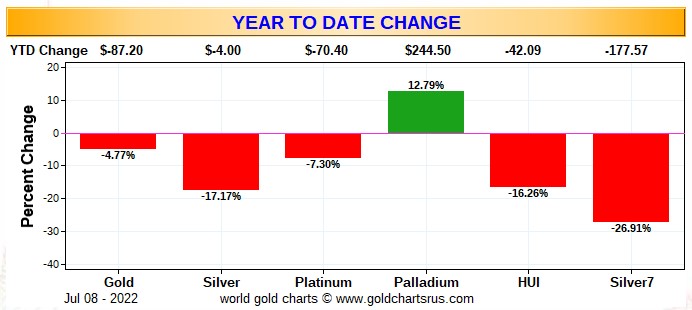
Here's the year-to-date chart -- and it's butt-ass ugly as always. But as I said in this space last week, it's my opinion that there's been a very quiet and stealthy accumulation of silver equities going on in the deep background for quite some time -- and that fact is only obvious when looking at a longer-term chart such as this one. Yes, the silver shares are down far more than their golden cousins, but relative to their underlying precious metals, the silver stocks are doing better. Click to enlarge.
Of course, as I always say at this point, what happens going forward continues to be in the hands of the commercial traders of whatever stripe, as they alone...as you know all too well, either directly or indirectly control the prices of everything precious metals-related...until they don't.
![]()
The CME Daily Delivery Report for Day 7 of July deliveries showed that another 460 gold, plus 45 silver contracts were posted for delivery within the COMEX-approved depositories on Tuesday.
In gold, of the four short/issuers in total, the only two that mattered were JPMorgan and Australia's Macquarie Futures, as they issued 296 and 150 contracts out of their respective client accounts. There were seven long/stoppers, with the largest being JPMorgan of course, as they picked up 305 contracts for their client account. The other two big long/stoppers were British bank HSBC and Citigroup. The former stopped 97 contracts for their house account -- and the latter picked up 44 contracts for clients.
In silver, the only short/issuer that mattered there was JPMorgan, issuing 42 contract out of its client account. The two long/stoppers were ADM and the CME Group, with the former picking up 33 contracts for their client account -- and the latter stopping 12 contracts for their own account.
They immediately reissued those 12 contracts as 5x12=60 of those one-thousand ounce good delivery bar micro silver futures contracts. The three long/stoppers for them were Advantage, ADM and Morgan Stanley, as they picked up 31, 19 and 10 contracts for their respective client accounts.
The link to yesterday's Issuers and Stoppers Report is here.
So far in July there have been 3,962 gold contracts issued/reissued and stopped -- and that number in silver is only 2,682 COMEX contracts. In platinum, there have been 1,988 contracts issued and stopped -- and nothing in palladium.
And as I pointed out in this space yesterday, even though July is a scheduled delivery month in silver, deliveries in gold have already far exceeded those in silver.
The CME Preliminary Report for the Friday trading session showed that gold open interest in July fell by 870 COMEX contracts, leaving 970 contracts still open, minus the 460 contracts mentioned a few paragraphs ago. [That decline in gold open interest would mostly be delivery-related, I'm sure.] Thursday's Daily Delivery Report showed that 1,232 gold contracts were actually posted for delivery on Monday, so that means that another 1,232-870=362 more gold contracts were added to July deliveries. Silver o.i. in July declined by 16 contracts, leaving 333 still around, minus the 45 contracts mentioned a few paragraphs ago. Thursday's Daily Delivery Report showed that 49 silver contracts were actually posted for delivery today, so that means that 49-16=33 more silver contracts were added to the July delivery month.
Total gold open interest at the close on Friday rose by 5,654 COMEX contracts -- and total silver o.i. increased by 1,771 contracts...with both numbers subject to some revision by the time the final figures are posted on the CME's website on Monday morning CDT.
![]()
There was a small reduction in GLD yesterday, as an authorized participant removed 27,287 troy ounces of gold...but 10,403 troy ounces of gold was added to GLDM. And there was another hefty withdrawal from SLV yesterday, as an a.p. took out 3,965,813 troy ounces of silver.
During the last four business days, there has been 22,980,267 troy ounces of silver removed from SLV. And whether that represents 'plain vanilla' liquidation, silver urgently needed elsewhere for industrial consumption, or conversion of SLV shares for physical silver is above my pay grade...although I expect Ted will certainly have something to say about this in his weekly review for his paying subscribers this afternoon.
In other gold and silver ETFs and mutual funds on Planet Earth on Friday, net of any changes in COMEX, GLD, GLDM & SLV inventories, there was a net 61,612 troy ounces of gold taken out, but a net 217,028 troy ounces of silver was added.
The U.S. Mint finally had a sales report for July. The sold 17,000 troy ounces of gold eagles -- 9,000 one-ounce 24K gold buffaloes -- 14,000 one-ounce platinum eagles -- and zero silver eagles.
The mint has stated that their silver eagles sales are down because they can't get enough blanks from their suppliers, as the mint doesn't make their own. I can tell you right now that story is a total red herring...pure bulls hit.
As Ted has stated for a very long time now, they're not making them for the sole reason that they don't want to exacerbate the critically short supply of wholesale good delivery bars.
![]()
There was pretty monstrous activity in gold over at the COMEX-approved depositories on the U.S. east coast on Thursday -- and all of it was of the 'out' variety...257,061 troy ounces in total.
The largest amount by far was the 178,052.230 troy ounces/5,538 kilobars that departed Brink's, Inc...followed by the 64,302.000 troy ounces/2,000 kilobars that left Loomis International. The remaining 6,284 and 385.812 troy ounces/12 kilobars were shipped out of Manfra, Tordella & Brookes, Inc. and the International Depository Services of Delaware respectively.
There was some paper activity as well, as 48,226.500 troy ounces/1,500 kilobars was transferred from the Registered category and back into Eligible over at Brink's, Inc.
The link to Thursday's COMEX gold activity is here.
There was very decent activity in silver as well. There was 1,131,503 troy ounces received -- and 103,753 troy ounces shipped out.
In the 'in' category, the largest truckload...601,521 troy ounces...was dropped off at CNT -- and the other rather smallish truckload...529,982 troy ounces...arrived at JPMorgan.
In the 'out' category, there was 99,753 and 4,000 troy ounces shipped out of Brink's, Inc. and Delaware respectively.
There was some paper activity, as one truckload....600,614 troy ounces...was transferred from the Registered category and back into Eligible over at JPMorgan.
The link to all of Thursday's COMEX silver activity is here.
There wasn't much activity over at the COMEX-approved gold kilobar depositories in Hong Kong on their Thursday. Nothing was reported received -- and only 265 kilobars were shipped out....135 from Brink's, Inc. -- and the remaining 130 from Loomis International. The link to that, in troy ounces, is here.
![]()
Here are the usual 20-year charts that show up in this space in every Saturday column. They show the total amount of physical gold and silver held in all know depositories, ETFs and mutual funds as of the close of business on Friday.
During the week just past, there was a net 1,131,000 troy ounces of gold removed -- and a net 20,278,000 troy ounces of silver was taken out as well. Click to enlarge.
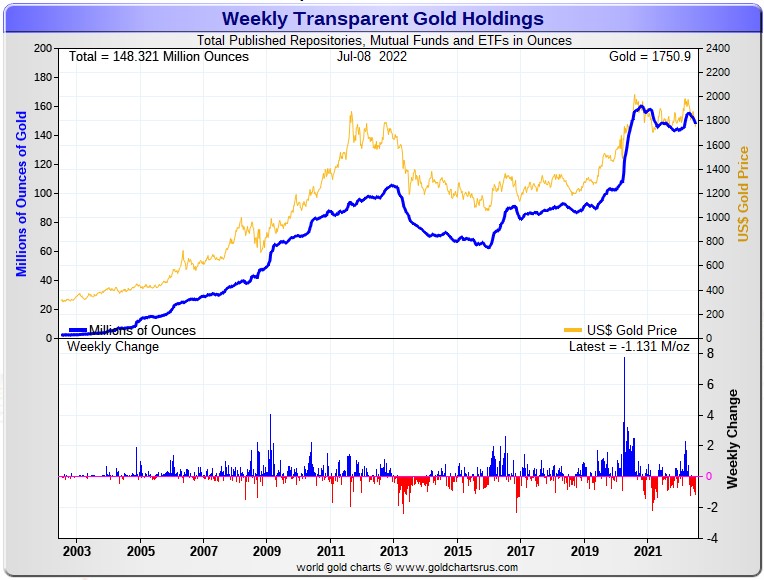
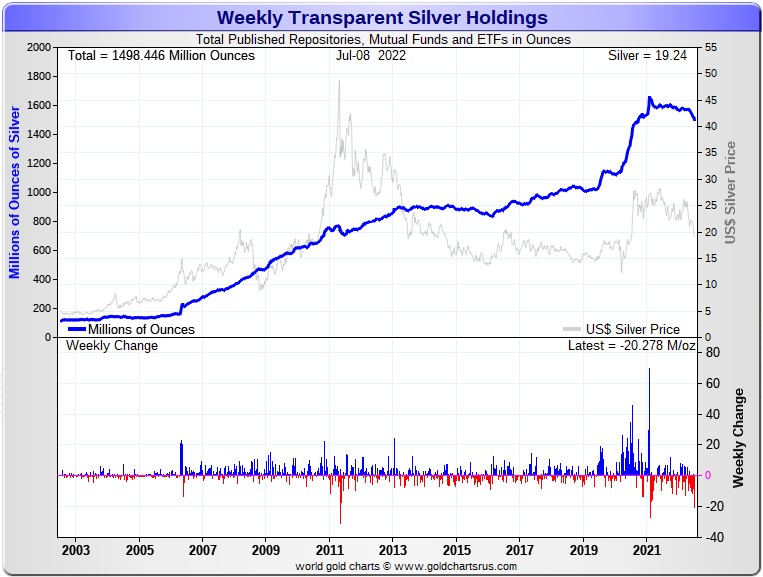
In gold, the withdrawals were mostly COMEX and GLD related. The decrease in silver was all from SLV, but a several million troy ounces of silver was added to COMEX warehouses during the week...plus some into the rest of the world's ETFs and mutual funds.
The physical shortage in silver on the wholesale level continues -- and one has to wonder just how much of these silver withdrawals we've witnessed this past week are industrial user-related...or conversion of shares for physical metal. Retail silver demand certainly isn't what it used to be, but it hasn't dried up entirely, either.
Delivery times from the various sovereign and private mints continues to be many weeks for some forms of retail silver -- and that fact is probably not going to change anytime soon. So when the next serious silver rally is allowed to begin...it won't be long before dealers get cleaned out again -- and shortages reappear.
But the real shortages will be in the wholesale good delivery bar market when the serious money starts flowing into the various and sundry, depositories, ETFs and mutual funds. Where all those good delivery bars are doing to come from when this begins to happen, is unknown.
However, when you look at these charts with some sort of perspective -- and considering how far that both silver and gold have been engineered lower from their highs of earlier this year, the withdrawals have been relatively minor. Almost all of the two precious metals in these funds are held by the strongest of hands -- and I'm sure that applies to every troy ounce that has been withdrawn from them as well.
![]()
The Commitment of Traders Report, for positions held at the close of COMEX trading on Tuesday, showed the expected big decreases in the commercial net short positions in both silver and gold.
The improvement in gold wasn't quite as big as I was hoping for, but it was for the same reason as last week -- and that was ferocious long buying by the Other Reportables in the Non-commercial category for the second week in a row...which I'll get into a bit further down.
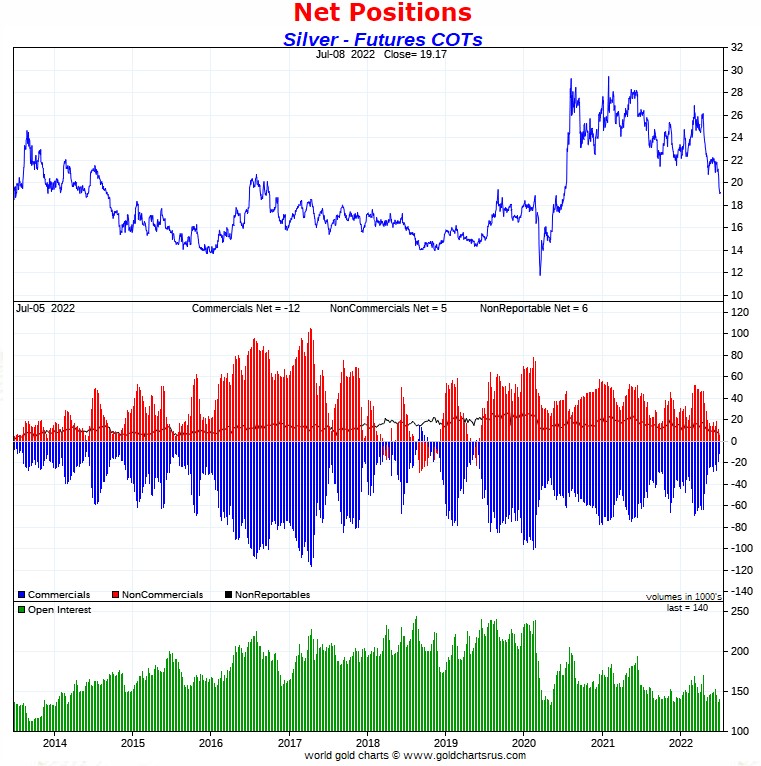
In silver, the Commercial net short position declined by a further 6,863 COMEX contracts, or 34.3 million troy ounces.
They arrived at that number by increasing their gross long position by 731 COMEX contracts -- and decreased their gross short position by 6,132 contracts. It's the sum of those two numbers that represents their change for the reporting week.
Under the hood in the Disaggregated COT Report, it was all Managed Money traders, plus a bunch more, as they sold 9,490 contracts in aggregate...1,717 longs, plus 7,773 short contracts -- and they are now net short silver by 8,745 COMEX contracts. The Nonreportable/small traders were also sellers, reducing their net long position to the tune of 1,111 contracts. On the other hand, the Other Reportables were big buyers, as they increased their net long position by 3,738 contracts.
Doing the math: 9,490 plus 1,111 minus 3,738 equals 6,863 COMEX contracts, the change in the Commercial net short position.
The Commercial net short position in silver now sits at only 58.1 million troy ounces...down 34.3 million troy ounces from the 92.4 million troy ounces that they were short in last Friday's COT Report...which is obviously the headline number change mentioned further up.
The Big 8 [which has two Managed Money traders in it] are short 325.2 million troy ounces in this week's COT Report, down 21 million troy ounces from the 346.2 million troy ounces they were short in last Friday's COT Report.
The Big 8 short position is not a pure commercial trader number because Ted says that there are two Managed Money traders in the Big 8 short category....one in the Big 4 -- and the other in the Big '5 through 8' category.
Ted's back-of-the-envelope calculation says that the Big 8's true short position, net of the Managed Money traders that are in it, is closer to 250 million troy ounces. Big difference.
Ted and I discussed what his raptors...the 29 small commercial traders other than the Big 8...did during the reporting week -- and it's just impossible to tell. But using the past as prologue would suggest that their long position is a bit north of 200 million troy ounces...a monstrous number -- and most likely a tad higher than that since the Tuesday cut-off.
Always remember that despite their small size, Ted's raptors are still commercial traders in the commercial category.
Here's the 9-year COT chart for silver that puts thing in a longer-term perspective...courtesy of Nick Laird as always -- and this week's change should be noted. Click to enlarge.
Ted silver 'whale' in the Swap Dealer category remained unchanged at around 13,000 contracts.
And while on the subject of the Swap Dealers in the commercial category, they're net long silver by about 7,500 contracts at the moment, up from the 6,000 contract net long position they held in last week's COT Report. The Producer/Merchants and bullion banks in the commercial category are net short 19,000 contracts, down about 5,500 contracts from last week. Ted says that this is the lowest number that he's seen in this category for many, many a moon.
The net long position of the Nonreportable/small traders, as of this week's COT Report stands at only 6,483 COMEX contracts...down 1,100 contracts from last week. You'd have to go back at least five years to see a number that small. Ted says that this is always a very bullish indicator as well.
And as far as the commercial net short position is concerned, one would have to go back to about May 2019 to see a commercial net short position as small as it is now.
For the second week in a row, the Big 4 shorts in the Producer/Merchant category were very aggressive in covering their short positions -- and most likely covered even more on silver's intraday price spike lower on Wednesday, the day after the cut-off.
Ted pointed out on the phone yesterday that the gross short position of the Managed Money traders is now much larger than the gross short positions of either the Producer/Merchant or Swap/Dealers in the Commercial category. This is particularly true of the Producer/Merchant category, as the Managed Money traders hold a gross short position of 46,067 COMEX contracts vs. 28,082 contracts held by the former.
Ted was toying with the idea that there might now be two Managed Money traders in the Big '5 through 8' short category after this week's price action -- and I know that he wants to give more thought to this overnight. And not to be forgotten is that one Managed Money trader that currently inhabits the Big 4 short category.
I've run out of adjectives to describe just how off-the-charts bullish the current set-up is in the COMEX futures market for silver.
![]()
In gold, the commercial net short position fell by 16,422 COMEX contracts, or 1.64 million troy ounces of the stuff -- and as I mentioned at the top of today's COT discussion that I was expecting a bigger number...which I'll get into in just a bit.
They arrived at that number by increasing their gross long position by 1,251 COMEX contracts -- and reduced their gross short position by 15,171 contracts. It's the sum of those two numbers that represents their change for the reporting week.
Under the hood in the Disaggregated COT Report is the explanation as to why the commercial net short position didn't fall further.
Yes, the Managed Money traders were big sellers...7,378 longs, plus 11,690 short contracts...for a total of 19,068 COMEX contracts. The Nonreportable/small traders were big sellers as well, reducing their net long position by 4,389 COMEX contracts. But -- and for the second week in a row, the traders in the Other Reportables category were very aggressive buyers, as they increased their net long position by a hefty 7,035 COMEX contracts...thus denying the commercial traders of that many contracts that they could have bought to cover their short positions.
Of course one has to ask why these Other Reportables/Non-Commercial traders would be buying hand over fist, while the other two categories were selling with abandon. What do they know that other don't?
Doing the math: 19,068 plus 4,389 minus 7,035 equals 16,422 COMEX contracts, the change in the commercial net short position.
The commercial net short position in gold sits at 16.56 million troy ounces, down 1.64 million troy ounces from the 18.20 million troy ounces they were short in last Friday's COT Report...a very bullish number -- and most likely lower since the Tuesday cut-off.
The short position of the Big 8 traders has now become fuzzy. Ted was of the opinion...which he says he'll sleep on...that there is now a Managed Money trader in the Big 4 short category. Not only was their presence obvious in this week's COT Report, as it showed that they increased their short position by around 800 contracts...but he's also thinking that this Managed Money trader was in the Big 4 short category in the prior COT Report as well. That's for the same reason...there was an increase in the short position in the Big 4 category the previous week as well...which is very counterintuitive considering the engineered price decline in gold that was in progress at the time.
But setting that aside -- and keeping in mind that the Big 8 commercial short position is now contaminated, the Big traders short position now sits at 20.33 million troy ounces, downa tiny 0.22 million troy ounces/800 COMEX contracts from the 20.58 million troy ounces they were short in last week's COT Report.
It's obvious from the big drop...16,422 COMEX contracts...in the commercial category, that Big 8 commercial shorts covered far more than previous paragraph indicates. Ted gave me a guesstimate as to what the net number would have been if that Managed Money trader hadn't been there -- and I think it was about an additional 5,000 contracts.
When I read his column this afternoon and he has something else to say on this subject, I'll change the website version of today's column to reflect that, but it will obviously be too late for the e-mail copy.
As far as Ted's raptors are concerned...the roughly 40-odd small commercial traders other than the Big 8...they most likely increased their long positions during the reporting week, but it's no longer possible, like in silver, to tell by just how much. However, an educated guess would suggest they now hold about 30,000 COMEX contracts on the long side.
Here's Nick Laird's 9-year COT chart for gold, updated with Friday's data. Click to enlarge.
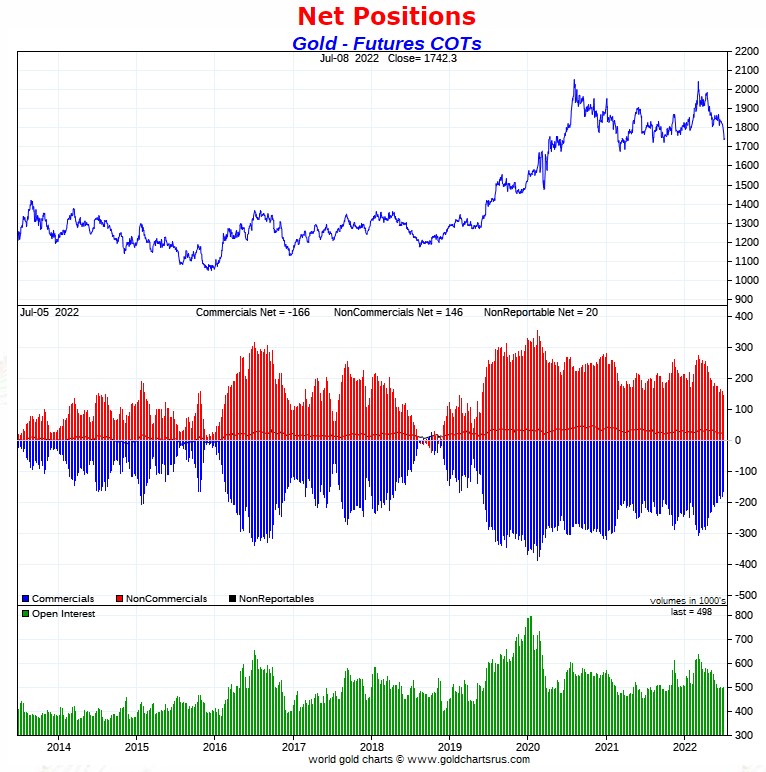
Ted says that the gold 'whale' in the Other Reportables category, who he believes is John Paulson, is still sitting there with about 16,000 long contracts.
And as he also keeps pointing out, because it's a long-term holding -- and not being held for speculative purposes, this long position of 16,000 contracts can be subtracted from the current commercial net short position. Doing that, brings it down to around the 15 million troy ounce mark...which is even more enormously bullish.
And also like in silver, but with the exception of two weeks ago, one would have to back to about May 2019 to see a commercial net short position as small as it is now. Undoubtedly it's lower by even more since the Tuesday cut-off.
We're more than 'locked and loaded' in gold -- and just waiting for 'whatever' to happen. The Big 8 shorts might be able to reduce their short position in gold further going forward...but they do have their limits, because once the Managed Money trader et al. stop selling long contracts and putting on short positions, the bottom is in for its price no matter what 'da boyz' do going forward.
So far they've shows no signs that they're through shorting...as the price action since the Tuesday cut-off indicates that they're not.
But all that does is make the COMEX futures market in gold even stronger -- and more white-hot bullish than it already is.
![]()
In the other metals, the Managed Money traders in palladium decreased their net short position by a further 291 COMEX contracts -- but are still net short palladium by 2,378 contracts...but a goodly less than that amount now after Tuesday's cut-off. The commercial traders continue to be the only categories currently net long palladium. In platinum, the Managed Money traders increased their net short position by a further any chunky 4,589 COMEX contracts -- and are net short platinum in the COMEX futures market by 14,427 COMEX contracts -- and are probably a bit less short than that since Tuesday's cut-off. Platinum continues to be a bifurcated market in the commercial category, with the Producer/Merchants mega net short -- and the Swap Dealers mega net long.
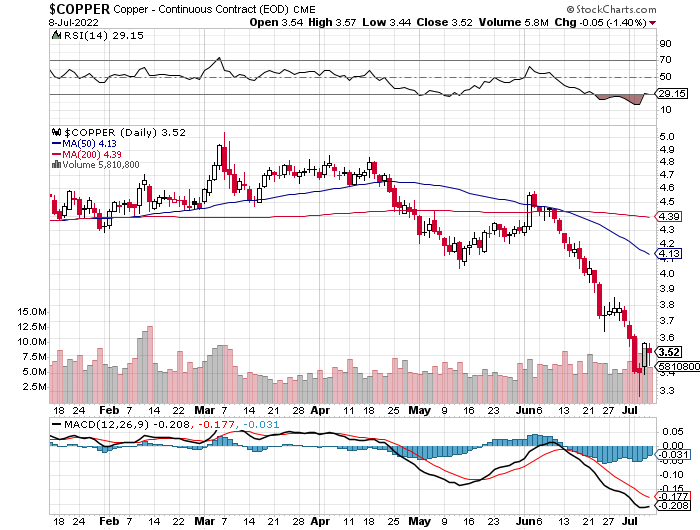
In copper, the Managed Money traders increased their net short position by only 968 COMEX contracts, which is a big surprise considering the price action during the reporting week --and are now net shortcopper by 26,727 COMEX contracts...about 668 million pounds of the stuff. And as in platinum, copper is a totally bifurcated market in the commercial category. The Producer/Merchants are net short copper by a decent amount -- and the Swap Dealers are mega net long.
In this vital industrial commodity, the world's banks...both U.S. and foreign...are net long 12.4 percent of the total open interest in copper in the COMEX futures market as of yesterday's Bank Participation Report. So it's the commodity trading houses such as Glencore, along with some hedge funds that are mega net short copper.
![]()
Here’s Nick Laird’s “Days to Cover” chart, updated with the COT data for positions held at the close of COMEX trading on Tuesday, July 5. It shows the days of world production that it would take to cover the short positions of the Big 4 — and Big '5 through 8' traders in each physically traded commodity on the COMEX.
I consider this to be the most important chart that shows up in the COT series -- and it always deserves a moment of your time. Click to enlarge.
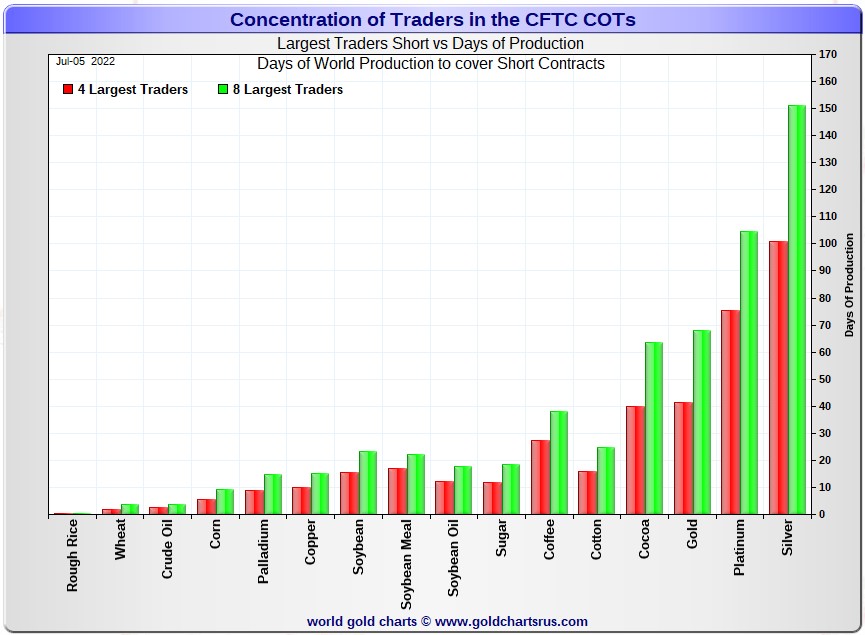
In this week's 'Days to Cover' chart, the Big 4 traders are short about 101 days of world silver production, down 8 days from last week's COT Report. The ‘5 through 8’ large traders are short an additional 50 days of world silver production, down 2 days from last Friday's report, for a total of about 151 days that the Big 8 are short -- and down 10 days from last week's COT Report.
[Note: As you know, there's one Managed Money trader in each of the Big 4 and Big '5 through 8' categories -- and Ted is mulling over the possibility that there might now be two Managed Money traders in the Big '5 through 8' category. This fact distorts the numbers you see below, and the distortions in silver are now so great, that I'm not going to bother doing any calculations...just approximations.]
That 151 days that the Big 8 traders are short, represents five months of world silver production, or 346.2 million troy ounces of paper silver held short by these eight traders...two of which are Managed Money traders.
When talking to Ted yesterday, he was of the opinion that, after subtracting out the positions of the two Managed Money traders, the Big 4 are short around 32,000 COMEX contracts -- and the Big '5 through 8' are short another 17,000 contracts on top of that.
Converting those numbers to days of world silver production produced radically different numbers....about 75 days for the Big 4 -- and 114 days of world silver production for the Big 8.
These are monstrously lower than the 101 and 151 days shows in Nick's graph further up -- and for that reason in silver, it's red and green bars can be disregarded.
As for Ted's raptors in silver, I'm assuming that they added to their long positions by a bit during this past reporting week -- and as I said further up, I suspect that their long position is now a bit north of 200 million troy ounces...a monstrous number.
The Big 8 traders are short 46.3 percent of the entire open interest in silver in the COMEX futures market, which is down a decent amount from the 51.0 percent they were short in the last COT report. And once whatever market-neutral spread trades are subtracted out, that percentage would be a bit above the 50 percent mark. In gold, it's 40.8 percent of the total COMEX open interest that the Big 8 are short, down a tiny bit from the 41.4 percent they were short in last Friday's COT Report -- and a bit over the 45 percent mark once their market-neutral spread trades are subtracted out.
In gold, the Big 4 are short 41 days of world gold production, unchanged from last Friday's COT Report -- and unchanged from the week before as well. The '5 through 8' are short 27 days of world production, down 1 day from last week...for a total of 68 days of world gold production held short by the Big 8 -- and obviously down 1 day from last Friday's COT Report. Based on these numbers, the Big 4 in gold hold about 60 percent of the total short position held by the Big 8...and up 1 day from last Friday's COT Report. This is the fourth week in a row that the Big 8 haven't done much in gold -- and that fact is equally obvious in yesterday's Bank Participation Report.
And because of the most likely entrance of a Managed Money trader into the Big 4 short category, these numbers are off a bit as well...but only by a day or two at the most -- and nothing like the numbers in silver.
But the fact that the Big 8 traders in gold, which includes the bullion banks, haven't done much for the last month, despite the big engineered price decline in that precious metal, is something that I find rather incongruous...to say the least.
The "concentrated short position within a concentrated short position" in silver, platinum and palladium held by the Big 4 commercial traders are about 67, 71 and 60 percent respectively of the short positions held by the Big 8...the red and green bars on the above chart. Silver is down about 1 percentage point from last week...platinum is down 5 percentage points from a week ago. Palladium is down 7 percentage points week-over-week.
The above silver number, plus a tiny bit in gold are not quite accurate because of the involvement of the Managed Money traders in both...but close enough for our purposes.
The Big 4/8 traders are still sitting there like a lump in gold and silver, but both have grown smaller over the last month and a bit -- and they took another big hit this past reporting week, as Ted reported that the Big 4 shorts in silver were super aggressive in their short covering for the second week in a row. They were most likely even more aggressive than the COT Report states, but how much more aggressive is up in the air because the Big 8 shorts are no longer all commercial traders...contaminated by those two Managed Money traders in their midst. Based on that fact, it's impossible to precisely tell how well they made out...but it was a lot once again.
As I keep pointing out in this spot every Saturday, the circumstances in silver have been altered by an unimaginable [and monstrously bullish] amount by Ted's discovery of the 1 billion troy ounce physical short position in silver that Bank of America holds in the OTC market...along with the big increase in Goldman's derivatives position in silver in that market, as shown in the latest OCC Report for Q1/2022...which Ted figures is a long position.
The new OCC Derivatives Report for Q1/2022 was posted about two weeks or so ago -- and Ted had a lot to say about it in the public domain at that time -- and that's linked here.
But despite these improvements mentioned above, the situation regarding the Big 4/8 commercial shorts in silver, gold [and in platinum for those commercials in the Producer/Merchant category] continues to be far beyond obscene, twisted and grotesque -- and as Ted correctly points out ad nauseam, its resolution will be the sole determinant of precious metal prices going forward...with that resolution getting closer with each passing week.
As always, nothing else matters.
![]()
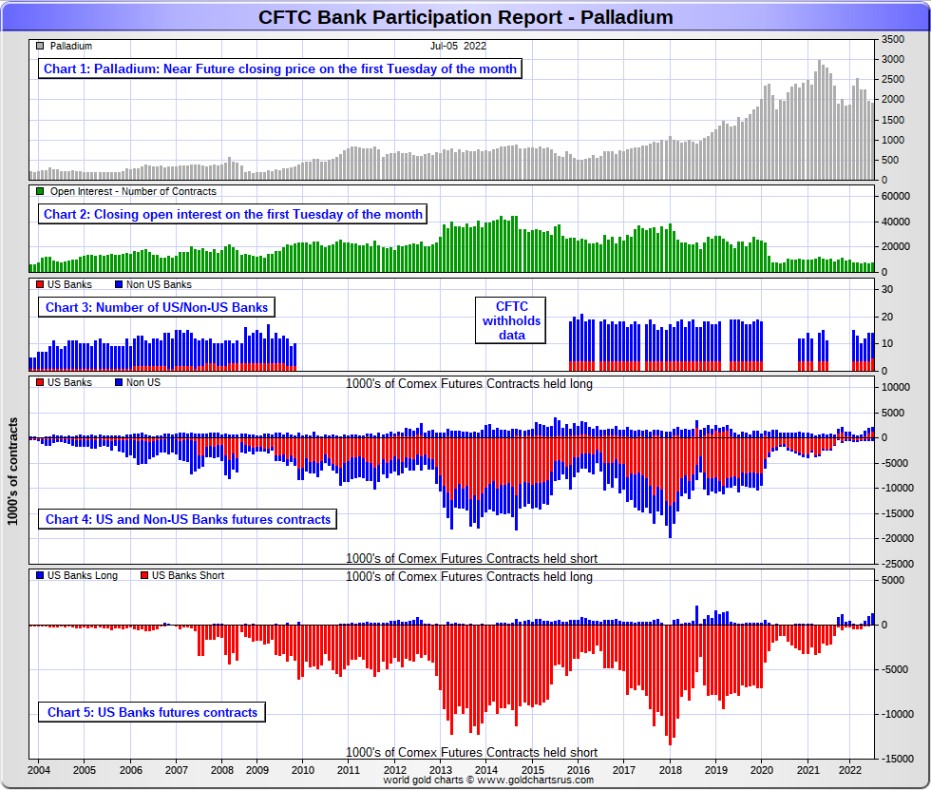
The July Bank Participation Report [BPR] data is extracted directly from yesterday's Commitment of Traders Report. It shows the number of futures contracts, both long and short, that are held by all the U.S. and non-U.S. banks as of Tuesday’s cut-off in all COMEX-traded products. For this one day a month we get to see what the world’s banks are up to in the precious metals. They’re usually up to quite a bit -- and certainly were again this past month.
[The July Bank Participation Report covers the time period from June 7 to July 5 inclusive.]
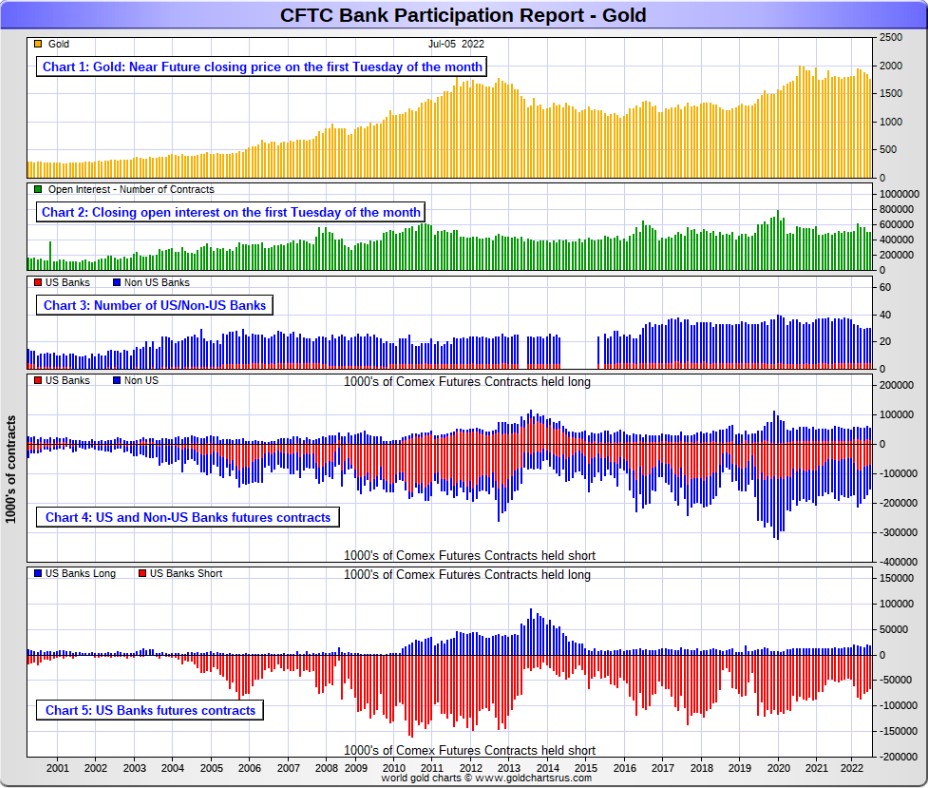
In gold, 5 U.S. banks are net short 49,610 COMEX contracts in the July BPR. In June’s Bank Participation Report [BPR] these same 5 U.S. banks were net short 52,166 contracts, so there was a decrease of only 2,556 COMEX contracts month-over-month. I was expecting a far higher number that that, but it was their third monthly decrease in a row.
Citigroup, HSBC USA, Bank of America and Morgan Stanley would most likely be the U.S. banks that are short this amount of gold. I still have my usual suspicions about the Exchange Stabilization Fund, although if they're involved, they are most likely just backstopping these banks.
Also in gold, 25 non-U.S. banks are net short 45,264 COMEX gold contracts. In June's BPR, these same 25 non-U.S. banks were net short 55,946 contracts...so the month-over-month change shows a decrease of a fairly hefty 10,682 COMEX contracts...the fifth monthly decrease in a row -- and down from the 92,025 contracts they were short in the March BPR.
These are the kinds of decreases that I've been expecting to see for the U.S. Banks, but it didn't happen.
At the low back in the August 2018 BPR...these same non-U.S. banks held a net short position in gold of only 1,960 contacts -- and they've been back on the short side in an enormous way ever since.
I suspect that there are at least three large banks in this group, HSBC, Barclays and Standard Chartered. I still harbour suspicions about Scotiabank/Scotia Capital, Dutch Bank ABN Amro, French bank BNP Paribas, plus Australia's Macquarie Futures. Other than that small handful, the short positions in gold held by the vast majority of non-U.S. banks are immaterial and, like in silver, have always been so.
As of this Bank Participation Report, 30 banks [both U.S. and foreign] are net short 19.1 percent of the entire open interest in gold in the COMEX futures market, which is down a bit from the 21.9 percent that these same 30 banks were net short in the June BPR.
Here’s Nick’s BPR chart for gold going back to 2000. Charts #4 and #5 are the key ones here. Note the blow-out in the short positions of the non-U.S. banks [the blue bars in chart #4] when Scotiabank’s COMEX short position was outed by the CFTC in October of 2012. Click to enlarge.
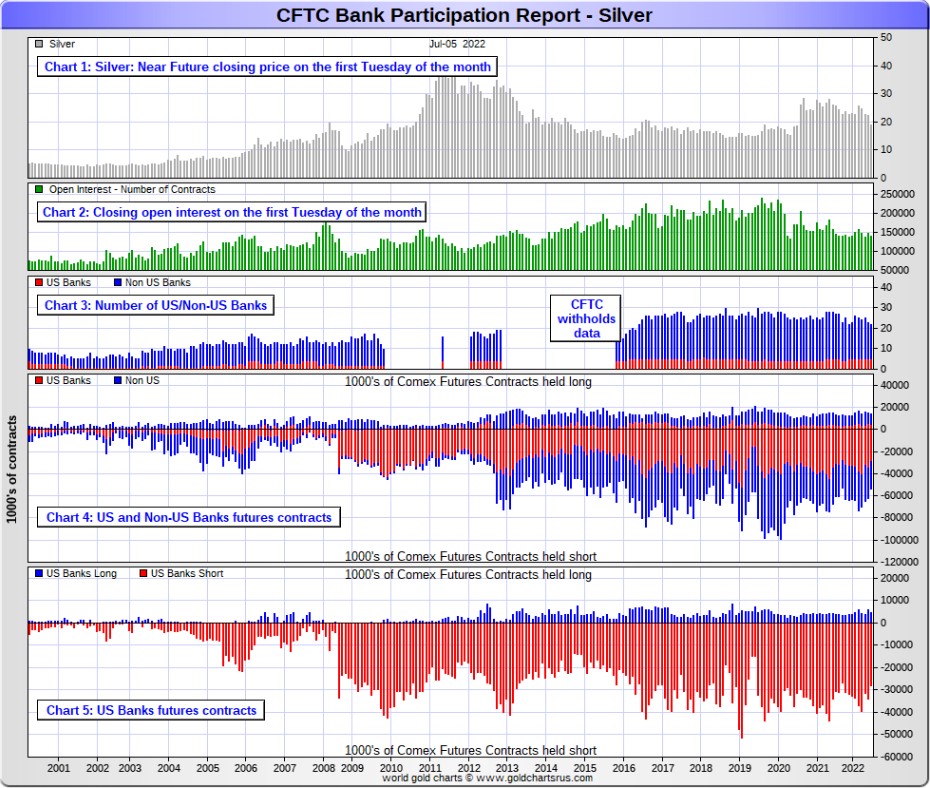
In silver, 5 U.S. banks are net short 23,444 COMEX contracts in July's BPR. In June's BPR, the net short position of these same 5 U.S. banks was 28,312 contracts, which is down 4,868 contracts from a month ago. You'd have to go back to April of 2018 to find a lower number than this one...although it came close in October of last year.
The biggest short holders in silver of the five U.S. banks in total, would be Citigroup, HSBC USA, Bank of America, Morgan Stanley...and maybe Goldman Sachs...but not JPMorgan according to Ted. And, like in gold, I have my suspicions about the Exchange Stabilization Fund's role in all this...although, also like in gold, not directly.
Also in silver, 17 non-U.S. banks are net short 16,724 COMEX contracts in the July BPR...which is down 2,846 contracts from the 19,570 contracts that 18 non-U.S. banks were net short in the June BPR...the fourth month in a row of decreases. You'd have to go back to October of 2021 to find a lower number -- and before that, back to December of 2018.
I would suspect that HSBC and Barclays holds a goodly chunk of the short position of these non-U.S. banks...plus some by Canada's Scotiabank/Scotia Capital still. I'm not sure about Deutsche Bank... but now suspect Australia's Macquarie Futures. I'm also of the opinion that a number of the remaining non-U.S. banks may actually be net long the COMEX futures market in silver. But even if they aren’t, the remaining short positions divided up between these other 14 or so non-U.S. banks are immaterial — and have always been so.
As of July's Bank Participation Report, 22 banks [both U.S. and foreign] are net short 28.5 percent of the entire open interest in the COMEX futures market in silver— down from the 32.3 percent that 23 banks were net short in the June BPR. And much, much more than the lion’s share of that is held by Citigroup, HSBC, Bank of America, Barclays, Scotiabank -- and possibly one other non-U.S. bank...all of which are card-carrying members of the Big 8 shorts.
I'll point out here that Goldman Sachs, up until late last year, had no derivatives in the COMEX futures market in any of the four precious metals. But they did show up in the last two OCC Reports. Now they have a $5.96 billion position, virtually all in silver -- and as I pointed out a bit further up, Ted thinks they're long the market.
Here’s the BPR chart for silver. Note in Chart #4 the blow-out in the non-U.S. bank short position [blue bars] in October of 2012 when Scotiabank was brought in from the cold. Also note August 2008 when JPMorgan took over the silver short position of Bear Stearns—the red bars. It’s very noticeable in Chart #4—and really stands out like the proverbial sore thumb it is in chart #5. But, according to Ted, as of March 2020...they're out of their short positions, not only in silver, but the other three precious metals as well. Click to enlarge.
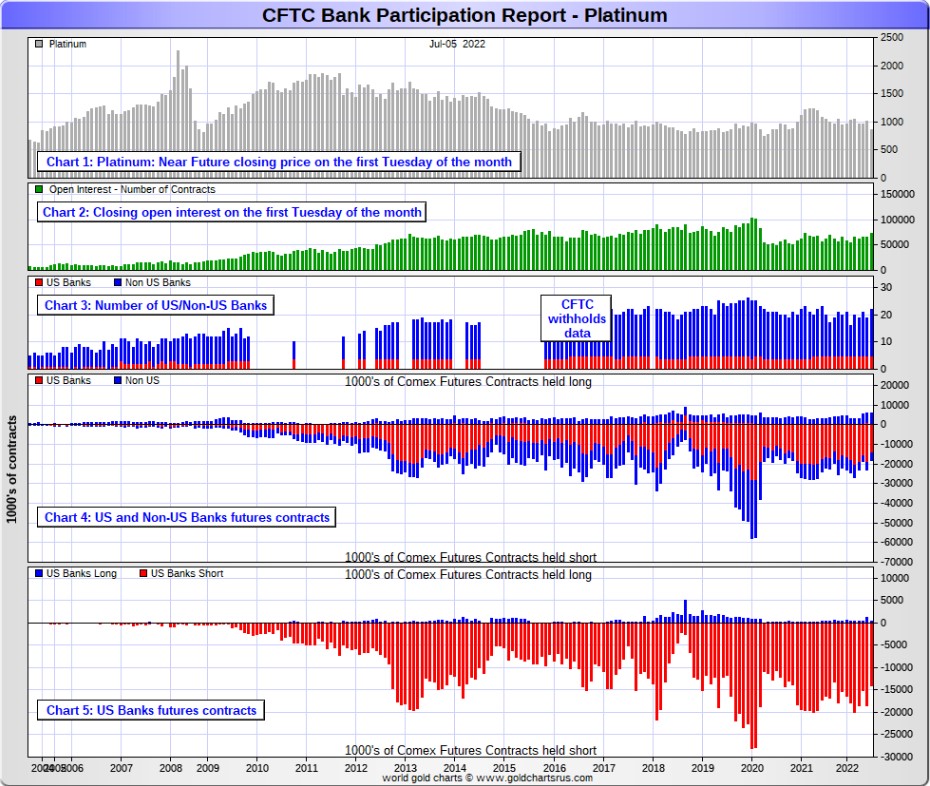
In platinum, 5 U.S. banks are net short 13,539 COMEX contracts in the July Bank Participation Report, which is down 3,773 contracts from the 17,312 COMEX contracts that these same 5 U.S. banks were short in the June BPR. This is the smallest net short position that these U.S. banks have held since December of last year -- and before that, October of 2020.
At the 'low' back in July of 2018, these U.S. banks were actually net long the platinum market by 2,573 contracts. So they have a very long way to go to get back to just market neutral in platinum...if they ever intend to, that is.
Also in platinum, 17 non-U.S. banks are net long 1,504 COMEX contracts in the July BPR, which is up 1,284 contracts from the 220 contracts that 14 non-U.S. banks were net long in the June BPR.
So from a U.S./non-U.S. bullion bank perspective, this is a bifurcated market.
[Note: Back at the July 2018 low, these same non-U.S. banks were net short 1,192 COMEX contracts in platinum.]
And as of July's Bank Participation Report, 22 banks [both U.S. and foreign] are net short 16.5 percent of platinum's total open interest in the COMEX futures market, which is down big from the 26.2 percent that 18 banks were net short in June's BPR.
But it's the U.S. banks in this bifurcated market that are on the short hook big time -- and the real price managers. They have little chance of delivering into their short positions, although a very large number of platinum contracts have already been delivered during the last couple of years...including including the current July delivery month. But that fact, like in both silver and gold, has made no difference whatsoever to their paper short positions. The situation for them [the U.S. banks] in this precious metal is as almost as equally dire in the COMEX futures market as it is with the other two precious metals...silver and gold...particularly the former.
The reason that they'll never improve their short positions in a big way is the same reason as in gold and silver...the Managed Money traders flatly refuse to go short big time like they used to in the past. But, having just said that, they are currently net short 14,427 COMEX contracts in platinum in yesterday's COT Report. But that still hasn't helped the Big shorts -- and I suspect that yesterday's COT Report in platinum shows the maximum net short position in platinum that the Managed Money traders will ever hold.
Here's the Bank Participation Report chart for platinum. Click to enlarge.
In palladium, 5 U.S. banks are net long 1,257 COMEX contracts, up 457 contracts from the 800 COMEX contracts that 4 U.S. banks were net long in June's BPR.
Also in palladium, 9 non-U.S. banks are net long 341 COMEX contracts in the July BPR, down 231 contracts from the 572 contracts that 10 non-U.S. banks were net long in June.
Except in February's Bank Participation Report, these non-U.S. banks have been net long palladium for more than two years now.
And as I've been commenting on for almost forever, the COMEX futures market in palladium is a market in name only, because it's so illiquid and thinly-traded. Its total open interest in yesterday's COT Report was only 7,373 contracts...compared to 72,895 contracts of total open interest in platinum...140,463 contracts in silver -- and 498,210 COMEX contracts in gold.
The only reason that there's a futures market at all in palladium, is so that the Big 8 traders can control its price. That's all there is, there ain't no more.
As of this Bank Participation Report, 14 banks [both U.S. and foreign] are now net long 21.7 percent of the entire COMEX open interest in palladium... compared to the 19.5 percent of total open interest that 14 banks were net long in June's BPR.
And because of the small numbers of contracts involved, along with a tiny open interest, these numbers are pretty much meaningless.
But, having said that, for the last almost three years in a row now, the world's banks have not been involved in the palladium market in a material way. And with them now net long, it's all hedge funds and commodity trading houses that are left on the short side.
Here’s the palladium BPR chart. Although the world's banks are now net long at the moment, it remains to be seen if they return as big short sellers again at some point like they've done in the past. Click to enlarge.
Excluding palladium for obvious reasons -- and platinum in the non U.S. bank category...only a small handful of the world's banks, most likely four or so in total -- and mostly U.S-based, except for HSBC, Barclays and maybe Standard Chartered... continue to have meaningful short positions in the precious metals. It's a near certainty that they run this price management scheme from within their own in-house/proprietary trading desks...although it's a given that some of their their clients are short these metals as well.
The futures positions in silver and gold that JPMorgan holds are immaterial -- and have been since March of 2020...according to Ted Butler. And what net positions they might hold, would certainly be on the long side of the market. It's the new 7+1 shorts et al. that are on the hook in everything precious metals-related.
And as has been the case for years now, the short positions held by the Big 4/8 traders/banks is the only thing that matters...especially the short positions of the Big 4 -- and how this is ultimately resolved [as Ted said earlier] will be the sole determinant of precious metal prices going forward.
The Big 8 shorts, along with Ted's raptors...the small commercial traders other than the Big 8 commercial shorts...continue to have an iron grip on their respective prices -- although things have changed a bit in that regard over the last month. The Big 4/8 shorts have engineered prices lower in order to cover as many of their short positions as possible -- and they've been most successful at it...with the only disappointment being the small decrease in the short position in gold held by the U.S. banks.
That 'iron grip' will persist until they either voluntarily give it up...or are told to step aside, as it now appears that there's no chance that they will ever get overrun. If that possibility had ever existed in reality, it would have happened already. However, considering the current state of affairs in the world today -- and the physical shortage in silver, I suppose one shouldn't rule it out entirely.
I have an average number of stories, articles or videos for you today, including a couple of items that I've been saving for Saturday's column for length and/or content reasons.
![]()
CRITICAL READS
Payrolls increased 372,000 in June, more than expected, as jobs market defies recession fears
Job growth accelerated at a much faster pace than expected in June, indicating that the main pillar of the U.S. economy remains strong despite pockets of weakness.
Nonfarm payrolls increased 372,000 in the month, better than the 250,000 Dow Jones estimate and continuing what has been a strong year for job growth, according to data Friday from the Bureau of Labor Statistics.
The unemployment rate was 3.6%, unchanged from May and in line with estimates. An alternative measure of unemployment that includes discouraged workers and those holding part-time jobs for economic reasons fell sharply, dropping to 6.7% from 7.1%.
“The strong 372,000 gain in non-farm payrolls in June appears to make a mockery of claims the economy is heading into, let alone already in, a recession,” said Andrew Hunter, senior U.S. economist at Capital Economics.
Stocks opened slightly weaker following the news while government bonds were sharply higher. The 10-year Treasury yielded 3.06% around 9:30 a.m. ET. That was still below the 2-year yield of 3.103%, a relationship called an “inversion” that historically has been a reliable recession signal.
This story showed up on the cnbc.com Internet site at 8:30 a.m. on Friday morning EDT -- and was updated about three hours later. I thank Swedish reader for today's first news item - and another link to it is here. A directly related and chart-filled Zero Hedge story, courtesy of Richard Saler, is headlined "Something Snaps in the U.S. Labor Market: Full, Part-Time Workers Plunge as Multiple Jobholders Soar" -- and linked here.
![]()
Consumer Credit Hits a Brick Wall With Credit Cards Maxed Out
Last month, when we reported that the latest (April) consumer credit numbers were an absolute shocker, with another month of blowout revolving (credit card) debt confirming that US consumers had tapped out, and were spending themselves silly with money they don't have, we said that the hangover was going to be brutal and painful.
Well, fast forward one month to the Fed's latest, just released consumer credit data (for the month of May) which confirmed that as expected, U.S. consumers had maxed out their credit cards and the hangover had started.
Starting at the top, total consumer credit rose just $22.3 billion, the lowest monthly total since January, and a sharp drop from both April's $36.8 billion and March's record $47.5 billion.
The drop was driven entirely by a sharp slowdown in revolving debt (i.e., credit card usage) which rose by just $7.4 billion, the lowest since last August, and nearly 75% below March's record $25.9 billion.
Meanwhile, non-revolving credit, which is far more stable as it funds less discretionary items such as cars and college education, rose by $14.9 billion, below April's $18.8 billion, if in line with the average monthly increase of 2021.
Bottom line: the sharp drop in credit card growth (if not yet decline) is precisely why Q2 GDP is on pace for a big slowdown. But what's worse is that once the mass layoffs kick in in addition to the soaring inflation, at a time when most marginal credit cards are maxed out, the pain across U.S. consumers will be unbearable, as it will come just as most households are tapped out and no longer have dry powder on their credit card for discretionary purchases.
In short, the recession which unofficially started in Q1 and worsened in Q2, is about to get much worse in Q3 when the key support pillar of the US economy, consumer spending which accounts for 70% of GDP, goes into reverse now that maxed out credit cards have to finally be repaid.
This rather brief 3-chart Zero Hedge article appeared on their Internet site at 3:44 p.m. EDT on Friday afternoon -- and another link to it is here. Gregory Mannarino's post market close rant for Friday is linked here -- and I suspect that it's for very mature audiences only. I thank Brad Robertson for pointing it out.
![]()
Failing states and strangled economies -- Alasdair Macleod
The decline and fall of the West
We are seeing, perhaps, a rerun of Rome’s multi-century decline ourselves, but our socio-economic decline is progressing at a far quicker pace. Though there have been some examples of old-fashioned barbarity in our wider spheres of influence, we are not so much driven by a Nero or a Caligula, but by the absence of statesmen, denial of capitalism, and the promotion of wishy-washy socialism. Our decline is evidenced in the erosion of our work ethic, hate of capitalism, and a widespread belief in entitlement for which the state is expected to provide. It threatens to be a terminal decline in established morality based on Judeo-Christian values.
Politicians are aiding and abetting the trend by refusing to address it. They even refuse to stand up for established definitions of gender. Presumably, they don’t want to encourage hate mail from a very vociferous but minuscule minority — anything for an easy life. But creeping anti-morality has adverse consequences. Government departments now have “diversity advisers”, and other woke police, and are bound through regulations to adhere to their irrelevant strictures. Universities are riddled with woke nonsense, and no one in authority has the authority to stop it. History is being rewritten to include new biases, political correctness being more important than historical facts.
It infects business. Publishers and filmmakers are raking in money from the Harry Potter series but refuse to acknowledge the author whose only crime was to point out that a woman is a woman, and a man is a man.
It is symptomatic of moral decline, leading to societal breakdown, and a political system incapable of dealing with adverse headwinds. This baloney is indicative of a deep malaise affecting all Western nations. I take as an example the moral decline of the UK, because that is where I live. I ask readers elsewhere to compare their experience with that of Britain, and I’m sure they will see similarities.
This very interesting, worthwhile, but long commentary from Alasdair Macleod put in an appearance on the goldmoney.com Internet site on Wednesday. However, for obvious length reasons I though it best to save it for today's column. I found it embedded in a GATA dispatch -- and another link to it is here.
![]()
Revisiting the Bursting China Bubble -- Doug Noland
The world is these days literally confronting scores of Bubbles, some bursting and others at the cusp. This creates significant analytical challenges. There is the complex “Periphery to Core” dynamic. There are also faltering Bubble sequencing issues, along with a dispersion of policy responses. And speculative dynamics have never before played such a pivotal role in global liquidity dynamics. In short, as we’ve witnessed in recent weeks, many independent yet interrelated Bubbles create extraordinarily complex (and erratic) global dynamics.
Acute China Bubble fragility last year was a key dynamic working to sustain ultra-low global bond yields (thus elsewhere extending “Terminal Phase Bubble Excess”) even in the face of intensifying inflationary pressures. Recall that Chinese Crisis Dynamics began with the Huarong eruption in April 2021. While Beijing stuck a band aid on Huarong (recapitalization), the blood would soon be spurting from numerous wounds. Below 14% in May 2021, Evergrande yields would be at 75% by mid-October. It was not long before “isolated” developer issues turned anything but: Shimao, Lonfor, Sunac, Kaisa, Fantasia, Sunshine 100, Greenland, Modern Land, China Properties Group, Xinyuan Real Estate, Powerlong, Zhongliang, Zhenro Properties…
The Chinese developer crisis is old news. Beijing, of course, has everything under control. Indeed, global markets were bolstered again this week by reports of additional stimulus measures.
The bottom line is that the situation in China continues to deteriorate despite massive Beijing stimulus. Understandably, Chinese officials are turning panicky. While some economic indicators reflect an uptick in economic activity from pent-up Zero-Covid demand, there is little to indicate the type of bounce back in confidence necessary to power a sustainable recovery. Indeed, evidence supports the view that the housing downturn is becoming only more deeply entrenched.
Indicators point to broadening Chinese Credit instability. Curiously, Huarong CDS was up another 64 bps this week, with a two-week surge of 202 bps – to the high since October 2021. Vanke CDS jumped 105 in two weeks (45 bps this week) to 372 bps. One of China’s largest and financially stable developers, Vanke CDS traded below 100 bps in September. Meanwhile, Country Garden, China’s largest developer, saw bond yields surge 255 bps this week to 29.47%. Yields were up 950 bps over the past month, almost back to March spike highs. Sunac yields were up 517 bps this week, Lonfor 1,624 bps and Kaisa 530 bps.
There is ample evidence that China’s historic Bubble is in increasing peril. Things are really bad, but are almost certainly a lot worse than what we think. Most ominous of all, China’s Bubbles are faltering even with ongoing massive (double-digit) Credit growth.
As you are more than aware, Doug's weekly commentaries are always must reads for me -- and this one appeared on his website just after midnight on Saturday morning Pacific Daylight Time. Another link to it is here.
![]()
Gold's Role in a Changing World Order: Frank Giustra
This 44-minute video interview showed up on the youtube.com Internet site back on June 24 -- and it's been sitting in my in-box since last Saturday, awaiting this Saturday's column. I've listened to most of it -- and it's definitely worth your time. Frank doesn't pull any punches about the price management scheme in this video either. I thank Roy Stephens for sending it our way -- and another link to it is here.
![]()
Ex-JPMorgan traders' 'spoofed' trades were genuine, defense says as trial opens
The closely watched criminal trial of three former JPMorgan Chase & Co employees kicked off on Friday, with a prosecutor saying they "ripped off" the precious metals futures market with fake orders and defense attorneys saying the orders were genuine.
The bank's former global precious metals desk head Michael Nowak, precious metals trader Gregg Smith and salesperson Jeffrey Ruffo are charged with racketeering and conspiracy in the U.S. Justice Department's most aggressive case to date targeting the manipulative trading tactic known as spoofing.
Spoofing involves placing fake sell or buy orders and then canceling them with the goal of moving the price.
Prosecutor Lucy Jennings told jurors that each played a role in the scheme, which involved creating phantom supply or demand by placing buy or sell orders they never intended to fill, and then profiting from trades in the other direction.
"Either way, somebody got ripped off," she said.
There is no doubt that orders were placed and then canceled, said Jonathan Cogan, an attorney for Smith.
"But they are wrong about what was in his mind when he did it," he said, referring to prosecutors.
So, the fight is on. This Reuters article, was posted on their Internet site at 4:01 p.m. PDT on Friday afternoon -- and I found this one on the gata.org website. Another link to it is here.
![]()
China gold demand still picking up in June...but slowly -- Lawrie Williams
Despite recent disappointing gold import figures from Switzerland, latest gold withdrawal data from China's Shanghai Gold Exchange (SGE) for the month of June do at least point to a tentative demand pick up in the world’s leading gold consuming nation. Of course, with Russia perhaps needing to find a new export outlet for its gold production, its neighbour, which is not party to the U.S.-imposed sanctions programme may be providing a convenient outlet. Neither country is necessarily particularly forthcoming about its gold import and export statistics at present, so any such supposition will have to remain speculative. However, as probably the world’s two leading gold producers there is endless opportunity available for disguising any gold trade between them.
A table showing the monthly gold withdrawal figures from the SGE is set out below. SGE withdrawals are widely believed to be a strong indicator of Chinese domestic commercial gold demand, but probably excludes gold which may be being added into the nation’s gold reserves which many analysts believe may be a substantial amount held in accounts which the Chinese government claims do not need to be reported to the International Monetary Fund (IMF). If they do exist, these additional reserves may be mobilized should the rumoured alternative reserve currency being set up by Russia, China and the other BRIC nations see the light of day.
This rather brief commentary from Lawrie showed up on the Sharps Pixley website on Friday sometime -- and another link to it is here.
![]()
The Photos and the Funnies
Still in the 'ghost town' of Wallachin on August 22. I took the first photo on a small side road that went down to almost river level. A lone rail car sits on a siding/loop off the CNR main line. The second shot...looking east...taken on the way out of town, show it in the background in the center of the photo -- and that lone rail car shown in photo one is in the distant left-of-center background of this shot. Photo three was taken from the same spot as the second shot, except looking across the Thompson River. The well-irrigated farm land stands in sharp contrast to the baked and tinder-dry landscape that surrounds it. The Bonaparte Plateaulooms in the background. The last photo was taken back on the north side of the river. A cluster of beehives is shown in the center of the shot, but there's not much nectar at this time of year, as the growing season has long since passed. Click to enlarge.


![]()
The WRAP
"Understand this...things are now in motion that cannot be undone." -- Gandalf the White
![]()
Today's pop 'blast from the past' dates from 1978...44 years ago...how is that possible? The Swedish group that performs it -- and the song itself need no introduction whatsoever -- and the link is here. Of course there's a bass cover to this -- and that's linked here.
Today's classical 'blast from the past' is something that I should have posted two weeks ago at the summer solstice in the northern hemisphere, but it completely skipped my mind...so here it is now. It's Antonio Vivaldi's Violin Concerto No. 2 in G minor, Op. 8, RV 315. The performance is by the phenomenal Baroque ensemble Voices of Music, with Cynthia Miller Freivogel as soloist. It's an audio/visual tour de force -- and the link is here.
![]()
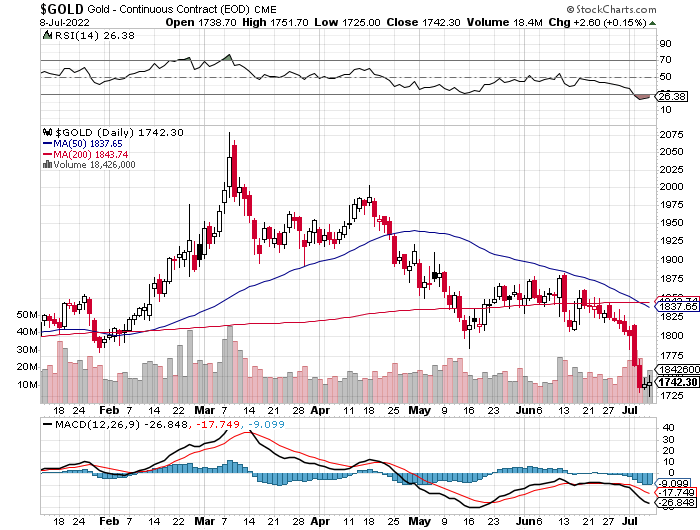
Despite gold's $26 intraday move in the August contract on Friday, there was little if any damage done to the current white-hot bullish set in the COMEX futures market. As a matter of fact, on an intraday basis, gold set a new low for this engineered price decline.
Yesterday's COT Report didn't include the big new low close in gold on Wednesday which, in my opinion, would have put the Managed Money traders close to being market neutral in gold, if not slightly on the short side.
Of course that won't be know until next Friday -- and there are still two trading days left in the reporting week.
The only thing that bothers me about gold, is that the U.S. banks have done very little short covering during the last four weeks -- and that was the big takeaway from yesterday's Bank Participation Report.
Silver's price action on Friday was also kept in a tight trading range -- and its set-up in the COMEX futures market is so off-the-charts bullish that, as I said further up, I've run out adjectives to describe it.
In platinum, there have been two decent up days in a row...including yesterday -- and I suspect that there was some Managed Money short covering in this precious metal. But regardless of that fact, these same traders are still mega short this precious metal.
What I find most interesting about platinum is the bifurcated market structure in the commercial category, as they're not "all for one -- and one for all"...as the Producer/Merchant category, where all the Big 8 shorts/bullion banks are, is obviously mega net short platinum, whereas the commercial traders in the Swap Dealers category are mega net long the same amount...around 17,000 COMEX contracts.
Of course palladium was the star on Friday -- and the day before, closing above its 200-day moving average on Friday, after closing above its 50-day moving average on Thursday -- and no doubt there was serious short covering going on in it as well. But as you already know this is a microscopic, thinly-traded and illiquid market at the best of times -- and as I stated in today's Bank Participation Report discussion, the only reason that there's a futures market in it, is so that that bullion banks et al. can control its price.
However, at the moment, the world's banks are net long palladium by a bit in aggregate, so its the hedge funds and commodity trading houses that have their necks on the line in this precious metal.
Copper was closed lower by nickel, at $3.52/pound -- and I was more than surprised that the Managed Money traders only increased their net short position by a tiny amount during the reporting week, as the copper price was engineered about 50 cents lower during that time period...a huge move for it. As a matter of fact there wasn't much change in any of the categories in yesterday's COT Report -- and I'm hoping Ted might have something to say about this later today. If he doesn't, I'll be asking him about it on Monday.
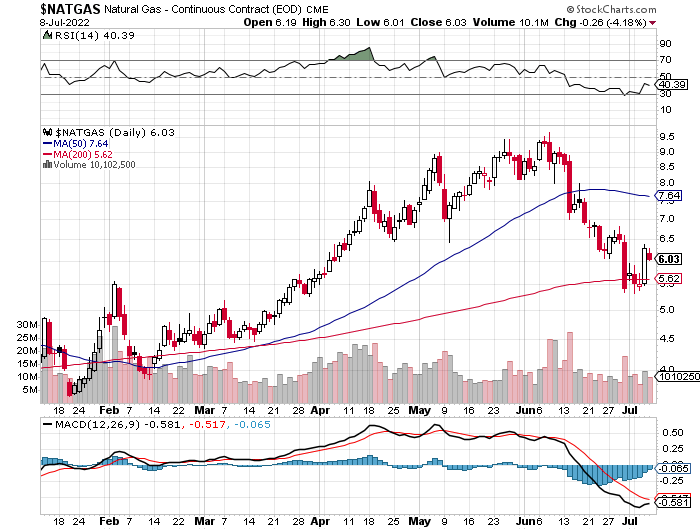
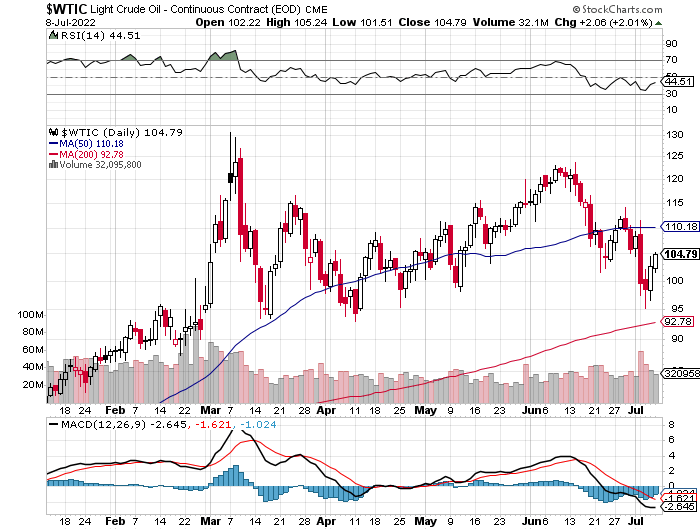
Natural gas, chart included, gave back some of Thursday's big gain on Friday, closing down 26 cents/4.18% at $6.03/1,000 cubic feet. Of course WTIC bucked the trend, closing higher by $2.06/2.01%...at $104.79/barrel -- and still some distance below its 50-day moving average.
Here are the 6-month charts for the Big 6+1 commodities, thanks to stockcharts.com as always -- and yesterday's above-mentioned price changes should be noted...if you have the interest. Click to enlarge.
So when the next rallies in silver and gold are allowed to begin, the only question that matters at this juncture will be the same as it's always been...will the Big 4/8 commercial traders, principally the Big 4, step in and cap their respective rallies once more....the "same old, same old". The answer to that question remains unknown at this point.
But it's all that matters.
As for when those rallies start is not up to us -- and if they do turn out to be of the spectacular variety, it won't be happening in a news vacuum.
So we wait some more.
![]()
Almost all the pieces on Zbigniew Brzezinski's "Grand Chessboard" are in motion at the moment...both at home in our own nation states -- and abroad.
It's useless to try to either analyze the current situations, or speculate on how how they will out as time goes along.
But one thing is for sure -- and that is that the major central banks of the world will continue printing money at an ever-increasing rate...mostly to buy up bonds and other debt instruments in order to keep interest rates low.
As Milton Friedman is quoted as saying..."Inflation is always and everywhere a monetary phenomenon." -- and as John Mauldin pointed out about fifteen years ago..."inflation usually accelerates when money supply growth exceeds the growth rate in the economy for an extended period of time." That "extended period of time" is upon us right now. The BLS is quoting inflation at around 8 percent at the moment, but it's generally accepted that it's about twice that rate.
A lot of the money that the Fed et al. are creating out of thin air never makes it into the real economy. The money that does appears in the economy appears in the form of deficit spending by governments, which the Fed finances by buying U.S. Treasuries.
At the moment, the only thing saving us from a whiff of hyperinflation is the fact that money velocity is so low...and the lowest its been in more than 60 years. Here's the latest chart on this from the St. Louis Fed -- and it's current up until the end of April. Click to enlarge.
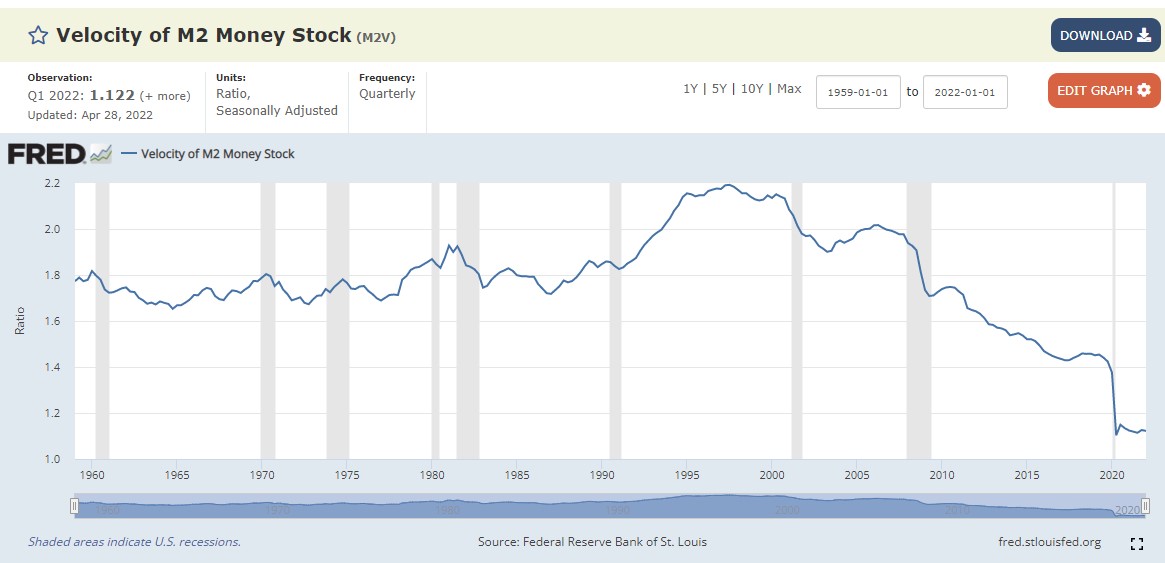
As you can tell, velocity has been crawling along the bottom of its range for the last couple of years and change.
At its peak at the end of Q3/1997, money velocity was just about double what it is today -- and in order to get the current velocity off the floor, will require some rather drastic action from the Fed. Whether they can accomplish that feat, remains to be seen.
As Jim Rickards has pointed out on the Internet and in most of his books over the years, a way for the Fed to increase inflation and money velocity further, would be to revalue gold to a much higher price...what I've called "playing the gold card".
Whether such an event will occur, either by decree, or by natural "market forces"...an oxymoron if there ever was one...is unknown.
But from a COMEX futures market perspective, the stars have never been as alighted as perfectly as they are now for just an event.
That doesn't mean it's going to happen of course, but as I and others have been pointing out for the last decade or more, this price management scheme is long past its "best before" use date -- and one way or another it will end.
Its end will certainly be as well managed as possible -- and all the major players in the world's financial system, including the Fed and the BIS et al. will be involved.
But the great danger to the monetary and financial system at that point is that they will lose control of the process -- and everything paper will crash and burn as the precious metals and the rest of the commodities complex will melt up.
Of course this might turn out to be part of the 'Great Reset', which Willem Middelkoop has correctly pointed out, is already in progress. And whether this 'reset' in precious metal/commodity prices brings our current fiat currency era to an end, will only be known when the dust has settled.
But for that reason...amongst others...I'm still "all in" -- and will remain so to whatever end.
I'm done for the day -- and the week -- and I'll see you here on Tuesday.
Ed
About the author

SUBSCRIBE: https://edsteergoldsilver.com/

Ed Steer’s Daily Analysis of the Gold and Silver Markets
After eight years of writing about the precious metals for Casey Research, the folks at Stansberry & Associates—who just recently purchased controlling interest in the company—decided that my ‘niche market’ column didn’t fit into their plans.
Since the time that Casey Research was kind enough to offer me a stand-alone column, it became their most highly-rated blog almost from the outset—and has remained that way up to this date...