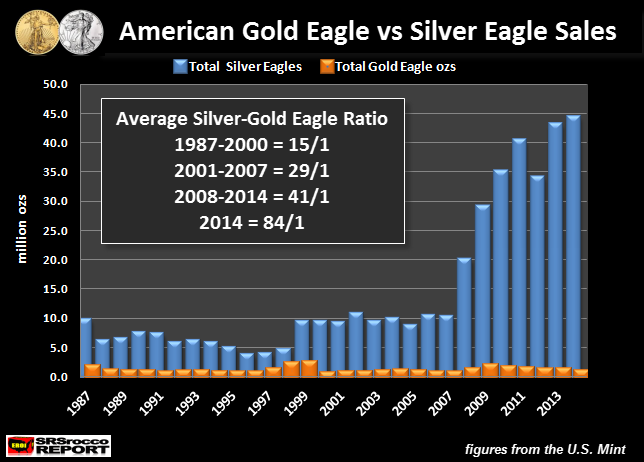
As the global financial system continues to disintegrate under the weight of massive debt and hyper monetary printing, investors choose to purchase a great deal more silver than gold. While this trend continued to get stronger over the past several years, it hit a record high ratio in February.
From 1987 to 2000, the U.S. Mint sold 15 Silver Eagles for every ounce of Gold Eagles. Then from 2001 to 2007, this nearly doubled to 29 Silver Eagles for every ounce of Gold Eagles. However, after the collapse of the U.S. Investment Banking and Housing Industry in 2008, this ratio continued to increase:
From 2008 to 2014, the rate of Silver Eagle to Gold Eagle sales jumped to 41 to 1. What is even more amazing than that statistic, is the Silver to Gold Eagle ratio in 2014. Investors purchased 84 Silver Eagles for every Gold Eagle oz in 2014. The U.S. Mint has not released its 2014 Annual Report, but I would imagine total Dollar sales of Silver Eagles was probably higher than Gold Eagles last year.
Now, if we look at the current demand for U.S. Mint official coins, Silver Eagle vs Gold Eagle sales in February are a staggering 213 to 1:
In the first ten days of February, the U.S. Mint sold 1,389,000 Silver Eagles compared to 6,500 Gold Eagle oz. This 213/1 Silver to Gold Eagle buying ratio is quite significant when we compare it to global mine production. Using data from GFMS 2014 Gold & Silver World Surveys, total world silver production was 820 million oz (Moz) in 2013 compared to 9.7 Moz of gold production.
Thus, the world produced 8.5 oz of silver for every ounce of gold in 2013. I would imagine this ratio will be about the same this year. So, as the world produces 8.5 times more silver than gold, the U.S. Mint is currently selling Silver Eagles at more than 200 times the rate of Gold Eagles.
Furthermore, the USGS just released its 2015 Silver Summary showing the United States silver production increased to 37.6 Moz in 2014 compared to 33.4 Moz in 2013. Even with this 4+ Moz increase of domestic silver production in 2014, it was less than the total amount of Silver Eagles sold by the U.S. Mint last year.
The U.S. Mint sold 44 Moz of Silver Eagles plus an estimated 2+ Moz of proofs and additional official silver coins for a total of 46+ Moz in 2014. Which means, total U.S. silver mine supply is 8+ Moz less than the demand from its official Silver Coin program. This isn’t much of a problem for the United States currently as it imported 4,900 metric tons of silver in 2014.
However, when the world finally loses faith in the Fiat Monetary System and the U.S. Dollar is devalued, there will be a great deal more demand for silver. As future global demand for silver increases, it could put real stress on U.S. silver imports. This will have a two-fold impact:
1) U.S. Silver Imports may decline
2) Demand for Silver Eagles will increase
The world has no idea just how bad the situation will become when the highly leveraged debt-based paper financial system implodes. Fortunately for a small percentage of investors… THEY GET IT.
Which is why we are seeing record 200 times the Silver Eagle buying compared to Gold Eagles. While GOLD is known as the King of monetary metals, SILVER will win the crown as the best performing monetary asset in the future.
On a side note, a few readers have emailed me in the past stating that I failed to include U.S. Mint Gold Buffalo sales. They believe I am overstating the Silver-Gold buying ratio as I do not include Buffalo sales in these calculations. To set the record straight… they are correct. However, Gold Buffalo sales don’t change the ratio all that much.
For example, the U.S. Mint sold 177,500 Gold Buffalo coins in 2014. If we add this to total Gold Eagle oz last year, we would arrive at a total of 702,000 oz. Dividing 44 Moz of Silver Eagles by 702,000 oz of Gold Eagles & Buffalo coins is a ratio of 63 to 1. Furthermore, 5,500 Gold Buffalo coins have been sold in February and if we add them to the 6,500 oz of Gold Eagles, we have a total of 12,000 oz.
Dividing 1,389,000 Silver Eagles by 12,000 Gold Eagles & Buffalo coins, we get a ratio of 116 to 1. This is still more than 13 times the global silver to gold mine production ratio.
Please check back for new articles and updates at the SRSrocco Report. You can also follow us at Twitter below:


