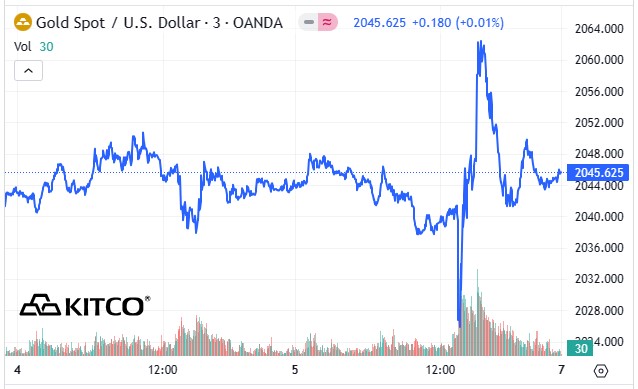
The gold price began to chop quietly higher starting as soon as Globex trading began at 6:00 p.m. in New York on Thursday evening -- and that lasted until 9:40 a.m. in London. From there it wandered somewhat unevenly lower until the jobs number hit the tape in New York at 8:30 a.m. 'Da boyz' hammered it lower from there, but minutes later it took off higher -- and the Big 4/8 shorts stepped in again shortly after 10 a.m. EST. It was engineered lower in price from that point until around 12:35 p.m. -- and about an hour later it began to head higher anew. That quiet rally ran into 'something' around 2:15 p.m. in after-hours trading...was sold lower until around 3:40 p.m. -- and didn't do much after that.
The low and high tick in gold, which were set in early COMEX trading in New York, were reported as $2,071.10 and $2,030.80 in the February contract. The January/February price spread differential in gold at the close in New York yesterday was $7.40...February/April was $19.90...April/June was $19.60 -- and June/August was $17.00 an ounce.
Gold was closed on Friday afternoon in New York at $2,045.60 spot, up $2.20 from Thursday -- and about 18 bucks off its Kitco-recorded high tick. Net volume was certainly on the heavier side at a bit over 188,500 contracts -- and there were 26,000 contracts worth of roll-over/switch volume out of February and into future months...mostly April, but with noticeable amounts into June and August as well.

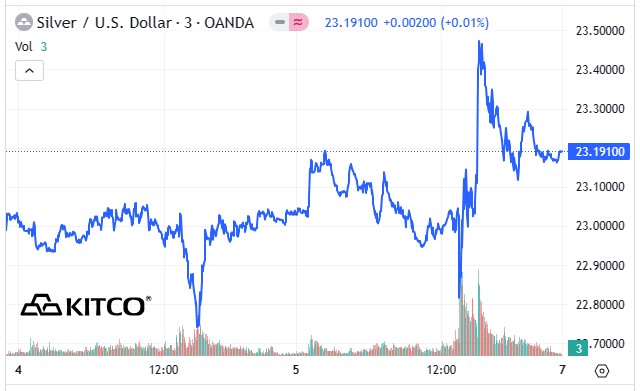
The silver price ticked a few pennies higher at 6:00 p.m. in New York on Thursday evening -- and then took a big jump up starting at 9 a.m. China Standard Time in Globex trading on their Friday morning. That ran into 'da boyz' within minutes -- and it managed to struggle higher until around 10:30 a.m. CST. From there the engineered price decline commenced with both subsequent rallies being bulldozed lower in the process. That sell-off ended at the 10:30 a.m. morning gold fix in London -- and then rallied until the jobs report showed up at 8:30 a.m. in New York...where it got the same reception as gold from 'da boyz'. It blasted higher once the 10 a.m. EST afternoon gold fix was in, in London -- and they put a shiv in that twelve minutes later. It was then sold down hard until about five minutes before the 1:30 p.m. COMEX close...rallied a bit until around 2:10 p.m. in after-hours trading -- and was then escorted lower until around 3:45 p.m...before edging a few pennies higher until trading ended at 5:00 p.m. EST.
The low and high ticks in silver, both of which came at the same times as those for gold, were recorded by the CME Group as $23.715 and $22.97 in the March contract. The January/March price spread differential in silver at the close in New York yesterday was 19.3 cents...March/May was 22.9 cents...May/July was 22.2 cents -- and July/September was 21.7 cents an ounce.
Silver was closed in New York on Friday afternoon at $23.19 spot...up 18 cents from Thursday -- and about 31 cents off its Kitco-recorded high tick of the day. Net volume was nothing much out of the ordinary at around 58,600 contracts -- and there were just about 3,900 contracts worth of roll-over/switch volume out of March and into future months in this precious metal...mostly into May, but with noticeable amounts into the remaining three delivery months of the year as well.

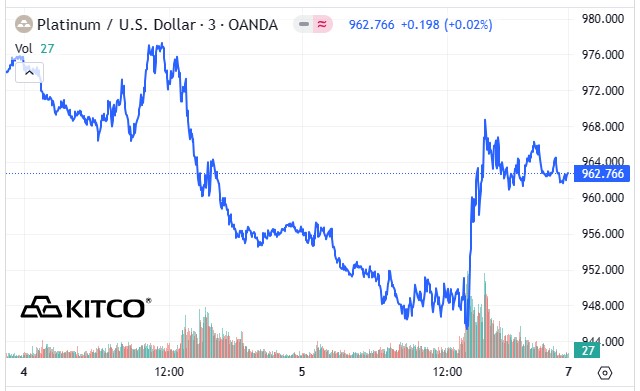
Platinum didn't do much until around 10:30 a.m. China Standard Time in GLOBEX trading on their Friday morning. Its fall from grace commenced at that juncture -- and it was sold mostly lower until it took off higher around 8:50 a.m. in COMEX trading in New York. Its high tick was set at 10:10 a.m. EST...the same time as both silver and gold -- and the commercial traders of whatever stripe engineered it lower from there until 12:10 p.m. From that point it wandered quietly and unevenly sideways until trading ended at 5:00 p.m. EST. Platinum was closed at $963 spot, up 13 dollars on the day.

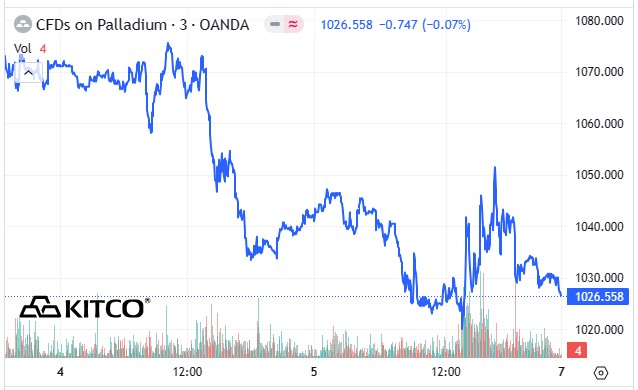
The palladium price edged a bit higher until around 10 a.m. CST on their Friday morning and, like the other three precious metals, was engineered mostly lower until the jobs report showed up in New York at 8:30 a.m. EST. It had a wild and choppy ride higher from that point, with all three of the subsequent price spikes higher meeting the same fate. The last once was capped at 11:15 a.m. -- and it was then stair-stepped lower in price until the market closed at 5:00 p.m. EST. Palladium was closed at $1,026 spot...down another 15 bucks from Thursday.
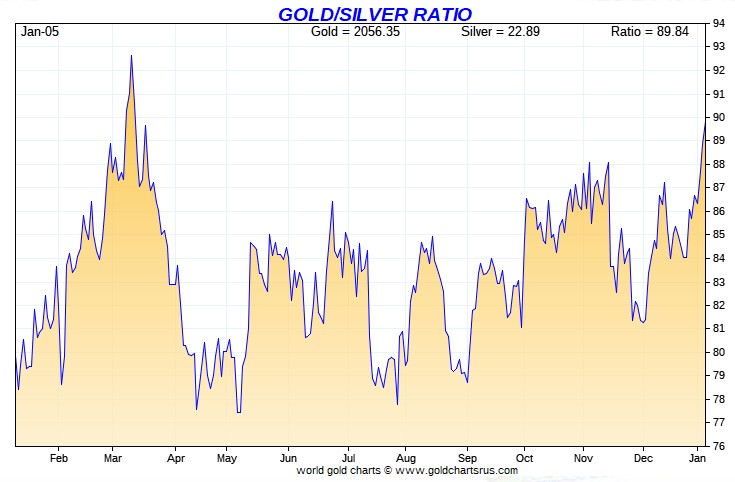
Based on the kitco.com spot closing prices in silver and gold posted above, the gold/silver ratio worked out to 88.2 to 1 on Friday...compared to 88.8 to 1 on Thursday.
Here's the 1-year Gold/Silver Ratio Chart, thanks to Nick Laird and, as always, the Friday data point is not on it for whatever reason. Click to enlarge.

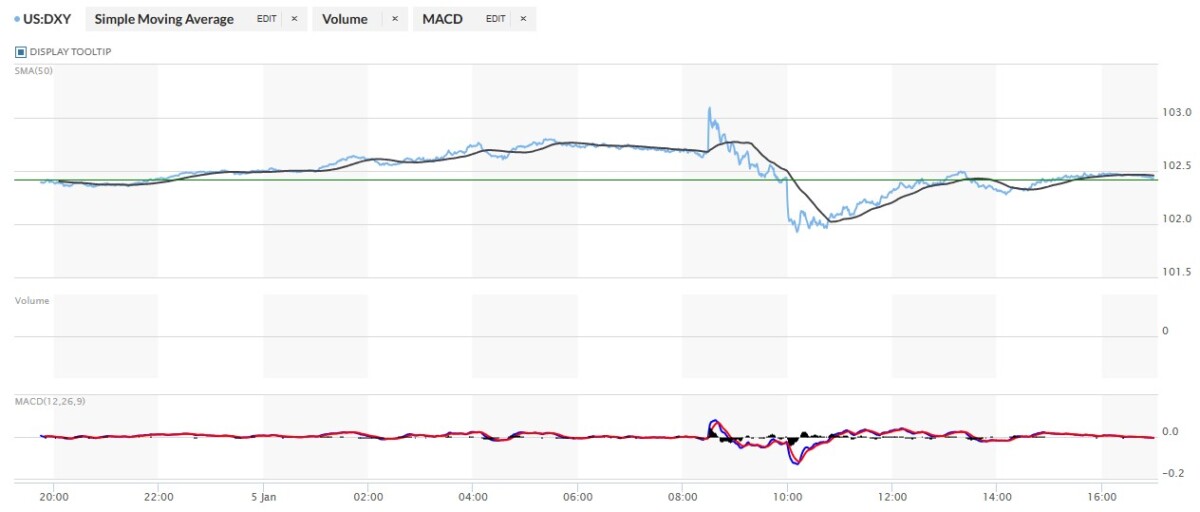
The dollar index closed very late on Thursday afternoon in New York at 102.42 -- and the opened lower by 2 basis points once trading commenced at 7:45 p.m. EST on Thursday evening, which was 8:45 a.m. China Standard Time on their Friday morning. It then began to wander very quietly high until around 10:30 a.m. in London...the morning gold fix over there. It was sold very quietly lower from that juncture until a minute or so before 8:30 a.m. in New York when the jobs report showed up. Its spike higher lasted a minute or so -- and it was then sold lower until its low tick was set around 10:10 a.m. From that point it chopped very quietly higher until five minutes before the 1:30 p.m. COMEX close...was sold a tad lower from there until 2:10 p.m...then edged a bit higher until 3:40 p.m. -- and didn't do a thing after that.
The dollar index finished the Friday trading session in New York at 102.41...down 1 basis point from its close on Thursday.
Here's the DXY chart for Friday, thanks to marketwatch.com as usual. Click to enlarge.

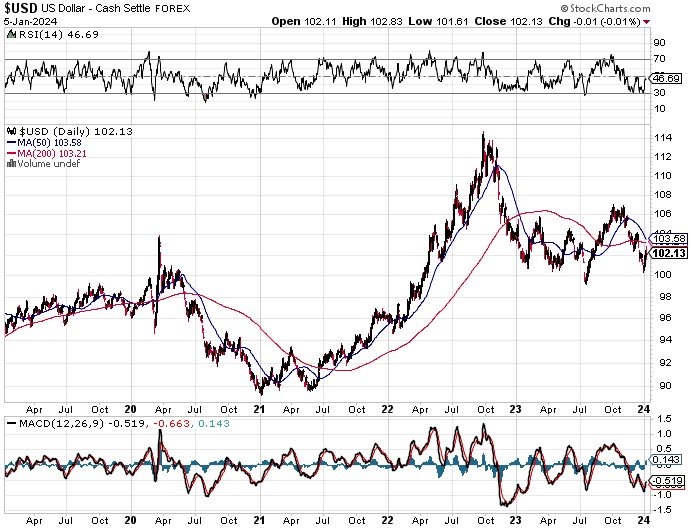
And here's the 5-year U.S. dollar index chart that appears in this spot every Saturday, courtesy of stockcharts.com as always. The delta between its close...102.13...and the close on the DXY chart above, was 28 basis points below its spot close. Click to enlarge.

It's a certainty that the commercial shorts of whatever stripe were active in Globex trading overseas long before the jobs number hit the street at 8:30 a.m. in New York. At that point the entire Plunge Protection Team swung into action -- and the results of their handiwork were evident across a wide swath of markets on Friday.
U.S. 10-Year Treasury: 4.0420%...up 0.0510 (+1.2779%)...as of 02:28 p.m. EST. Despite their best efforts, the Fed couldn't close the 10-year back below 4 percent, although looking at its chart, they certainly did give it the old college try.
And here's the 5-year 10-year U.S. Treasury chart from the yahoo.com Internet site -- which puts the yield curve into a somewhat longer-term perspective. Click to enlarge.
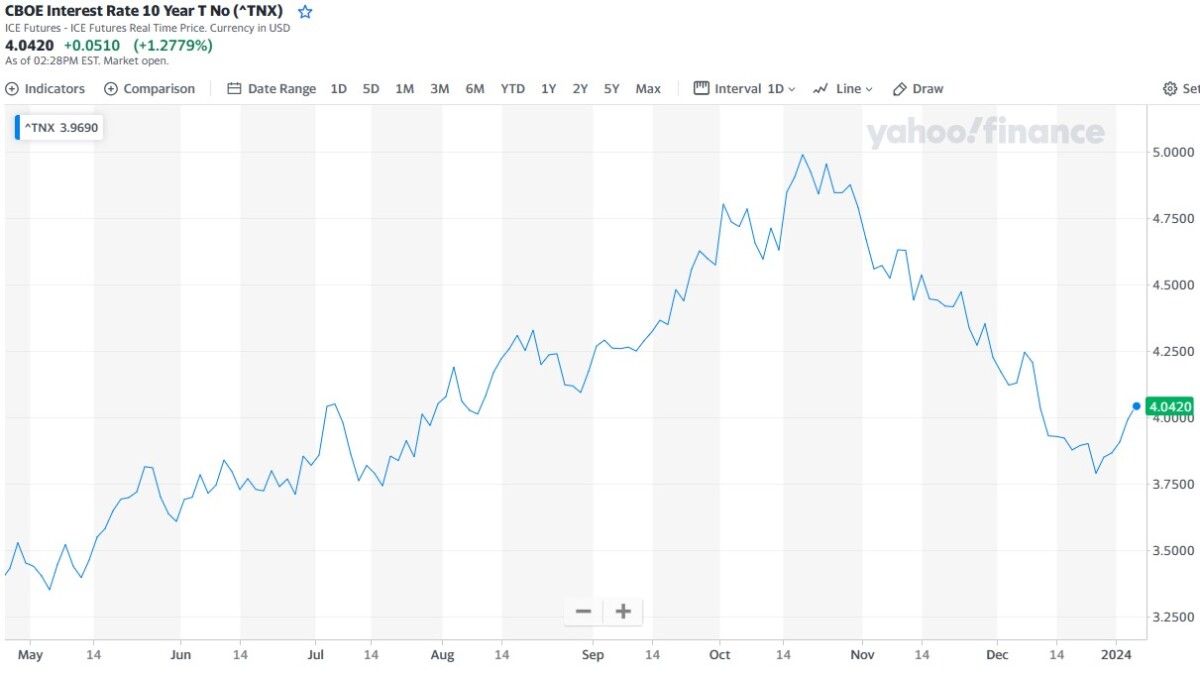
It remains to be seen if the Fed will let the yield curve rise from here. I'm not sure, but would be prepared to bet that theoretical ten bucks that they'll do what's necessary to get it back below that mark. I haven't listened to Gregory M.'s rant for Friday just yet, but suspect he's had something to say about it.
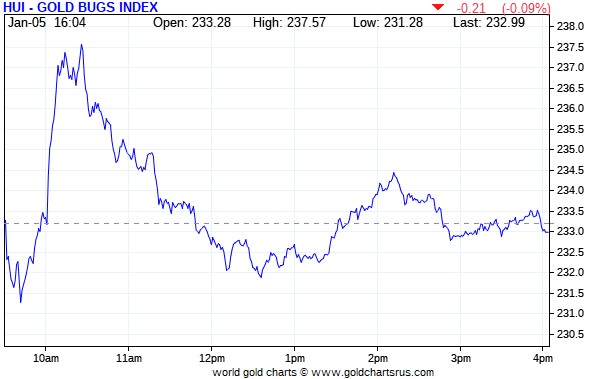
The gold shares dipped a bit during the first fifteen minutes of trading in New York on Friday morning -- and then followed the managed and engineered gold price like a shadow for the rest of the day. The HUI closed down a minuscule 0.09 percent, so call it unchanged for the second day in a row.

Computed manually, the new Silver Sentiment/Silver 12 Index finished down 0.58 percent.
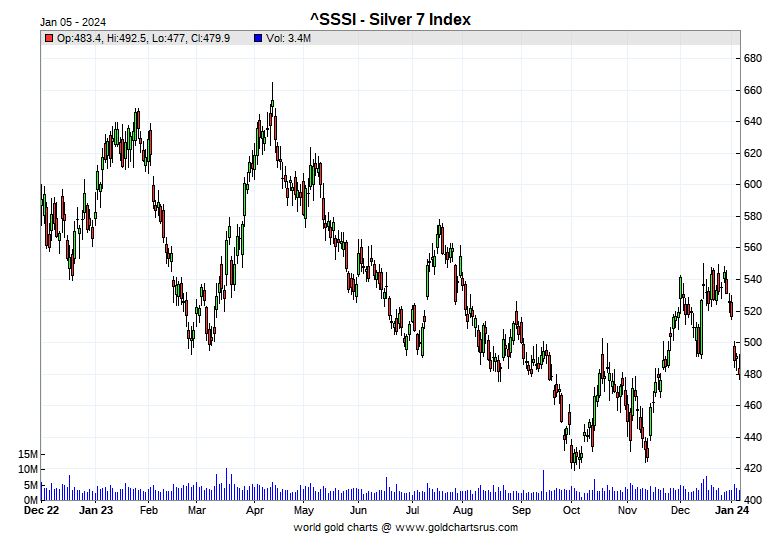
Here's Nick's old 1-year Silver Sentiment/Silver 7 Index chart, updated with Friday's candle -- and it wasn't helped at all by Peñoles, as it close down a whopping 9.44 percent, but only on 956 shares traded. Click to enlarge.

The star was Endeavour Silver, as it closed up 1.65 percent -- and the biggest underperformer by far was Coeur Mining, as it closed down 2.75 percent.
The reddit.com/Wallstreetsilver website, now under 'new' but not improved management, is linked here. The link to two other silver forums are here -- and here.
Here is one of the usual three charts that appear in every weekend missive. They show the changes in gold, silver, platinum and palladium in both percent and dollar and cents terms, as of their Friday closes in New York — along with the changes in the HUI and the old Silver 7 Index.
There's no weekly chart, as Nick's data covers the last five trading sessions, which would include last Friday's data because of the New Year's holiday on Monday...making it useless.
Here's the month-to-date chart -- and because of the current and ongoing 'wash, rinse & spin' cycle, it's wall-to-wall red. Everything got pounded, with palladium being the stand out. Click to enlarge.
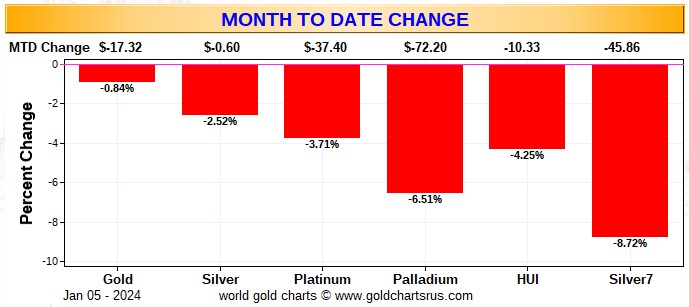
There's no year-to-date chart either, as for this one month only, the month-to-date chart does double duty.
Of course -- and as I mention in this spot every Saturday -- and will continue to do so...is that if the silver price was sitting within 2 percent of its old high of $50 the ounce...like gold is currently sitting within 2 percent of its old high of around $2,075...it's a given that the silver equities would be outperforming their golden cousins by an absolute country mile.
The CME Daily Delivery Report for Day 6 of January deliveries showed that only 10 gold -- and 1 silver contract were posted for delivery within the COMEX-approved depositories on Tuesday.
In gold, the two short/issuers were Morgan Stanley and Advantage, as they issued 8 and 2 contracts respectively...Morgan Stanley from their house account. The largest of the four long/stoppers was JPMorgan, picking up 6 contracts for clients.
In silver, the lone short/issuer was ADM -- and the sole long stopper was JPMorgan...with both transactions involving their respective client accounts.
In platinum, there were 38 contracts issued and stopped. JPMorgan issued all of them out of their client account -- and also stopped 21 of those for clients as well.
The link to yesterday's Issuers and Stoppers Report is here.
So far in January there have been 2,778 gold contracts issued/reissued and stopped -- and in silver, that number is a 516 contracts. For platinum it's 898 contracts -- and for palladium...21.
And it should be noted that of the 516 silver contracts issued and stopped so far in January, JPMorgan has picked up 498 of them for clients...96.5% of the total.
The CME Preliminary Report for the Friday trading session showed that gold open interest in January fell by 72 contracts, leaving just 55 left, minus the 10 contracts mentioned a bunch of paragraphs ago. Thursday's Daily Delivery Report showed that 82 gold contracts were actually posted for delivery on Monday, so that means that 82-72=10 more gold contracts just got added to January deliveries -- and those are mostly likely the same 10 contracts going out for delivery on Tuesday.
Silver o.i. in January declined by 9 contracts, leaving 451 still open, minus the 1 contract mentioned a bunch of paragraphs ago. Thursday's Daily Delivery Report showed that 10 silver contracts were actually posted for delivery on Monday, so that means that 10-9=1 more silver contract was added to January deliveries -- and that lone contract is likely to be the same contract mentioned in the above Daily Delivery Report as well.
Total gold open interest at the close on Friday rose by a net 2,191 COMEX contracts -- and total silver o.i. fell by 971 COMEX contracts. Both these numbers are subject to some revision by the time the final figures are posted on the CME's website later on Monday morning CST.
Open interest in the one-thousand troy ounce good delivery bar micro silver futures contract remains unchanged at 866 contracts...173 COMEX contracts worth.
After no change on Thursday, the withdrawals from GLD continued on Friday, as an authorized participant removed 148,263 troy ounces of gold. There was yet another withdrawal from SLV, as an authorized participant took out 1,602,076 troy ounces of silver.
Since December 18th, there have been eight consecutive withdrawals from SLV totalling 9,022,944 troy ounces. These withdrawals have only two causes, with the most likely one being that the silver was shipped out, as it was more desperately needed elsewhere...or SLV shares were redeemed for physical metal by deep-pocket investors.
In other gold and silver ETFs and mutual funds on Planet Earth on Friday, net of any changes in COMEX, GLD and SLV inventories, there were a net 94,994 troy ounces of gold taken out -- and a net and tiny 4,592 troy ounces of silver were removed as well. The biggest movements in silver were the 350,805 troy ounces added to iShares/SVR -- and the 150,000 troy ounces removed from UBS.
There was no sales report from the U.S. Mint.
So far in this New Year, the mint has sold 59,500 troy ounces of gold eagles...23,000 one-ounce 24K gold buffaloes -- and 3,179,000 silver eagles.
The only activity in gold over at the COMEX-approved depositories on the U.S. east coast on Thursday were the 482.265 troy ounces/15 kilobars that were transferred from the Registered category and back into Eligible over at JPMorgan. The link to this is here.
But it was another monster day in silver, as 1,212,306 troy ounces were reported received -- and 596,406 troy ounces were shipped out.
In the 'in' category, the largest amount by a country mile were the two truckloads/1,188,682 troy ounces that were dropped off at Brink's, Inc...with the remaining 23,624 troy ounces ending up at CNT.
The largest 'out' amount was the one truckload...588,214 troy ounces...that departed Manfra, Tordella & Brookes, Inc...with the remaining 8,191 troy ounces leaving Delaware.
But the real action was in paper -- and all of it from the Registered category and back into Eligible. The lion's share by far were the 4,177,797 troy ounces that made that trip over at Asahi...with the remaining 196,124 making that same trip over at Manfra, Tordella & Brookes, Inc.
The link to all of Thursday COMEX action in silver, is here.
There wasn't much activity over at the COMEX-approved gold kilobar depositories in Hong Kong on their Thursday...but what action there was, took place over at Brink's, Inc. as usual. They reported receiving 309 kilobars -- and shipped out 81 of them. The link to this, in troy ounces, is here.
Here are the usual 20-year charts that show up in this space in every Saturday column. They show the total amounts of physical gold and silver held in all know depositories, ETFs and mutual funds as of the close of business on Friday.
During the week just past, there were a net 630,000 troy ounces of gold removed -- but a net and tiny 41,000 troy ounces of silver were added....which [for the second week in a row] was almost entirely due to the difference between the silver that arrived at the COMEX -- and what departed SLV.
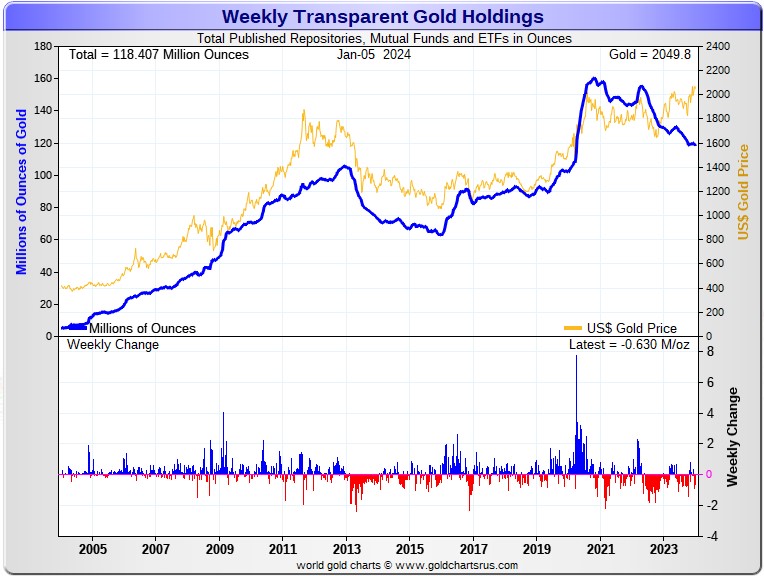
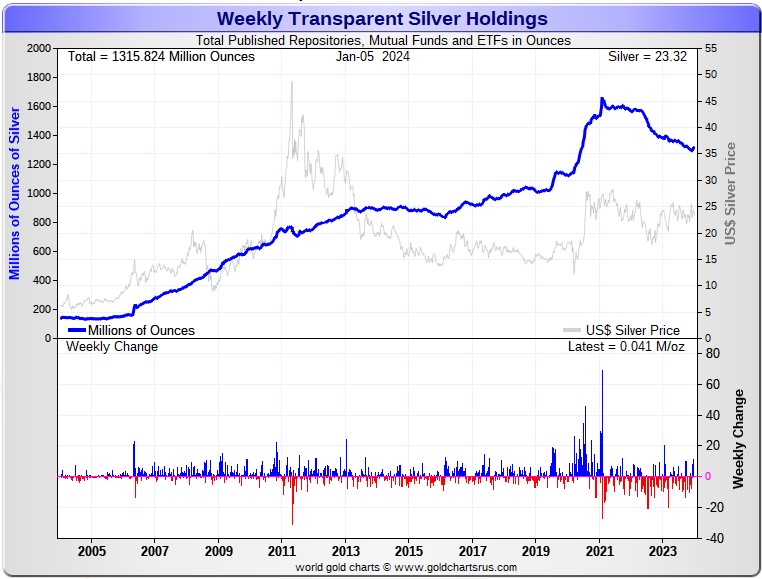
According to Nick Laird's data on his website, there were a net 1.795 million troy ounces of gold removed -- but a net 20.400 million troy ounces of silver were added to all the world's known depositories, mutual funds and ETFs during the last four weeks.
In gold, the only two showing deposits were Deutsche Bank and Japan's Physical AU fund, as they added 148,000 and 33,500 troy ounces respectively during that time period. The largest 'out' amount were the 508,000 troy ounces that left XetraGold -- and in second place were the 364,000 troy ounces that departed the COMEX. In third and fourth place was iShares/SGLN and SPDR/GLD, showing 331,000 and 322,000 troy ounces removed. The 'out' list goes on and on.
In silver, the largest two 'in' amounts were the COMEX, as they received 14.208 million troy ounces -- and the net 6.196 million troy ounces added to ZKB because of that take-over of a smaller silver ETF a few weeks back. In third spot were the 3.151 million troy ounces that were deposited in iShares/SVR. The largest 'out' amount were the 775,000 troy ounces taken out of UBS...followed closely by the 732,000 troy ounces that departed ETF Securities/SIVR. In third and fourth place were the 481,000 and 369,000 troy ounces that were shipped out of BullionVault and iShares/SLV respectively. The list goes on and on there too...
For the most part, retail bullion sales remain comatose. At the moment, they have a lot of inventory of everything. But as I keep saying, when retail investment demand really gets serious once again, it will be back to shortages/back orders and high premiums very quickly. And that's not taking into account the mind-boggling quantities of silver that will be required by all the silver ETFs and mutual funds.
Where will all this physical metal come from in the face of this ongoing and structural physical deficit, one has to wonder, as it just won't be there at some point...although JPMorgan & Friends are sitting on a goodly amount of the stuff according to Ted. And as he stated very recently, it would appear that they have parted with about 500 million troy ounces of silver over the last three years, of the one billion troy ounces that they'd accumulated since 2011.
The physical demand in silver at the wholesale level continues unabated -- and shows absolutely no signs of slowing down. Almost all of what's left in the various public ETFs and mutual funds is not available for sale...including the COMEX, where new silver has to be brought in from other sources [JPMorgan] to meet the ongoing demand for physical metal...like what's been happening all this week and last in SLV as well. This will continue until available supplies are depleted...which will be the moment that JPMorgan stops selling into the ongoing structural deficit.
The vast majority of precious metals being held in these depositories are by those who won't be selling until the silver price is many multiples of what it is today. That's particularly true of shareholders in PSLV -- and that's despite the fact that there was a 240,000 troy ounce redemption earlier this week.
Sprott's PSLV is the third largest depository of silver on Planet Earth with 170 million troy ounces -- and some distance behind the COMEX, where there are 281 million troy ounces being held. [However, as Ted Butler mentions from time to time, it's most likely that 103 million troy ounces of that amount is actually held in trust for SLV -- and his letter to the SEC and CFTC of two months ago on this issue has received a noncommittal response from the SEC -- and nothing at all from the CFTC. But PSLV is still some distance behind SLV, as they are the largest silver depository, with 434 million troy ounces as of Friday's close.
The latest short report from Wednesday, December 27th showed that the short position in SLV declined by a tiny 3.45%...down to 17.71 million shares sold short. If you remember, BlackRock issued a warning a couple of years ago to all those short SLV, that there might come a time when there wouldn't be enough metal for them to cover. That would only be true if JPMorgan decides not to supply it.
The next short report will be posted on The Wall Street Journal's website on Wednesday, January 10.
Then there's that other little matter of the 1-billion ounce short position in silver held by Bank of America in the OTC market...with JPMorgan & Friends on the long side. Ted says it hasn't gone away -- and he's also come to the conclusion that they're now short around 30 million ounces of gold with these same parties as well...down 7 million oz. from the 37 million they were short in the June OCC Report. The latest report from the OCC for Q3/2023 came out a few weeks ago -- and based on what was in it, Ted hasn't changed his mind on this one iota.
The Commitment of Traders Report, for positions held at the close of COMEX trading on Tuesday, showed a small increase in the commercial net short position in gold -- and a small decrease in the commercial net short position in silver...which was all because of Ted's raptors adding to their long positions, which isn't a decrease at all, something you already know.
In silver, the Commercial net short position declined by 2,075 COMEX contracts, or 10.375 million troy ounces of the stuff.
They arrived at that number by increasing their long position by 1,718 contracts -- and also reduced their short position by 357 COMEX contracts. It's the sum of those two numbers that represents their change for the reporting week.
Under the hood in the Disaggregated COT Report, the Managed Money traders reduced their net long position by 740 contracts...which they accomplished by adding 1,878 long contracts and 2,618 short contracts. It's the difference between those two numbers that represents their change for the reporting week.
Ted was surprised that they added long contracts as the silver price was engineered lower during the reporting week -- and I was surprised by the fact that they added all those short contracts without having yet penetrated any moving averages to the downside. Go figure.
The Nonreportable/small traders were also sellers during the reporting week, the major sellers in fact, as the reduced their net long position by 2,782 COMEX contracts. The traders in the Other Reportables category had to have been net buyers -- and there were, as they increased their net long position by 1,447 contracts.
Doing the math: 740 plus 2,782 minus 1,447 equals 2,075 COMEX contracts, the change in the commercial net short position.
The Commercial net short position in silver now stands at 50,547 COMEX contracts/252.74 million troy ounces...down those 2,075 contracts from the 52,622 COMEX contracts/263.11 million troy ounces they were short in the December 26 COT Report.
The Big 4 shorts decreased their short position by a tiny 72 contracts to 45,132 contracts, down from the 45,204 contracts they were short in last Friday's COT Report.
The Big '5 through 8' short increased their net short position during the reporting week...but only an equally tiny 202 contracts...from the 18,660 contracts in last week's report, up to 18,862 in this week's COT Report.
Ted is still of the opinion that there's a Managed Money traders in the No. 7 or 8 spot...most likely the latter -- and that they didn't do much during the reporting week...still short around 3,000 COMEX contracts.
The Big 8 shorts in total increased their net short position from 63,864 contracts, up to 63,994 COMEX contracts week-over-week...an increase of only 130 contracts. But the Big 8 commercial shorts number is overstated by those approximately 3,000 contracts held by that Managed Money short, so that has to be subtracted out...leaving the Big 8 commercial traders short around 61,000 contracts.
Ted's raptors, the small commercial traders other than the Big 8...as mentioned earlier...were the big buyers during the reporting week, increasing their long position by around 2,200 contracts...leaving them net long around 10,500 contracts...net of that 3,000 contract non-technical managed money short position.
Don't forget, that despite their small size, they're still commercial traders in the commercial category -- and all in the Swap Dealers category.
Here's Nick's 3-year COT Report for silver, updated with the above data. Click to enlarge.
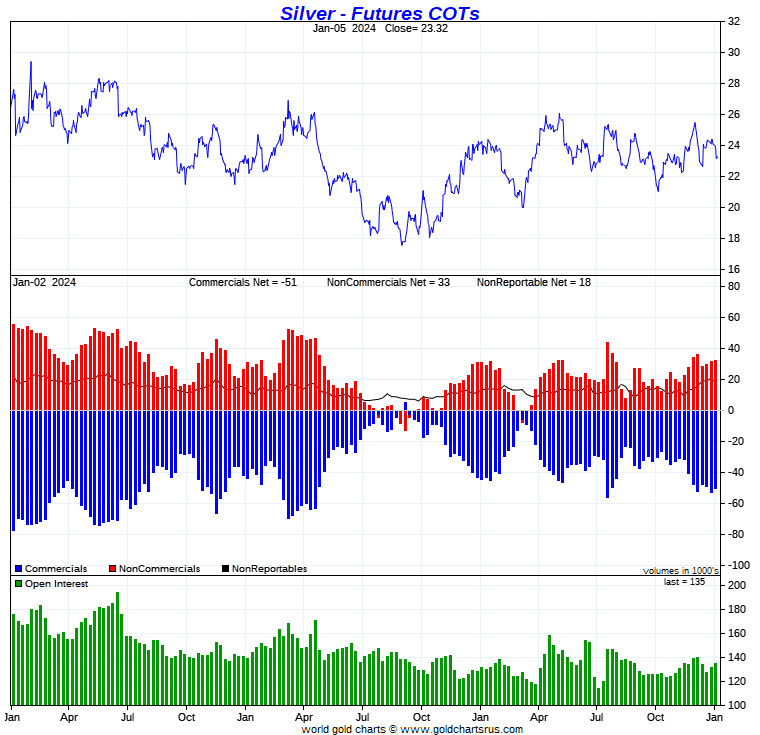
The Big 4/8 shorts made only microscopic changes to their short positions during the reporting week -- and it was all that long-buying by Ted's raptors, the commercial traders other than the Big 8 shorts, that accounted for the decrease in the Commercial net short position.
As you know, their buying [or selling] of long contracts has the mathematical effect of increasing [or decreasing] the Commercial net short position...which means nothing. Only what the Big 4/8 commercial shorts are doing is what matters.
Of course, as I mentioned in Friday's column, the above data is very much 'yesterday's news' after the two big engineered down days that occurred on Wednesday and Thursday, the days after the cut-off.
I was more than surprised that 'da boyz' didn't do much on Tuesday, considering the fact that they had that equally engineered and dramatic short covering rally in the DXY as a tail wind. I'm now of the opinion that they waited until after the Tuesday cut-off so that their shenanigans wouldn't show up in yesterday's COT Report...a little trick of theirs that they pull off once in a while when they're trying to hide their tracks for as long as possible.
Silver remains in a mostly market neutral to slightly bearish state from a COMEX futures market perspective. But not anywhere near as bad as the bearish configuration that currently exists in gold.
In gold, the commercial net short position in it increased by 3,133 COMEX contracts -- and it was all the Big 4 commercial shorts/banks that were responsible for the change.
The commercial traders arrived at this number by adding 2,853 long contracts, but also went short 5,986 COMEX contracts -- and it's the difference between those two numbers that represents their change for the reporting week.
Under the hood in the Disaggregated COT Report the Managed Money traders increased their net long position by 2,695 COMEX contracts -- and the traders in the Nonreportable/small trader category also increased their net long position...them by 3,202 contracts. In order to balance things out, the traders in the Other Reportables category had to have been sellers -- and they were, decreasing their net long position by 2,764 COMEX contracts.
Doing the math: 2,695 plus 3,202 minus 2,764 equals 3,133 COMEX contracts, the change in the commercial net short position.
The commercial net short position in gold now sits at 235,478 contracts/23.548 million troy ounces of the stuff...up those 3,133 contracts from the 232,345 contracts/23.235 million troy ounces they were short in the December 26 COT Report.
The Big 4 shorts increased their net short position by 4,325 contracts, from 153,790 contracts, up to 158,515 contracts.
But the Big '5 through 8' shorts decreased their short position for the second week in a row, from the 75,667 contracts they held short in the December 26 COT Report, down to 74,554 contracts held short in the current COT Report...a drop of 1,113 COMEX contracts.
The Big 8 commercial short position increased from 229,457 contracts/22.946 million troy ounces, up to 232,669 contracts/23.267 million troy ounces...an increase of 3,212 COMEX contracts.
Ted's raptors, the small commercial traders other than the Big shorts, sat on their hands during the reporting week....reducing their net long position by an irrelevant 79 COMEX contracts and, for the second week in a row, remain net short gold by 2,809 contracts. Ted says it's been almost two years since these raptors have been short this precious metal -- and it's never a bullish sign when they are.
And whether the raptors are prepared to go short gold even more if its rally progresses from here, remains to be seen -- as they have shown no reluctance to short it in the past by even larger amounts than they're short now. However, that doesn't apply to silver, as they've rarely ever go short that precious metal.
Don't forget that despite their small size, the raptors are still commercial traders in the commercial category -- and are in direct competition with the Big 4/8 shorts. That applies to silver as well.
Here's Nick Laird's 3-year COT Report chart for gold, updated with the above data. Click to enlarge.
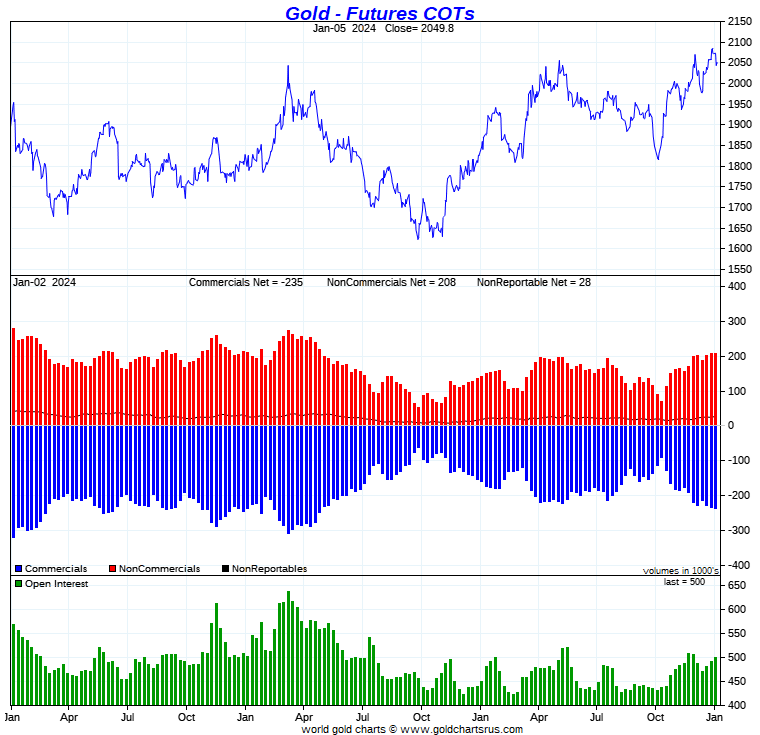
Although there has been some improvement in the commercial net short position in gold since the Tuesday cut-off, no moving averages of importance have yet been penetrated to the downside.
To clean out the Managed Money traders, the collusive commercial shorts would have to peel off about 50,000 contracts -- and a bit over $200 in the gold price to get back to the lows we saw in early October of last year.
Can they, or will they, remains the question of the day.
And, unfortunately, as Ted correctly points, if 'da boyz' slam gold, they'll certainly take silver with it.
For those reasons stated, the commercial net short position from a COMEX futures market perspective remains very firmly embedded in bearish territory.
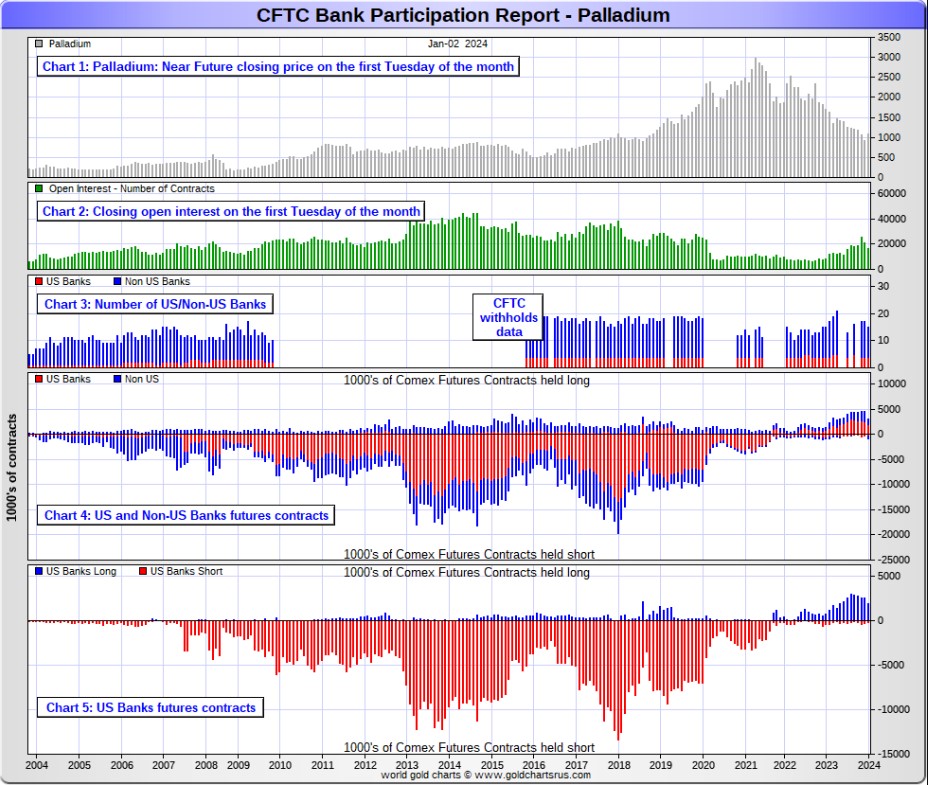
In the other metals, the Managed Money traders in palladium actually increased their net short position by 427 COMEX contracts. I was expecting a huge decrease considering the size of the engineered price decline during the reporting week. They are now net short palladium by a very hefty 6,342 contracts...39 percent of total open interest. The commercial traders remain very net long palladium in both categories...especially the Swap Dealers. The traders in the Other Reportables and the Nonreportable/small traders remain net short palladium...especially the traders in the former category.
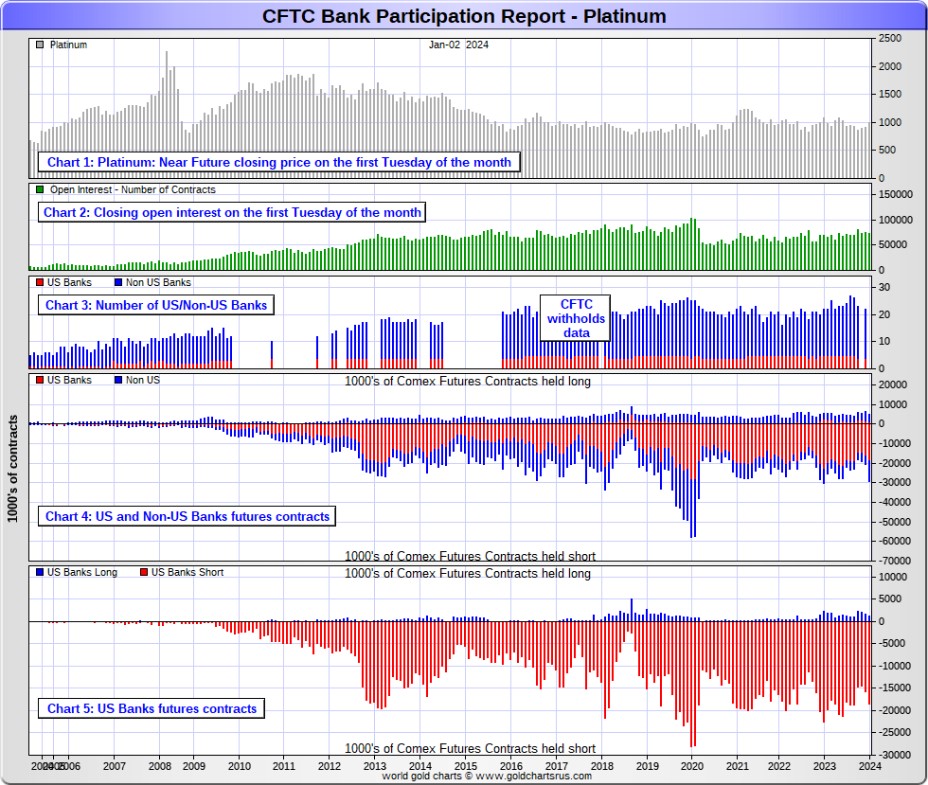
In platinum, the Managed Money traders increased their net long position by a further 6,705 COMEX contracts during the reporting week -- and are net long platinum by an eye-watering 23,262 COMEX contracts. As of this report, both the Producer/Merchant and Swap Dealers are both net short platinum at the moment, with the former being mega net short to the tune of 32,022 contracts -- and it's the world's bank that went short against those Managed Money traders big time, as you'll see in today's Bank Participation Report. The traders in the Other Reportables and Nonreportable/small traders remain net long platinum by very decent amounts.
In copper, the Managed Money traders decreased their net long position by a further 5,509 contracts -- and are still net long copper by 8,689 COMEX contracts...about 217 million pounds of the stuff as of the January 2 COT Report...compared to the 355 million pounds they were net long in last Friday's COT Report.
Copper, like platinum, continues to be a wildly bifurcated market in the commercial category. The Producer/Merchant category is net short 40,052 copper contracts -- and the Swap Dealers are net long 28,414 COMEX contracts.
Whether this means anything or not, will only be known in the fullness of time. Ted says it doesn't mean anything as far as he's concerned, as they're all commercial traders in the commercial category. However, this bifurcation has been in place for as many years as I can remember -- and that's a lot.
In this vital industrial commodity, the world's banks...both U.S. and foreign... are net long 11.5 percent of the total open interest in copper in the COMEX futures market as shown in the January Bank Participation Report that came out yesterday...down from the 12.5 percent they were net long in December's. At the moment it's the commodity trading houses such as Glencore and Trafigura et al., along with some hedge funds, that are net short copper in the Producer/Merchant category, as the Swap Dealers are mega net long, as pointed out above.
The next Bank Participation Report is due out on Friday, February 9.
Here’s Nick Laird’s “Days to Cover” chart, updated with the COT data for positions held at the close of COMEX trading on Tuesday, January 2. It shows the days of world production that it would take to cover the short positions of the Big 4 — and Big '5 through 8' traders in every physically traded commodity on the COMEX. Click to enlarge.
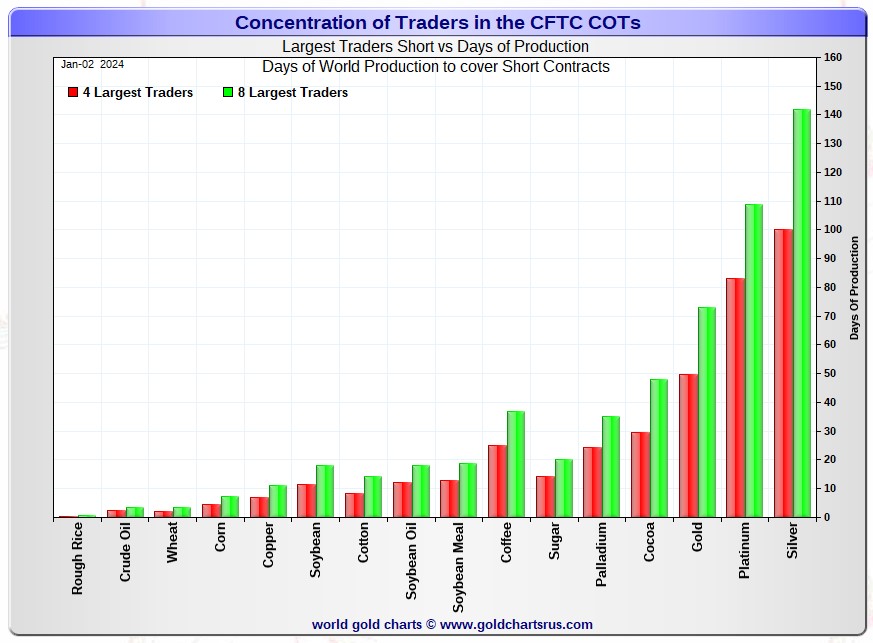
In this week's data, the Big 4 traders are short about 100 days of world silver production...unchanged from last week. The ‘5 through 8’ large traders are short an additional 42 days of world silver production...also unchanged from last week, for a total of about 142 days that the Big 8 are short -- and obviously unchanged from last week's report.
These 'unchanged' numbers should be no big surprise, as the Big 4/8 shorts only increased or decreased their short positions by negligible amounts [130 COMEX net contracts] during the reporting week...as per the above COT Report.
Those 142 days that the Big 8 traders are short, represents about 4.7 months of world silver production, or 319.97 million troy ounces/63,994 COMEX contracts of paper silver held short by these eight mostly all commercial traders. Several of the largest of these are now non-banking entities, as per Ted's discovery a year or so ago. This latest January Bank Participation Report continues to confirm that this is still the case -- and not just in silver, either.
Ted's raptors, the small commercial traders other than the Big 8, increased their long position during the reporting week by around 2,200 COMEX contracts -- and remain long about 10,400 contracts, once that managed money trader's 3,000 contract short position is removed.
In gold, the Big 4 are short about 50 days of world gold production...up 2 days from last week's COT Report. The '5 through 8' are short 23 days of world production, down 1 day from last week...for a total of 73 days of world gold production held short by the Big 8 -- and obviously up 1 day from last Friday's COT Report.
The Big 8 commercial traders are short 47.5 percent of the entire open interest in silver in the COMEX futures market as of yesterday's COT Report, down a bit from the 48.6 percent that they were short in the December 26 COT Report -- and that's all a result of an increase in total open interest of 3,317 contracts...nothing that the Big 8 did. And once whatever market-neutral spread trades they have on are subtracted out, the percentage they are short silver would be something under the 55 percent of total open interest. In gold, it's 46.5 percent of the total COMEX open interest that the Big 8 are short, down an insignificant amount from the 46.7 percent they were short in the December 26 COT Report -- and also a bit under the 55 percent mark once their market-neutral spread trades are subtracted out.
And as also mentioned earlier, Ted is still of the opinion that Bank of America is short about one billion ounces of silver in the OTC market, courtesy of JPMorgan & Friends. He's also of the opinion that they're short 30 million troy ounces of gold as well. And with the latest OCC Report in hand for Q3/2023 that came out recently...he hasn't changed his mind one bit on that.
As reported further up, the short position in SLV now sits at 17.71 million shares as of Wednesday's short report...down 3.45% from 18.34 million shares sold short in the prior report.
The situation regarding the Big 4/8 commercial short position in gold and silver is still obscene -- and even more so in gold as of yesterday's COT Report which, as you know, is already so 'yesterday's news'.
As Ted has been pointing out ad nauseam forever, the resolution of the Big 4/8 short positions will be the sole determinant of precious metal prices going forward -- which should now be obvious to all, except for those whose jobs/careers and so-called 'reputations' depend upon them not seeing it.
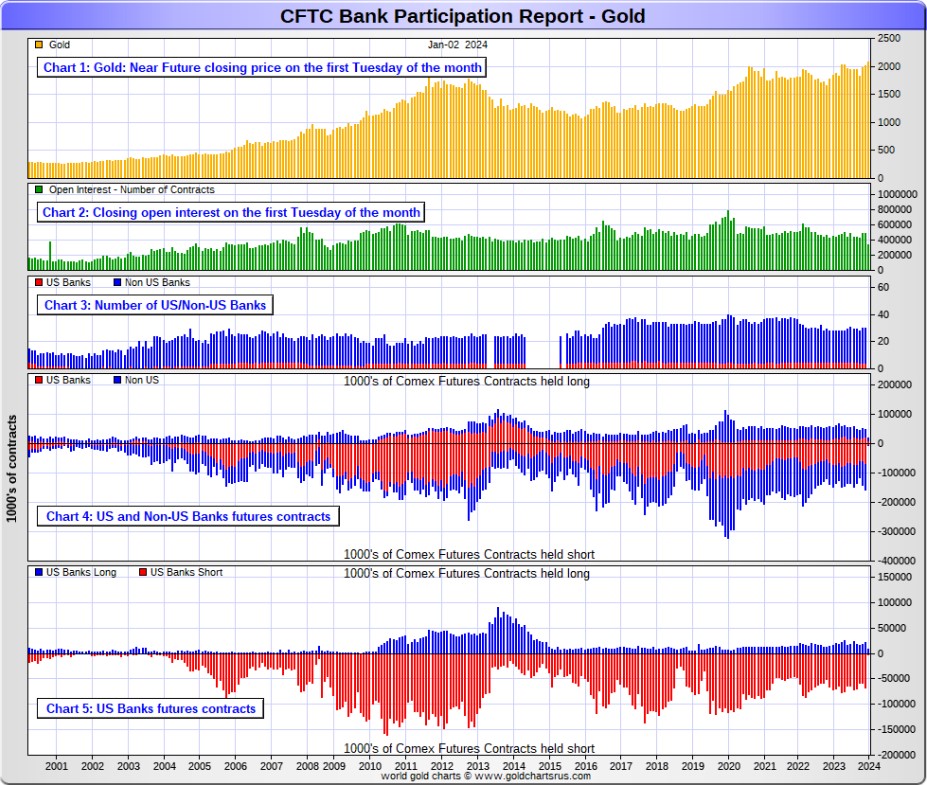
The January Bank Participation Report [BPR] data is extracted directly from yesterday's Commitment of Traders Report. It shows the number of futures contracts, both long and short, that are held by all the U.S. and non-U.S. banks as of this past Tuesday’s cut-off in all COMEX-traded products.
For this one day a month we get to see what the world’s banks have been up to in the precious metals. They’re usually up to quite a bit -- and they were... with the standout being platinum.
[The January Bank Participation Report covers the four-week time period from December 5 to January 2 inclusive]
In gold, 4 U.S. banks are net short 47,523 COMEX contracts, up 1,217 contracts from the 46,306 contracts that these same 4 U.S. banks were short in December's BPR...not a big change.
Also in gold, 25 non-U.S. banks are net short 56,984 COMEX contracts, down 5,495 contracts from the 62,479 contracts that 26 non-U.S. banks were short in December's BPR. During the last three months these non-U.S. banks have added a net 30,200 short contracts in gold.
At the low back in the August 2018 BPR...these same non-U.S. banks held a net short position in gold of only 1,960 contacts -- so they've been back on the short side in an enormous way ever since.
Although some of the largest U.S. and foreign bullion banks are in the Big 8 short category in gold, some of the hedge fund/commodity trading houses are short equal if not more grotesque amounts of gold than the banks...as mentioned further down. It's also a strong possibility that the BIS could be short gold in the COMEX futures market as well.
As of January's Bank Participation Report, 29 banks [both U.S. and foreign] are net short only 20.9 percent of the entire open interest in gold in the COMEX futures market...down from the 22.3 percent that 30 banks were net short in the December BPR.
That 20.9 percent is a fairly small number.
But it should be pointed out that the Big 8 commercial traders in gold are short 46.5% of total open interest...so that leaves some non-banking entities short the remaining [46.5 minus 20.9] = 25.6 percentage points....which is even more obscene than the 20.9% held short by the largest banks in the Big 8 category.
Here’s Nick’s BPR chart for gold going back to 2000. Charts #4 and #5 are the key ones here. Note the blow-out in the short positions of the non-U.S. banks [the blue bars in chart #4] when Scotiabank’s COMEX short position was outed by the CFTC in October of 2012. Click to enlarge.
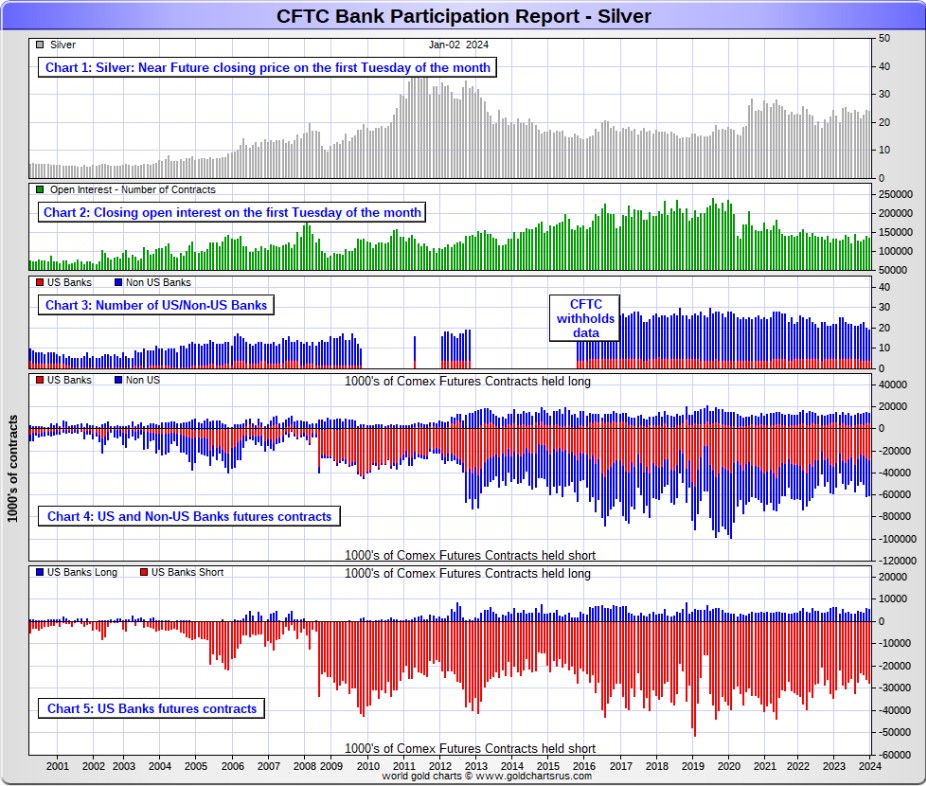
In silver, 4 U.S. banks are net short 22,204 COMEX contracts, up 2,062 contracts from the 20,142 contracts that these same 4 U.S. banks were short in the December BPR.
The biggest short holders in silver of the five U.S. banks in total, would be Citigroup, Wells Fargo, Bank of America, Morgan Stanley...and maybe Goldman Sachs -- and also JPMorgan from time to time.
And, like in gold, I have my suspicions about the Exchange Stabilization Fund's role in all this...although, also like in gold, not directly.
Also in silver, 15 non-U.S. banks are net short 23,782 COMEX contracts, down 2,465 contracts from the 26,247 contracts that 16 non-U.S. banks were short in the December BPR.
I would suspect that HSBC, Barclays and Standard Chartered hold by far the lion's share of the short position of these non-U.S. banks...as does Canada's Scotiabank/Scotia Capital still. And, like in gold, the BIS could also be actively shorting silver as well. The remaining short positions divided up between the other 10 or so non-U.S. banks are immaterial — and have always been so. The same can be said of most of the 25 non-U.S. banks in gold as well.
As of January's Bank Participation Report, 19 banks [both U.S. and foreign] are net short 34.1 percent of the entire open interest in the COMEX futures market in silver — up a bit from the 33.2 percent that 20 banks were net short in the December BPR...with all of that percentage increase coming because of a big drop in total open interest month over month.
That 34.1 percent is a larger number than the 20.9 percent in gold. The Big 8 are short 47.5 percent of the total open interest in silver...so the hedge funds and trading houses are only short [47.5 minus 34.1 =13.4 percentage points] of total open interest between them, which is still a decent amount. But the short positions of the banks in silver are almost three times as large as those held by the hedge funds and commodity trading houses.
Here’s the BPR chart for silver. Note in Chart #4 the blow-out in the non-U.S. bank short position [blue bars] in October of 2012 when Scotiabank was brought in from the cold. Also note August 2008 when JPMorgan took over the silver short position of Bear Stearns—the red bars. It’s very noticeable in Chart #4—and really stands out like the proverbial sore thumb it is in chart #5. Click to enlarge.
In platinum, '3 or less' U.S. banks are net short 17,141 COMEX contracts in the January BPR, up a hefty 3,054 contracts from the 14,087 contracts that 4 U.S. banks were short in the December BPR.
At the 'low' back in September of 2018, these U.S. banks were actually net long the platinum market by 2,573 contracts. So they have a very long way to go to get back to just market neutral in platinum...if they ever intend to, that is. They look permanently stuck on the short side to me, a fact that I point out regularly.
Also in platinum, '19 or more' non-U.S. banks increased their net short position by a knee-wobbling 7,231 contracts...up 7,196 contracts from the piddling 35 contracts that 18 non-U.S. banks were net short in the December BPR.
It was the direct intervention by the bullion banks that killed that big short covering rally in December...no other reason.
In this past month, the non-U.S. banks have gone from being non-entities in the COMEX futures market in platinum, to being major players on the short side.
Platinum remains the big commercial shorts No. 2 problem child after silver... but a very distant No. 2 down the list. How it will ultimately be resolved is unknown, but most likely in a paper short squeeze, as the known stocks of platinum are minuscule compared to the size of the short positions held -- and that's just the short positions of the world's banks I'm talking about.
And as of January's Bank Participation Report, 18 banks [both U.S. and foreign] were net short 33.0 percent of platinum's total open interest in the COMEX futures market, which is up huge from the 18.7 percent that 22 banks were net short in December's BPR. That fact is certainly obvious on the chart below.
Here's the Bank Participation Report chart for platinum. Click to enlarge.
In palladium, 4 U.S. banks are net long 1,716 COMEX contracts in January's BPR, down from the 2,204 contracts that these same 4 U.S. banks were net long in the December BPR.
Also in palladium, 11 non-U.S. banks are net long 435 COMEX contracts, down from the 1,964 contracts that 13 non-U.S. banks were net long in the December BPR.
It should be obvious that like in platinum, the world's banks sold enough of their long positions to kill the short-covering rally in palladium late last month.
And as I've been commenting on for almost forever, the COMEX futures market in palladium is a market in name only, because it's so illiquid and thinly-traded. Its total open interest in yesterday's COT Report was only 16,345 contracts...compared to 73,883 contracts of total open interest in platinum...134,725 contracts in silver -- and 500,364 COMEX contracts in gold.
As I say in this spot every month, the only reason that there's a futures market at all in palladium, is so that the Big 8 commercial traders can control its price. That's all there is, there ain't no more -- and that was on full display in this report.
As of this Bank Participation Report, 15 banks [both U.S. and foreign] are net long 13.2 percent of the entire COMEX open interest in palladium... down from the 19.6 percent of total open interest that 17 banks were net long in the December BPR.
For the last 3+ years, the world's banks have not been involved in the palladium market in a material way. And with them still net long by decent amounts, it's all hedge funds and commodity trading houses that are left on the short side. The Big 8 commercial traders, none of which are banks, are short 39.8 percent of total open interest in palladium as of yesterday's COT Report.
Here’s the palladium BPR chart. Although the world's banks are net long at the moment, it remains to be seen if they return as big short sellers again at some point like they've done in the past. Click to enlarge.
Excluding palladium for obvious reasons, and almost all of the non-U.S. banks in gold and silver...only a small handful of the world's banks, most likely no more than 5 or so in total -- and mostly U.S.-based, except for HSBC, Barclays, Standard Chartered -- and most likely the BIS...continue to have meaningful short positions in the other three precious metals.
As I pointed out above, some of the world's commodity trading houses and hedge funds are also mega net short the four precious metals...far more short than the U.S. banks in some cases. They have the ability to affect prices if they choose to exercise it...which I'm sure they're doing at times. But it's still the big bullion banks at Ground Zero of the price management scheme.
And as has been the case for years now, the short positions held by these Big 4/8 traders, is the only thing that matters...especially the short positions of the Big 4...or even the Big 1 or 2. How this is ultimately resolved [as Ted said earlier] will be the sole determinant of precious metal prices going forward.
The Big 8 commercial traders, along with Ted's raptors...the small commercial traders other than the Big 8 commercial shorts...continue to have an iron grip on their respective prices -- until they either relinquish control voluntarily, or are told to step aside.
However, considering the current state of affairs of the world's banking and financial system as it stands today -- and the structural deficit in silver -- the chance that these big bullion banks and commodity trading houses could get overrun at some point, is not zero -- and certainly within the realm of possibility if things go totally non-linear.
And as Ted keeps reminding us from time to time, if they do finally get overrun...it will be for the very first time...which obviously wasn't allowed to happen this past week, either.
I have a fairly decent number of stories, articles and videos for you today.
CRITICAL READS
U.S. payrolls increased by 216,000 in December, much better than expected
The U.S. labor market closed out 2023 in strong shape as the pace of hiring was even more powerful than expected, the Labor Department reported Friday.
December’s jobs report showed employers added 216,000 positions for the month while the unemployment rate held at 3.7%. Payroll growth showed a sizeable gain from November’s downwardly revised 173,000. October also was revised lower, to 105,000 from 150,000, indicating a slightly less robust picture for growth in the fourth quarter.
Economists surveyed by Dow Jones had been looking for payrolls to increase 170,000 and the unemployment rate to nudge higher to 3.8%.
A more encompassing unemployment measure that includes discouraged workers and those holding part-time jobs for economic reasons edged higher to 7.1%. That increase in the “real” unemployment rate came as the household survey, used to calculate the unemployment rate, showed a decline in job holders of 683,000 as the ranks of those working multiple jobs increased by 222,000.
The labor force participation rate, or the share of the civilian working-age population either employed or looking for a job, slid to 62.5%, down 0.3 percentage point to its lowest since February and down 676,000 on a monthly basis.
This news item appeared on the cnbc.com Internet site at 8:31 a.m. on Friday morning EST -- and today's first article comes courtesy of Swedish reader Patrik Ekdahl. Another link to it is here. The Zero Hedge spin on this is headlined "Inside The Catastrophic Jobs Report: Record 1.5 Million Crash In Full-Time Jobs, Multiple Jobholders Soar to Record, Native Born Workers Plunge and Much More" -- and I thank Brad Robertson for sending it. Another link to it is here.
U.S. economy stumbles at year’s end, ISM finds
ISM services index falls to seven-month low of 50.3%
The numbers: A barometer of business conditions at service-oriented companies fell in December to a seven-month low, suggesting a hiccup for the U.S. economy.
The Institute for Supply Management's survey dropped to 50.6% from 52.7% in the prior month.
Numbers over 50% are viewed as positive for the economy. The index ranged between 50% and 55% throughout 2023.
"The services sector had a pullback in the rate of growth in December, attributed to the decrease in the rate of growth for new orders and contraction in employment," said Anthony Nieves, chair of the survey.
"There are concerns related to economic uncertainty, geopolitical events and labor constraints," he added.
Economists by polled by The Wall Street Journal had predicted an ISM reading of 52.5% for the final month of the year.
This marketwatch.com story is posted in the clear at the morningstar.com Internet site. It showed up at 10:22 a.m. EST on Friday morning -- and I thank Swedish reader Patrik Ekdahl for sending it along. Another link to it is here.
U.S. Bankruptcies Jump 18% in 2023 Amid High Interest Rates
Total U.S. bankruptcy filings rose by 18 percent to 445,186 last year, up from 378,390 filings in 2022, according to data from Epiq AACER, a provider of U.S. bankruptcy filing data. This includes both commercial and personal bankruptcy filings until the month of November. “As anticipated, we saw new filings in 2023 increase momentum over 2022 with a significant number of commercial filers leading the expected increase and normalization back to pre-pandemic bankruptcy volumes,” said Michael Hunter, vice president of Epiq AACER.
“We expect the increase in number of consumer and commercial filers seeking bankruptcy protection to continue in 2024 given the runoff of pandemic stimulus, increased cost of funds, higher interest rates, rising delinquency rates, and near historic levels of household debt.”
Overall commercial filings grew to 25,627 last year from the 21,479 registered in the previous year, an increase of 19 percent.
Commercial Chapter 11 filings rose from 3,819 to 6,569, an increase of 72 percent. Chapter 11 bankruptcy filings are made by companies to restructure debt and allow the businesses to retain assets while drafting a plan to pay back what they owe.
Personal bankruptcy filings rose 18 percent to 419,559 in 2023, with Chapter 13 filings increasing by 18 percent and Chapter 7 by 17 percent.
This article from The Epoch Times was picked up Zero Hedge at 2:45 p.m. EST on Friday afternoon -- and I thank Brad Robertson for sharing it with us. Another link to it is here.
A Disastrous Rout -- Bill Bonner
Putting this in perspective, the interest rate cycle – from major high to major low, and back again – began its last round trip about the time we were born. It took rates higher for the first 32 years…and down for the next 40. Why it takes so long, we don’t know…all we know for sure is that interest rates cast a long shadow…and you don’t want to get stuck in the shade.
You may think that this up-cycle in interest rates will end soon, as the Fed begins to cut rates later this year. But down deep, beyond the talking heads and headlines, something has changed. The Fed may cut rates, but the inflation cat is now out of the bag. Additions to the money supply now lead to higher consumer prices, and everyone knows it. And when the Fed resumes its rate-cutting, money-printing fandango, we’ll see inflation begin to rise too. So, it is unlikely that real rates, adjusted for inflation, will see anything like the July 2020 lows again in our lifetimes.
Another ‘megapolitical’ development we are watching is the decline of the US empire. It doesn’t matter what you think or what you want, empires have life cycles too. And it appears to us that the US began the downhill side around 1999. Since then, its wars have been disasters, its GDP growth has been almost cut in half…its politics are a-shamble…and its debt has grown by $28 trillion.
This worthwhile commentary from Bill was posted on his website late on Friday morning EST -- and I thank Roy Stephens for sending it our way. Another link to it is here.
ECB Rate-Cut Odds Tumble as E.U. Inflation Re-Accelerates in December
Eurozone inflation re-accelerated in December, breaking seven months of declines, leaving analysts questioning whether The ECB will be able to cut rates as aggressively as the market had thought.
Euro area headline HICP inflation rose 52bp in December to 2.92% YoY, in line with consensus expectations.
The breakdown by main expenditure categories showed services inflation remained unchanged at 4.0%YoY, and non-energy industrial goods inflation fell four-tenths of a percentage point to 2.5%YoY. Of the non-core components, energy inflation rose 4.8pp to -6.7%YoY, while food, alcohol and tobacco inflation fell eight-tenths of a percentage point to 6.1%YoY.
But, you should just ignore this:
"December's jump in headline inflation in the eurozone was widely anticipated and entirely due to a base-effects driven increase in energy inflation, so it won't alter ECB policymakers' views on the outlook for monetary policy," said Jack Allen-Reynolds, deputy chief eurozone economist at Capital Economics.
Except the market is not, as it prompted the market to cut the odds of a March ECB rate-cut significantly...
This 4-chart Zero Hedge story appeared on their website at 8:17 a.m. on Friday morning EST -- and I thank Brad Robertson for this one as well. Another link to it is here.
China's Shadow-Banking Giant Files For Bankruptcy
One of China's "secretive" shadow-banking giants filed for bankruptcy on Friday due to its inability to repay tens of billions of dollars in debt, a warning sign contagion from the downturn in the real estate industry continues to spread and raises questions if the property crisis in the world's second-largest economy will accelerate into the new year.
2023 has seen China's Shadow Banking system mostly acting as a liquidity-suck (red bars) while corporate bond issuance has barely offset the withdrawals.
Zhongzhi Enterprise Group Co., also called "China's Blackstone," which once oversaw more than 1 trillion yuan ($140 billion) before the property crisis, filed an application for bankruptcy in Beijing's First Intermediate People's Court, according to Bloomberg.
Zhongzhi wrote in a filing that it "obviously" could not repay its debts. A letter to shareholders in November explained its debts total 420 billion yuan to 460 billion yuan ($64.4 billion), compared with assets of 200 billion yuan.
On the Chinese social media platform WeChat, the Beijing court published a statement saying that Zhongzhi's "assets are insufficient to pay off all debts, and it clearly lacks the ability to repay in full."
Zhongzhi was once the most prominent firm in the country's $3 trillion trust industry, which pools savings from wealthy households and corporate clients to make loans and invest in real estate, stocks, bonds, and commodities. The bank first came on our radar last August when it skipped payments on several investment products, sparking rare protests outside its buildings by angry investors.
This Zero Hedge new story put in an appearance on their Internet site at 12:25 p.m. EST on Friday afternoon -- and is yet another offering from Brad Robertson. Another link to it is here. Gregory Mannarino's post market close rant for yesterday is linked here -- and runs for about 22 minutes.
After ending 2001 at $7.45 TN, total mortgage Credit would almost double in six years to close 2007 at $14.61 TN. More pertinent to Issues 2024, Treasury Securities expanded 45% in six years to $8.028 TN – only then to balloon another $22.22 TN, or 276%, to end Q3 2023 at $30.27 TN.
“It should be noted that the stabilizing effect of big government has destabilizing implications in that once borrowers and lenders recognize that the downside instability of profits has decreased there will be an increase in the willingness and ability of business and bankers to debt-finance. If the cash flows to validate debt are virtually guaranteed by the profit implications of big government, then debt-financing of positions in capital assets is encouraged.” Minsky, “Inflation Recession and Economic Policy,” 1982.
“Big government” today includes $2 TN annual fiscal deficits and a central bank with a now long history of market bailouts and open-ended “money” printing (including $5 TN covid stimulus) and liquidity backstopping operations. As for profits, we can think of real economic profits, as well as speculative profits in the asset markets. Big government’s unprecedented measures to inflate both types of profits have for years incentivized risk-taking and leveraging.
A paramount Issue 2024 could be presented simplistically: History’s greatest Bubble either inflates or bursts. As I wrote one year ago, “last year’s Bubble inflation went to perilous extremes. This significantly raised the odds for a destabilizing 2022 bursting episode.” The bottom line: Bubble excess went from “perilous extremes” to precarious “terminal phase” blow-off excess. Highly speculative markets suffered upside dislocations, the type of end-of-cycle dysfunction that has preceded major market collapses (i.e., 1929).
Simplistic analysis does not suffice in today’s extraordinarily complex environment. Not after a spectacular “everything short squeeze” and such systemic market dysfunction. Not in the 16th year of a historic global government finance Bubble. Not after two decades of Financial Arbitrage Capitalism severely disfiguring financial and economic structures. Not with a multi-decade super cycle in transition.
That finance and financial structures evolve from robustness to progressively more fragility is the foundation of Minsky’s Financial Instability Hypothesis.
This long but very worthwhile commentary from Doug appeared on his website shortly after midnight on Saturday morning PST -- and another link to it is here.
Endeavor Mining chief dismissed over $5.9 million 'irregular payment'
Endeavour Mining Plc tumbled after announcing it fired Chief Executive Officer Sébastien de Montessus, citing “serious misconduct” and irregularities tied to the sale of a company asset.
The London-based gold miner removed de Montessus after discovering an alleged “irregular payment instruction” of $5.9 million related to an asset sale, it said in a statement. The company also revealed it recently conducted an external investigation into the CEO’s personal conduct with colleagues, following whistle-blowing allegations from October.
Endeavour, which is backed by Egyptian billionaire Naguib Sawiris, traded 12% lower in London on Friday, after falling 10% in Toronto following the announcement on Thursday. The company has named mining industry veteran and Deputy Chairman Ian Cockerill as CEO.
In a statement on Thursday, De Montessus said that in 2021 he instructed an unnamed creditor of Endeavour to offset an amount owed to the company for essential security equipment, to protect its partners and employees in an unspecified conflict zone.
“The decision had no additional cost to the company and did not benefit me personally in any way,” de Montessus said. “I omitted to inform the board that I had arranged for this offset, which I have freely accepted was a lapse in judgment.”
He said he was given 48 hours’ notice of the concerns and “no proper opportunity” to respond to them before he was fired.
This Bloomberg article was picked up by yahoo.com at 2:07 a.m. PST on Friday morning -- and I found it embedded in a GATA dispatch. Another link to it is here.
Perth Mint's gold and silver sales hit four-year low in 2023
Perth Mint's gold and silver product sales fell in 2023 to their lowest level in four years, according to a Reuters calculation using monthly sales data.
Yearly sales of gold coins and minted bars fell to 665,889 ounces in 2023, down 40% compared to 2022, while silver sales were down 36% from 2022 levels at 14.9 million ounces.
Monthly gold sales in December 2023 dropped to 36,297 ounces, down about 40% year-on-year, and silver sales stood at 681,490 ounces, 58% lower from the same month in 2022, the refiner said on Thursday.
Neil Vance, Perth Mint's General Manager of Minted Products, said the sales in December were affected by slower U.S. demand for gold bullion products, and their Coining Division closing for the year on Dec. 23 led to fewer ounces being shipped.
This very brief Reuters article was picked up the nasdaq.com Internet site at 7:01 EST on Thursday morning -- and I found it on Sharps Pixley. I'll have the charts on this in Tuesday's column. Another link to it is here.
Global Silver Industrial Demand Forecast to Reach New High In 2023
Still, despite weaker demand and a slight drop in supply, the silver market is expected to see a sizable physical deficit in 2023 for the third consecutive year. At 140 Moz, this will be 45% lower than 2022’s all-time high, which is still high by historical standards. Metals Focus believes the deficit will persist in the silver market for the foreseeable future.
On the supply side, global mined silver is anticipated to fall by 2% year-on-year to 820 Moz, driven by lower output from operations in Mexico and Peru. Mexican production is expected to fall by 16 Moz due to a labor strike during the second and third quarters at the Peñasquito mine. Even so, overall production from primary silver mines will still rise this year, driven by the expected ramp-up at the Juanicipio mine in Mexico.
I'm not sure if this is 'new' news from The Silver Institute or not...but it does look/sound familiar. It was posted in Friday's news cycle on Sharps Pixley yesterday -- and I thought it I'd throw it just to be safe. Another link to it is here.
The Photos and the Funnies
On June 18 we headed down to Hope. We've been there countless times -- and I've got just about all the photos of this place that I'll ever need...but I did take a handful -- and here are the first three. The first one was taken at the obligatory stop at Thacker Regional Park in the town. The second is of a foxglove. They've 'escaped' from the local gardens in the town -- and grow just about everywhere along all the roads in the town. This particular specimen is getting pretty long in the tooth. Photos three and four were taken looking down on Kawkawa Lake at the north edge of the town. Click to enlarge.


The WRAP
"Understand this. Things are now in motion that cannot be undone." -- Gandalf the White
Today's pop 'blast from the past' is the debut single by a now well-known British rock band. It reached No. 12 in the U.K. Singles Chart in September 1964, and No. 2 on the Billboard Hot 100 in the United States at the beginning of December 1964. In Canada, it reached No. 2. I was 16 years young at the time.
Rolling Stone magazine ranked it No. 297 on its list of the 500 Greatest Songs of All Time. I'll let you be the judge of that -- and the link is here. Of course there's a bass cover to this -- and it's far more intricate than I ever imagined. The link to that is here.
Today's classical 'blast from the past' is a the very modern end of what I consider to 'classical music'. It's American composer George Gershwin's Concerto in F for solo piano and orchestra, which is closer in form to a traditional concerto than his earlier jazz-influenced Rhapsody in Blue. It was written in 1925 on a commission from the conductor and director Walter Damrosch.
Here yet again is Russian wunderkid Alexander Malofeev at 18 years young tossing it off like it was nothing all. He's accompanied by the Russian National Orchestra -- and Maestro Mikhail Pletnev conducts.
And as one individual stated on youtube.com "Impeccable performance. As a New Yorker, I can feel George Gershwin is smiling on high. Alexander's beauty is inspiring." It's exquisite from start to finish -- and the link is here.
There should be no doubt in anyone's mind that the commercial traders of whatever stripe were at battle stations in both Globex and COMEX trading yesterday -- and that was most obvious when the jobs report was released.
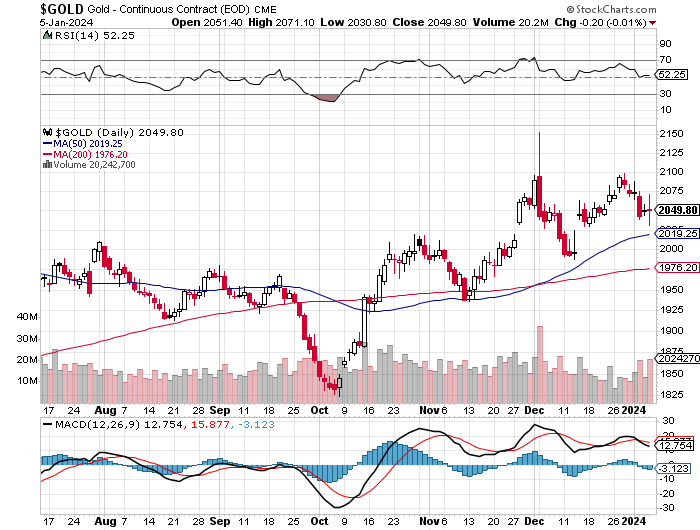
Although gold closed up a couple of bucks in the spot market, it was closed down a couple of dimes in February, its current front month. It's still no closer to breaking below its 50-day moving average than it was on Thursday, although it came reasonably close at its intraday engineered low tick on Friday.
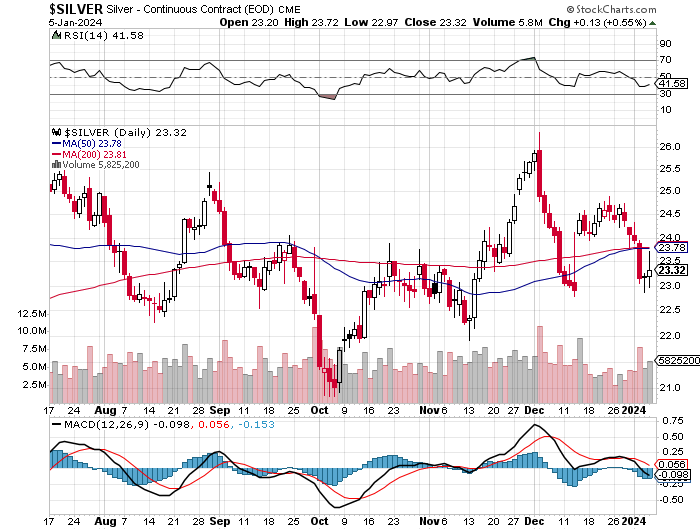
Silver would have certainly blown through both its 50 and 200-day moving averages yesterday if the Big 4/8 shorts hadn't forcefully intervened when they did...coming within about a dime of both at its high tick in COMEX trading.
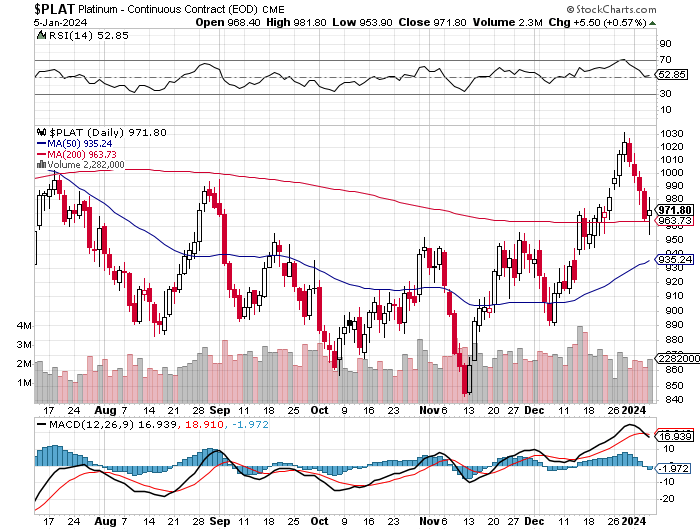
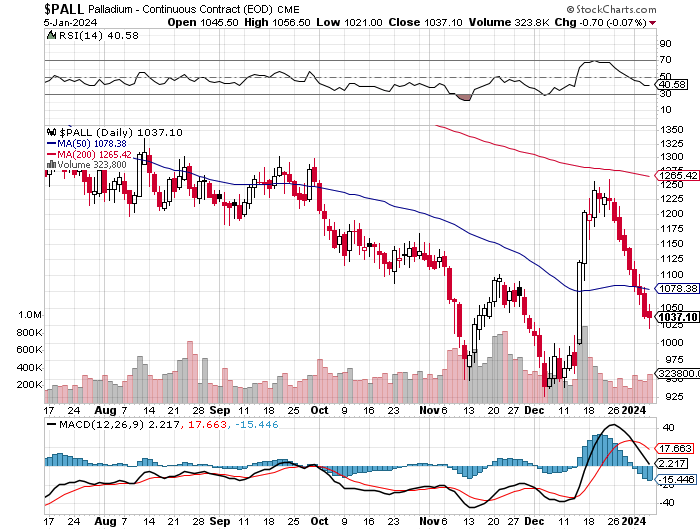
Platinum managed a small gain, after four consecutive lower closes -- and blew through its 200-day moving average to the downside on an intraday basis...closing above it by 8 bucks when all was said and done. It was the ninth straight day of engineered low closes for palladium. It wasn't by much, but intraday, it was far lower.
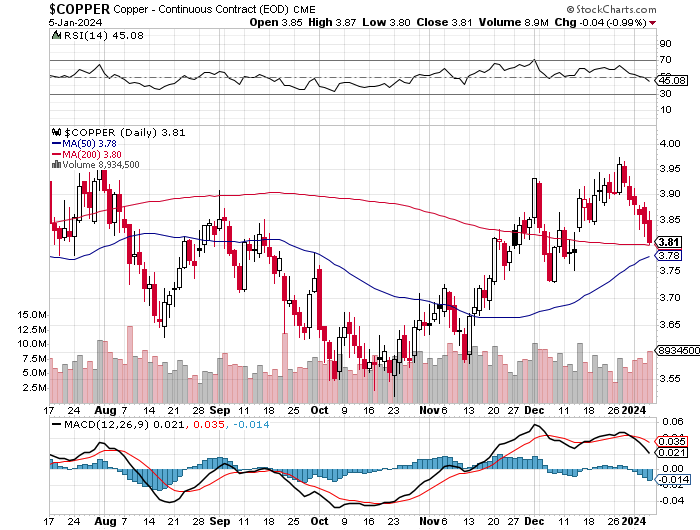
Copper was edged lower for the sixth straight trading session, closing a penny above its 200-day moving average -- and touching it intraday. It finished the day down another 4 cents at $3.81/pound.
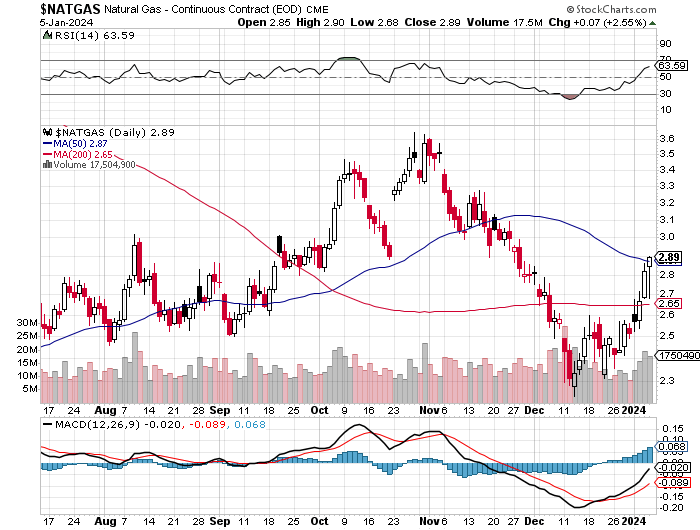
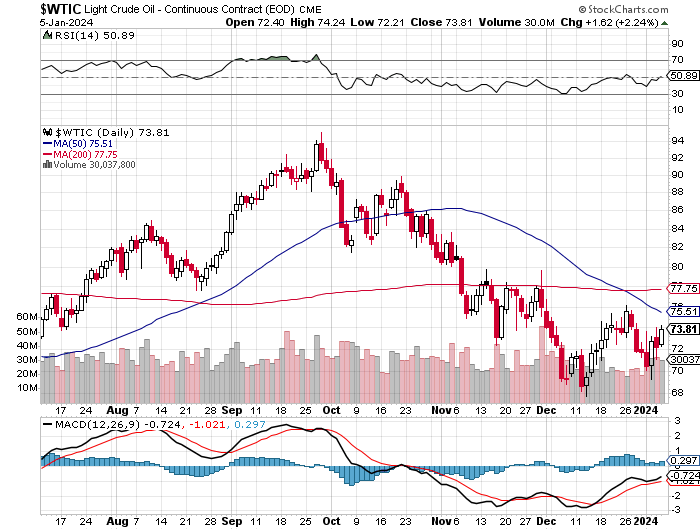
Natural gas's [chart included] small 7 cent gain on Friday pushed it above its 50-day moving average by a tiny amount. It closed at $2.89/1,000 cubic feet, but was about twenty cents lower than that at its intraday low tick. WTIC tacked on a $1.62 gain yesterday -- and it finished the day at $73.81/barrel, but still below any moving average that matters.
Here are the 6-month charts for the Big 6+1 commodities, courtesy of stockcharts.com as always and, if interested, their COMEX closing prices in their current front months on Friday should be noted. Click to enlarge.
It certainly seemed like 'da boyz' had their hands full in the precious metals yesterday...doing whatever was necessary in order to prevent them from breaking out to the upside -- and that was most obvious with silver.
The structural deficit in it, isn't going away -- and it's only a matter of when [not if] its price is allowed to reflect that reality. But the longer the Big one or two commercial shorts keep its price suppressed, the more violent its price rise will be in its attempt to reconcile the limited supply with current demand.
Of course once its rally for the ages gets underway, the world-wide rush to invest in it in one form or another, will drive physical demand even higher...with no way to fill it...none whatsoever...now, or anytime in the foreseeable future. It will be a market-clearing event like the world has never seen before, or will again. And that's just not true for silver, but the other precious metals...plus the rest of the commodity complex as well.
The rush from paper assets into hard physical assets will be on in earnest -- and one has to suspect that it will be a fatal or near-fatal blow to the world's banking and financial system.
How the world's power elite are going to deal with this when that moment manifests itself, is something that I spend more and more time thinking about. We are are deep down this price management rabbit hole -- and whose 'best before' use date has long since past.
If they do have a plan to prevent this...or to profit exclusively from it...it would have to be draconian in nature...very draconian. What plan that might be, is way beyond my pay grade...although "The Great Taking"...if as advertised... would certainly fit that 'draconian' part in spades -- and is something that I'm in the process of investigating behind the scenes. I'll report on what I find, hopefully next week. If you haven't read the tiny [free] book, you should at least watch the video...which is embedded at the end of this article about it from the internationalman.com Internet site -- and linked here.
The various assortment of psychopathic and sociopathic personalities that make up the world's power elite will stop at nothing to maintain or increase their power and wealth...especially the former. They will, to paraphrase Sun Tzu..."burn their own nations to the ground to rule over the ashes." -- and we're seeing more and more of that everywhere in the West now...particularly in the U.S. And further, as Yoda said to Luke..."Do NOT underestimate the power of the dark side of The Force."
For that reason, I still remain "all in" -- and hoping, as you are as well I'm sure, to survive whatever is coming down the pipe.
See you here on Tuesday.
Ed
About the author

SUBSCRIBE: https://edsteergoldsilver.com/

Ed Steer’s Daily Analysis of the Gold and Silver Markets
After eight years of writing about the precious metals for Casey Research, the folks at Stansberry & Associates—who just recently purchased controlling interest in the company—decided that my ‘niche market’ column didn’t fit into their plans.
Since the time that Casey Research was kind enough to offer me a stand-alone column, it became their most highly-rated blog almost from the outset—and has remained that way up to this date...