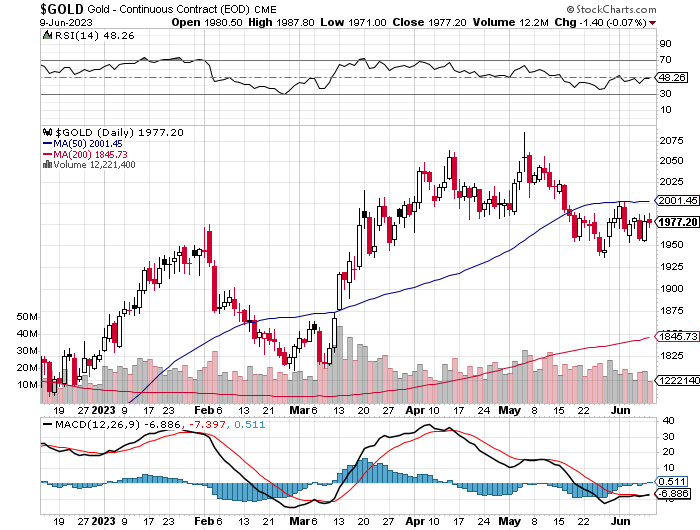
The gold price didn't do much of anything in GLOBEX trading overseas on Friday, but then spiked higher at 8:30 a.m. in COMEX trading in New York, on whatever news. That was capped immediately -- and then engineered lower in price until 'da boyz' set its low tick around 9:45 a.m. EDT. Its ensuing rally met the same fate at 10:30 a.m. -- and it was then sold lower until around 11:35 a.m. EDT. It didn't do a whole heck of a lot after that.
The high and low ticks in gold were reported as $1,987.80 and $1,971.00 in the August contract. The June/August price spread differential in gold at the close in New York yesterday was $15.00...August/October was $19.60... October/December was $19.30 -- and December/February was $18.80 an ounce.
Gold was closed in New York on Friday afternoon at $1,960.70 spot, down $3.90 from Thursday. Net volume was very light at a bit over 124,500 contracts -- and there were 5,700 contract worth of roll-over/switch volume on top of that.

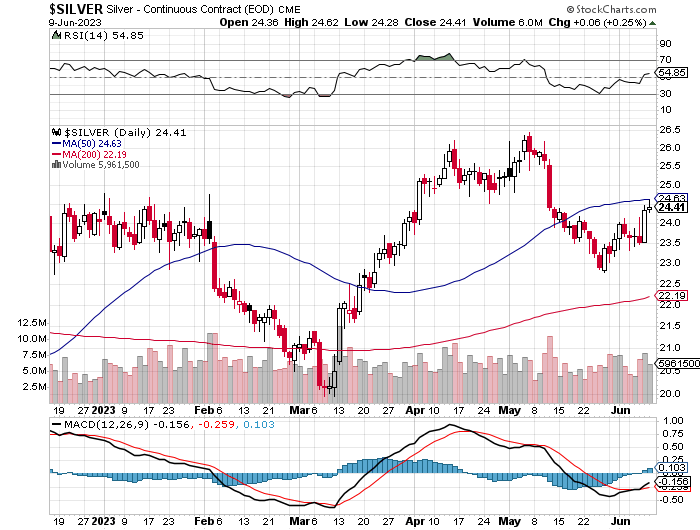
The silver price had a quiet, uneven and very broad up/down move in GLOBEX trading that lasted until 9:45 a.m. in COMEX trading in New York. Its subsequent sharply rally met the same fate as gold's at exactly 10:30 a.m. EDT. It was then sold quietly lower from there until 1 p.m. -- and didn't do much of anything after that.
The low and high ticks in silver were recorded within forty-five minutes of each other in COMEX trading in New York...$26.62 and $24.28 in the July contract. The July/September price spread differential in silver at the close in New York yesterday was 21.9 cents...September/December was 31.2 cents -- and December/March was 32.2 cents an ounce.
Silver was closed on Friday afternoon in New York at $24.275 spot, up 5 cents on the day. Net volume was pretty light at 49,500 contracts -- and there were around 14,300 contracts worth of roll-over/switch volume out of July and into future months in this precious metal...mostly into September, with smaller amounts into December and March.

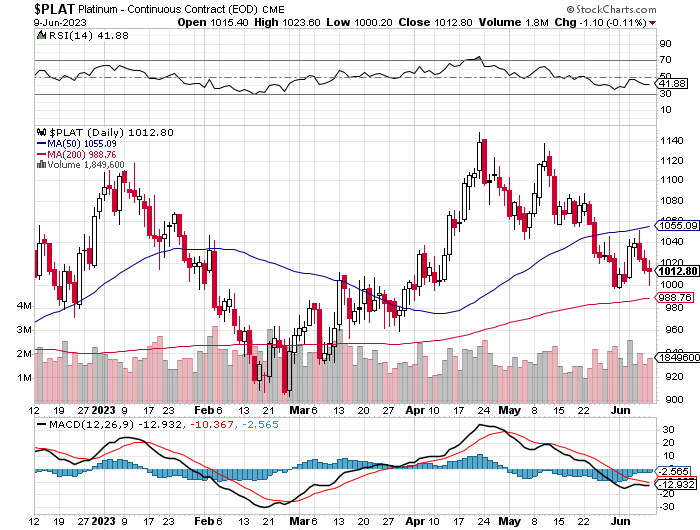
Platinum wandered quietly higher in price until the 9 a.m. CEST Zurich open -- and it was mostly down hill from there until the commercial traders of whatever stripe set its low tick shortly after 9 a.m. in COMEX trading in New York. Its ensuing rally was capped around 10:25 a.m. EDT -- and it then traded quietly sideways until the market closed at 5:00 p.m. Platinum was closed at $1,008 spot, down 2 bucks on the day.

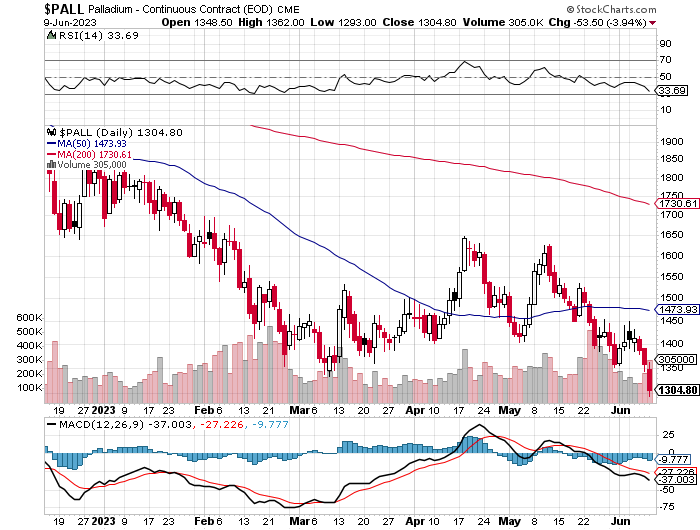
Palladium had a couple of quiet down/up moves in GLOBEX trading on Friday -- and arrived at the COMEX open unchanged on the day. 'Da boyz' put in an appearance at that juncture -- and its low tick was set shortly before 1 p.m. EDT. Its ensuing rally was capped thirty minutes later -- and from there it didn't do much until trading ended at 5:00 p.m. Palladium was closed at $1,296 spot, down another 40 dollars.
Based on the kitco.com spot closing prices in silver and gold posted above, the gold/silver ratio worked out to 80.8 to 1 on Friday...compared to 81.1 to 1 on Thursday.
Here's the 1-year Gold/Silver Ratio chart, courtesy of Nick Laird. Click to enlarge.

The dollar index closed very late on Thursday afternoon in New York at 103.34 -- and then opened lower by 4 basis points once trading commenced at 7:31 p.m. EDT on Thursday evening, which was 7:31 a.m. China Standard Time on their Friday morning. It crawled quietly and a bit unevenly higher from there until around 12:25 p.m. CST -- and then chopped a bit lower until 2:37 p.m. CST. It then had a very broad up/down move that ended at the 8:20 a.m. COMEX open -- and then chopped quietly and unevenly higher at an ever-decreasing rate until around 3:50 p.m. EDT. From there it edged a bit lower until the market closed at 5:00 p.m.
The dollar index finished the Friday trading session in New York at 103.56...up 22 basis points from its close on Thursday.
Here's the DXY chart for Friday, courtesy of marketwatch.com as usual. Click to enlarge.

And here's the 5-year U.S. dollar index chart that appears in this spot every Saturday, courtesy of stockcharts.com as always. The delta between its close....103.53...and the close on the DXY chart above, was 3 basis points below its spot close. Click to enlarge.

It was yet another day where the correlation between the currencies and what was happening in the precious metals was dubious to non-existent.
U.S. 10-Year Treasury: 3.7450%...up 0.0310 (+0.83%)...as of 02:59 p.m. EDT
And here's the 5-year 10-year U.S. Treasury chart from the yahoo.com Internet site -- which puts the yield curve into a somewhat longer-term perspective. Click to enlarge.
As is always the case, the Fed was buying treasuries hand over fist when required to prevent interest rates from rising across the yield curve.
The gold shares were sold lower the moment that trading began in New York at 9:30 a.m. on Friday morning -- and that lasted until the gold price began to rally anew -- and the gold stocks followed until around 10:35 a.m. EDT. From that point they were sold quietly and unevenly lower until the markets closed at 4:00 p.m. The HUI closed down 1.44 percent.

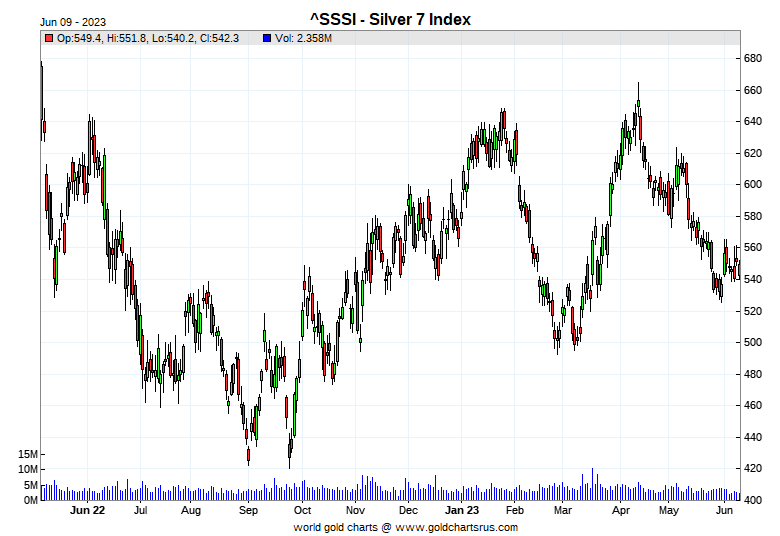
Computed manually, the new Silver Sentiment/Silver 12 Index closed down 2.03 percent.
Here's Nick's old 1-year Silver Sentiment/Silver 7 Index chart, updated with Friday's candle. Click to enlarge.

The 'star' yesterday was Wheaton Precious Metals, as it closed down only 0.99 percent. The biggest underperformer was Silvercorp Metals, as it closed lower by 3.11 percent.
The new short report [for positions held at the end of May] appeared on The Wall Street Journal's website early on Friday evening -- and it showed that the short position in First Majestic Silver rose to 17.17 million shares on the NYSE...up 4.55% from the prior short report, which represents 6.42% of the float. The short position in First Majestic is significantly higher than the short positions of its peers.
The reddit.com/ Wallstreetsilver website is still going, sort of -- and the link to it is here. The link to two other silver forums are here -- and here.
Here are the usual three charts that show up in every weekend missive. They show the changes in gold, silver, platinum and palladium in both percent and dollar and cents terms, as of their Friday closes in New York — along with the changes in the HUI and the old Silver 7 Index.
Here's the weekly chart -- and although the silver and gold closed up a bit on the week...silver more than gold because of Thursday's big gain...that didn't translate into higher equity prices...something that we're both painfully aware of. Click to enlarge.
The current month-to-date chart below only contains two more trading days of data compared to the weekly chart above, so the changes between the charts aren't overly big. But at least the equities are up for the month...albeit not by much -- and are still vastly underperforming their respective underlying precious metals. Click to enlarge.
Here's the year-to-date chart -- with everything gold-related handily outperforming everything silver-related as has been the case recently, with the silver equities still down on the year. Of course -- and as I mention in this spot every Saturday -- and will continue to do so...is that if the silver price was sitting within 5 or so percent of its old high of $50 the ounce...like gold is currently within 5 percent or so of breaking above its old high of around $2,080...it's a given that the silver equities would be outperforming their golden cousins by an absolute country mile. That day is coming, but obviously not here yet. Click to enlarge.
The stand-out feature on all three charts which I haven't mentioned until now, is the absolute pounding that the commercial traders have been administering to palladium this year. As I point out in The Wrap, palladium's price hasn't been this low since sometime in 2019.
With these current "wash, rinse, spin" engineered price declines still a work in progress, courtesy of the collusive commercial traders of whatever stripe, it remains to be seen how long this goes on for this time around...although from a COMEX futures market perspective, the setup remains white-hot bullish in silver, as it has been for several months now. Unfortunately, the same cannot be said of gold -- and therein lies the rub...maybe.
The CME Daily Delivery Report for Day 8 of June deliveries showed that only 5 gold -- and 2 silver contracts were posted for delivery within the COMEX-approved depositories on Tuesday.
In gold, the two short/issuers were Advantage and British bank HSBC USA, issuing 3 and 2 contracts out of their respective client accounts. The largest long/stopper was JPMorgan, as they picked up 3 contracts for clients.
In silver, Ironbeam Inc. was the sole short/issuer out of its client account -- and JPMorgan stopped both contracts for their client account as well.
In palladium, there were 21 contracts issued and stopped.
The link to yesterday's Issuers and Stoppers Report is here.
So far in June, there have been 18,022 gold contracts issued/reissued and stopped -- and that number in silver is 423 COMEX contracts. There have been 157 palladium contracts issued and stopped -- and nothing in platinum.
The CME Preliminary Report for the Friday trading session showed that gold open interest in June fell by 303 COMEX contracts, leaving 2,191 still around, minus the 5 contracts mentioned a few paragraphs ago. Thursday's Daily Delivery Report showed that 286 gold contracts were actually posted for delivery on Monday, so that means that 303-286=17 gold contracts vanished from the June delivery month. Silver o.i. in June rose by 1 contract -- and there were zero silver contracts posted for delivery on Monday...so that obviously means that 1 more silver contract just got added to June deliveries.
Total gold open interest at the close on Friday declined by 702 COMEX contracts -- and total silver o.i. rose by 2,270 contracts...which Ted would feel were most likely market-neutral/uneconomic spread trades being added. Both numbers are subject to some revision by the time the final figures are posted on the CME's website later on Monday morning CDT.
There was a withdrawal from GLD yesterday, as an authorized participant removed 92,877 troy ounces of gold -- and there were no reported changes in SLV.
The new short report appeared on The Wall Street Journal's website early on Friday evening -- and it showed that the short position in SLV declined from 16.06 million shares, down to 14.19 million shares, a drop of 11.65 percent. The short position in GLD also fell, it from 1.036 million troy ounces, down to 888,000 troy ounces...a drop of 14.31 percent.
In other gold and silver ETFs and mutual funds on Planet Earthon Friday, net of any changes in COMEX, GLD and SLV inventories...there were a net 38,124 troy ounces of gold added -- and a net 316,935 troy ounces of silver was added as well...with the most noteworthy amount being the 400,000 troy ounces deposited into Sprott's PSLV.
There was no sales report from the U.S. Mint again yesterday -- and they haven't sold a thing so far in June.
The only activity in gold over at the COMEX-approved depositories on the U.S. east coast on Thursday were the 8,359.260 troy ounces/260 kilobars that departed Brink's, Inc. Nothing was received -- and there was no paper activity, either. The link to this is here.
There was considerably more activity in silver, as 1,300,682 troy ounces were reported received -- and nothing was shipped out.
The largest amount were the 744,601 troy ounces that arrived at Brink's, Inc. -- and the remaining 556,081 troy ounces/one truckload showed up at JPMorgan.
There was no paper activity here, either -- and the link to Thursday's COMEX activity in silver, is here.
There was some activity over at the COMEX-approved gold kilobar depositories in Hong Kong on their Thursday. Nothing was reported received -- and 386 kilobars were shipped out...380 from Loomis International -- and the remaining 6 kilobars departed Brink's, Inc. The link to this, in troy ounces, is here.
Here are the usual 20-year charts that show up in this space in every Saturday column. They show the total amounts of physical gold and silver held in all know depositories, ETFs and mutual funds as of the close of business on Friday.
During the week just past, there were a net 460,000 troy ounces of gold removed -- and a net 1.779 million troy ounces of silver were taken out as well. Click to enlarge for both.
According to Nick Laird's data on his website, there have been a net 243,000 troy ounces of goldremoved -- and a net 2.250 million troy ounces of silver has been taken out as well from all the world's known depositories, mutual funds and ETFs during the last four weeks.
In gold, the only large 'in' amount worth mentioning were the 198,000 troy ounces that were deposited into Source/SGLD. The two largest 'out' amounts by far were the 171,000 troy ounces that left GLD...followed by the 137,000 troy ounces that departed ETF Securities/GBS. Almost all of the remaining gold ETFs and mutual funds are now showing smallish net withdrawals.
In silver, the only three depositories/ETFs showing net deposits of any size over the last four weeks were the 2.713 million troy ounces added to the COMEX...followed by iShares/SVR -- and Sprott's PSLV with 779,000 and 701,000 troy ounces added respectively. The two biggest 'out' amounts by far were at SLV and SIVR...as 2.822 million troy ounces were withdrawn from the former -- and 2.738 million troy ounces from that latter. Way down the list after them in third spot was ZKB/ZSIL, with 747,000 troy ounces taken out.
Retail bullion sales remains very quiet -- and most on-line retail bullion stores now show a complete line of products, with only a few on back order. That situation will exist until the next buying frenzy commences...which is coming as surely as day follows night.
The physical shortage in silver at the wholesale level continues unabated -- and how much silver is left in these depositories that is available for sale at current prices is something that Ted has been going on about for a long while now -- and he's of the opinion that there isn't a lot. Whatever that number is, we're getting closer to it with each passing month...although it's now more than obvious that JPMorgan is providing silver to all ETFs and mutual funds... plus other entities...as required. This is particularly true of the silver that was provided to cover the short position in SLV.
The vast majority of precious metals being held in these depositories are by those who won't be selling until the silver price is many multiples of what it is today. That's particularly true of shareholders in PSLV...who are adding to their stash at every opportunity.
Sprott's PSLV is the third largest depository of silver on Planet Earth with 175 million troy ounces -- and some distance behind the COMEX, where there are 273 million troy ounces being held. But they're light years behind SLV, as they are the largest silver depository, with 467 million troy ounces as of Friday's close.
The latest short report came out late on Friday afternoon EDT -- and it showed that the short position in SLV fell by a further 11.65 percent...with only 14.19 million troy ounces left to go. Some of the details about this have already been discussed further up -- and I have more about it in the 'Days to Cover' commentary as well.
Then there's that other little matter of the 1-billion ounce short position in silver held by Bank of America...with JPMorgan & Friends on the long side. Ted says it hasn't gone away -- and he's also come to the conclusion that they're short around 25 million ounces of gold with these same parties as well...which also I point out elsewhere in this column.
The Commitment of Traders Report for positions held at the close of COMEX trading on Tuesday, June 6 showed a tiny decrease in the Commercial net short position in silver -- and a decent increase in the commercial net short position in gold...mostly caused by Ted's raptors selling long positions.
In silver, the Commercial net short position dropped by 471 COMEX contracts...2.355 million troy ounces of the stuff.
They arrived at that number by increasing their long position by 1,183 contracts -- and also increased their short position by 712 COMEX contracts. It's the difference between those two numbers that represents their change for the reporting week.
Under the hood in the Disaggregated COT Report, the Managed Money increased their net long position by 721 contracts...which they accomplish by decreasing their long position by 1,677 contracts -- and also reduced their short position by 2,398 contracts. It's the difference between those two numbers that represents their change for the reporting week.
The other two categories were sellers, as the Other Reportables reduced their net long position by 370 COMEX contracts -- and the Nonreportable/small traders by 822 contracts.
Doing the math: 370 plus 822 minus 721 equals 471 COMEX contracts, the change in the Commercial net short position.
The Commercial net short position in silver now stands at 34,065 COMEX contracts/170.33 million troy ounces...down those 471 contracts...from the 34,536 contracts/172.68 million troy ounces they were short in June 2 COT Report.
The Big 4 shorts decreased their short position from 36,478 contracts, down to 35,294 contracts, a decline of 1,184 contracts. Ted figured that virtually all of that decline was because that one Managed Money trader that currently resides in that category, reduced their short position by about that amount.
Because of that, that Managed Monday trader now holds a bit under the 8,000 COMEX contracts short...so the above commercial net short position of the Big 4 [and also the Big 5 through 8] is overstated by that amount...leaving the Big 4 category still wildly bullish from a COMEX futures market respectively.
As just stated, that Managed Money trader, although still in the Big 4 short category, is definitely the smallest member of it now.
The '5 through 8' big shorts increased their short position by an insignificant 349 contracts -- and are currently short 24,266 COMEX contracts.
The Big 8 shorts in total decreased their net short position from 60,395 contracts, down to to 59,560 COMEX contracts week-over-week. But you have to subtract out the short position of that Managed Money trader...a bit under 8,000 contracts to be conservative...so the Big 8 commercial short position, in reality, is around 51,800 contracts...which is also a very low number on an historical basis -- and virtually unchanged from last week.
And because there's now that Managed Money trader contaminating the Big 8 commercial category, it's not possible to calculate the long position that Ted's raptors hold with complete accuracy...but in the "close enough for government work" category, they added around 700 contracts to their long position, which now stands at around 17,700 contracts.
Don't forget, that despite their small size, they're still commercial traders in the commercial category -- and all in the Swap Dealers category.
Here's Nick's 3-year COT Reportfor silver, updated with the above data. Click to enlarge.
All-in-all it was a 'nothing' COT Report in silver, except for the fact that that one Managed Money traders still contaminates the Big 4 category -- and whether they reduced their short position by 1,000 contracts, or by as much as 1,500 contracts during the reporting week, is pretty irrelevant.
But the stand-out feature still remains that the Big 4 shorts, which are the key to the whole price management scheme in silver, continue to refrain from adding their their short positions.
And as I said in this space last week..."Silver is locked and loaded for a big move higher...whenever that is allowed. It's been in this state for quite some time now. Of course when that event is allowed to manifest itself, all eyes will be on what the Big 4 commercial short do or don't do on that rally."
In gold, the commercial net short position continues to rise...this time by 8,182 COMEX contracts...818,200 troy ounces.
They arrived at that number by reducing their long position by 16,966 COMEX contracts -- and also reduced their short position by 8,784 contracts. It's the difference between those two numbers that represents their change for the reporting week.
Under the hood in the Disaggregated COT Report, the Managed Money traders were big buyers, as they increased their net long position by 6,725 COMEX contracts...mostly through the covering of 8,644 short contracts. The Nonreportable/small traders were buyers as well, increasing their net long position by 1,857 COMEX contracts. To balance things out, the traders in the Other Reportables category had to be sellers -- and there were...reducing their net long position by 400 contracts.
Doing the math: 6,725 plus 1,857 minus 400 equals 8,182 COMEX contracts, the change in the commercial net short position.
The commercial net short position in gold now sits at 198,187 COMEX contracts, or 19.819 million troy ounces of the stuff...up those 8,182 contracts from the 190,005 contracts/19.001 million troy ounces they were short in the June 2 COT Report.
The Big 4 shorts increased their net short position from 174,411 contracts, up to 176,701 COMEX contracts...an increase of 2,290 contracts.
The Big '5 through 8' shorts in gold increased their net short position by a tiny 543 COMEX contracts...from the 55,740 contracts they held short in the June 2 COT Report, up to 56,283 contracts held short in the current COT Report. This change is irrelevant.
The Big 8 shorts in total increased their net short position from 230,151 COMEX contracts, up to 232,984 contracts...an increase of 2,833 COMEX contracts...[2,290 plus 543].
Ted's raptors, the small commercial traders other than the Big, were the biggest sellers during the reporting week, decreasing their long position from 40,146 COMEX contracts...down to 34,797 COMEX contracts...a decrease of 5,349 COMEX contracts.
When you add those 5,349 contracts the raptors sold, to the 2,833 contracts that the Big 8 sold during the reporting week, you come up 8,182 COMEX contracts...the change in the commercial net short position.
And as I keep pointing out, this ain't rocket science...it's just math -- and not difficult math, either.
Don't forget that despite their small size, Ted's raptors are still commercial traders in the commercial category.
Here's Nick Laird's 3-year COT Report chart for gold, updated with data from this May 19 COT Report. Click to enlarge.
Although the commercial net short position increased by those 8,182 COMEX contracts, most of that was the 5,349 contracts sold by Ted's raptors, the small commercial traders other than the Big 8 shorts. Their selling of long positions had the mathematical effect of increasing the commercial net short position, which really isn't an increase at all.
So, the COT Report for gold isn't as bad as it looked at first.
But make no mistake about it, the Big 4 shorts continue to go short when required -- and although they're short about the same amount they were back on 21 April...their short position from a COMEX futures market perspective still remains firmly in bearish territory.
One dichotomy that Ted pointed out on the phone yesterday was that while the Big 4 shorts hold a large short position in gold -- and aren't shy about adding to it...while the Big '5 through 8' traders in gold have been very reluctant to add to their short positions. Their short position is historically very low.
It's exactly the opposite in these two categories in silver.
So place your bets as to how this all plays out in the weeks and months ahead...with gold bearish -- and silver wildly bullish from a COMEX futures market perspective.
In the other metals, the Managed Money traders in palladium increased their net short by a further 731 COMEX contracts -- and are net short palladium by a very hefty 6,078 contracts...over 50% of current open interest. The commercial traders are net long palladium in both categories...especially the Swap Dealers. All the other categories are net short. In platinum, the Managed Money traders increased their net long position by 1,361 contracts -- and are net long platinum by 18,204 COMEX contracts. The Producer/Merchant category is the only category net short platinum at the moment -- and they are mega net short to the tune of 30,938 contracts. The rest of the categories are net long -- and except for the Swap Dealers, almost all are long by very decent amounts.
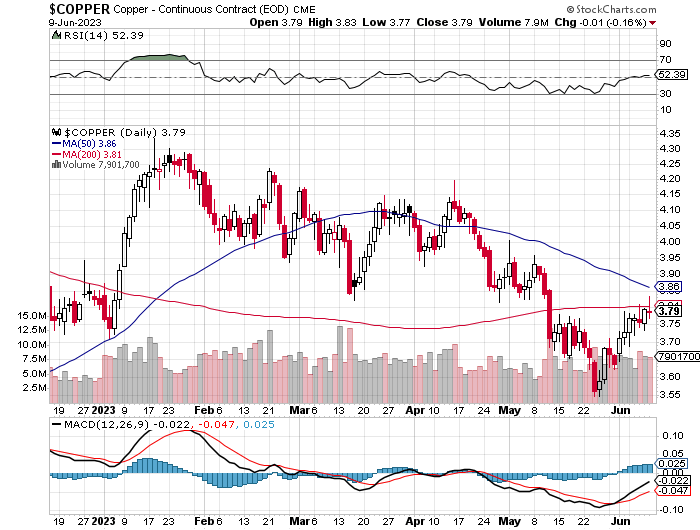
In copper, the Managed Money traders decreased their net short position by a very chunky 11,972 contracts -- but are still net short copper by 12,277 COMEX contracts...about 307 million pounds of the stuff as of the June 9 COT Report...which is a very large amount.
Copper, like platinum, continues to be a wildly bifurcated market in the commercial category. The Producer/Merchant category is net short 26,500 contracts -- and the Swap Dealers are net long 51,200 COMEX contracts. How's that for bifurcation?
But whether that mean anything or not, will only be known in the fullness of time. Ted says it doesn't mean anything as far as he's concerned, as they're all commercial traders in the commercial category.
In this vital industrial commodity, the world's banks...both U.S. and foreign... are net long 9.1 percent of the total open interest in copper in the COMEX futures market in the June Bank Participation Report, which came out yesterday...down a goodly amount from the 12.5 percent they were net long in May's. At the moment it's the commodity trading houses such as Glencore and Trafigura et al., along with some hedge funds, that are mega net short copper in the Producer/Merchant category, as the Swap Dealers are mega net long, as I pointed out above.
Here’s Nick Laird’s “Days to Cover” chart, updated with the COT data for positions held at the close of COMEX trading on Tuesday, June 6. It shows the days of world production that it would take to cover the short positions of the Big 4 — and Big '5 through 8' traders in every physically traded commodity on the COMEX. Click to enlarge..
In this week's data, the Big 4 traders are short about 82 days of world silver production, down about 3 days from the June 2 COT Report. The ‘5 through 8’ large traders are short an additional 57 days of world silver production, up about 1 day from the June 2 COT Report, for a total of about 139 days that the Big 8 are short -- and down about 2 days from last week.
Those 139 days that the Big 8 traders are short, represents around 4.6 months of world silver production, or 297.80 million troy ounces/59,560 COMEX contracts of paper silver held short by these eight traders. The two or three largest of these are now non-banking entities, as per Ted's discovery in December's Bank Participation Report. But this Big 8 commercial short position is now contaminated by the one Managed Money trader that is now embedded in it.
Most of the decrease in the Big 8 shorts was because that Managed Money traders covered between 1,000 and 1,300 contracts during the reporting week...which has the mathematical effect of decreasing the commercial net short position.
Because of that Managed Money trader now in the Big 8 category, the long position of Ted raptors, the small commercial traders other than the Big 8, cannot be calculated accurately...but it's somewhere around 88 million troy ounces/17,700 contracts...up a bit from what they were long in last week's COT Report.
And as I mentioned earlier, the fact that Ted's raptors are holding a long position of any kind with silver this far above its 200-day moving average is not only amazing, it's also unprecedented -- and continues to remain so. I know that I point this out every week in this space, but it's still a very big deal. That goes along with the amazing fact that there's already a Managed Money trader in the Big 4 short category. This is still all 'man bites dog' stuff -- and a sea-change in silver as Ted has been pointing out. I have more on this in The Wrap.
In gold, the Big 4 are short 59 days of world gold production, up about 1 day from the June 2 COT Report. The '5 through 8' are short 19 days of world production, unchanged from the June 2 COT Report...for a total of 78 days of world gold production held short by the Big 8 -- and obviously up 1 day from last week's COT Report.
The Big 8 commercial traders are short 43.2 percent of the entire open interest in silver in the COMEX futures market as of yesterday's COT Report, down a bit from the 45.2 percent that they were short in the June 2 COT Report. And once whatever market-neutral spread trades they have on are subtracted out, that percentage would be around the 50 percent mark. In gold, it's 53.4 percent of the total COMEX open interest that the Big 8 are short, up a bit from the 51.2 percent they were short in the June 2 COT Report -- and a tiny bit over the 60 percent mark once their market-neutral spread trades are subtracted out. The reason it's up as much as it is, is because total open interest in gold took another steep dive during the last week...13,214 contracts -- and mostly because of June deliveries.
And as mentioned earlier, Ted is still of the opinion that Bank of America is short about one billion ounces of silver in the OTC market, courtesy of JPMorgan & Friends. He's also of the opinion that they're also short around 25 million troy ounces of gold...with the same bunch of crooks on the long side.
If BofA gets hung out to dry, they could possibly end up being the next Bear Stearns. However, there won't be anyone to save them...except the Fed, or maybe the Exchange Stabilization Fund.
And as you already, know the short position in SLV declined from 16.06 million shares, down to 14.19 million shares in the June 9 short report from yesterday -- and Ted is of the opinion that the almost 8 million troy ounces of silver that was added to SLV more than a month ago now...plus more since then, was used to cover even more of the remaining short position. Most of these amounts haven't shown up as of yet -- and Ted feels that the only reason that they haven't is because whoever the short is, is "short against the box" -- and that all these reductions will show up eventually. This is the second short report in a row where the short interest in SLV has dropped -- and is now the lowest its been in years. Shorting against the box was primarily used for tax-minimization purposes at one time...but in this case it's being used to hide the fact that short positions have already been covered.
The next short report is due out on Tuesday, June 27.
The situation regarding the Big 4/8 concentrated commercial short positions in silver and gold is still obscene, particularly in gold -- and this past reporting week's data didn't improve the situation much in either precious metal. That's certainly true in gold, as the Big 4 added another 2,300 short contracts.
As Ted has been pointing out ad nauseam forever, the resolution of the Big 4/8 short positions will be the sole determinant of precious metal prices going forward. And as I've been mentioning for months now, the Big 4 commercial traders have been very reluctant to add to their short positions in silver since late February...and didn't appear to do a thing in yesterday's COT Report.
The only reason that the Big 4/8 short position in silver is as high as it is currently, is because of that Managed Money trader that's short a bit under 8,000 contracts in the Big 4 category. Remove them -- and the Big 8 commercial short position remains very bullish.
And, as always, nothing else matters -- and that should be obvious to all by now, except the willfully blind -- and those whose so-called 'reputations' and jobs/careers depend upon them not seeing it.
The June Bank Participation Report [BPR] data is extracted directly from yesterday's Commitment of Traders Report. It shows the number of futures contracts, both long and short, that are held by all the U.S. and non-U.S. banks as of Tuesday’s cut-off in all COMEX-traded products.
For this one day a month we get to see what the world’s banks have been up to in the precious metals. They’re usually up to quite a bit -- and they certainly were again last month.
[The June Bank Participation Report covers the time period from May 2 to June 6 inclusive]
In gold, 5 U.S. banks were net short 47,706 COMEX contracts, down only 1,552 contracts from the 49,258 contracts they were short in May's BPR.
Also in gold, 24 non-U.S. banks were net short 34,451 COMEX contracts, up an insignificant 696 contracts from the 33,755 contracts that 23 non-U.S. banks were short in May's BPR.
At the low back in the August 2018 BPR...these same non-U.S. banks held a net short position in gold of only 1,960 contacts -- so they've been back on the short side in an enormous way ever since.
I was expecting a much larger improvement from the all the banks in May, so it means that non-banking entities were far more active in gold last month than the banks were.
Although some of the largest U.S. and foreign bullion banks are in the Big 8 short category in gold, there are some hedge fund/commodity trading houses that are short even more grotesque amounts of gold than the banks.
As of this Bank Participation Report, 29 banks [both U.S. and foreign] are net short 18.8 percent of the entire open interest in gold in the COMEX futures market in June's BPR...up a bit from the 16.8 percent that 28 banks were net short in the May BPR.
That 18.8 percent is not a large amount at all -- and as I just stated two paragraphs ago, that leaves the remaining 81.2 percent of total open interest held short in gold in the hands of other entities...most of which would be the commodity trading houses and hedge funds.
Here’s Nick’s BPR chart for gold going back to 2000. Charts #4 and #5 are the key ones here. Note the blow-out in the short positions of the non-U.S. banks [the blue bars in chart #4] when Scotiabank’s COMEX short position was outed by the CFTC in October of 2012. Click to enlarge.
In silver, 5 U.S. banks are net short 22,972 COMEX contracts, down 3,395 contracts from the 26,367 contracts they were short in the May BPR.
The biggest short holders in silver of the five U.S. banks in total, would be Citigroup, HSBC USA, Bank of America, Morgan Stanley...and maybe Goldman Sachs -- and also JPMorgan from time to time. And, like in gold, I have my suspicions about the Exchange Stabilization Fund's role in all this...although, also like in gold, not directly.
Also in silver, 17 non-U.S. banks are net short 13,181 COMEX contracts, down 2,163 contracts from the 15,344 contracts that 18 non-U.S. banks were short in the May BPR.
I would suspect that HSBC and Barclays hold a goodly chunk of the short position of these non-U.S. banks...plus some by Canada's Scotiabank/Scotia Capital still. I'm not sure about Deutsche Bank... but now suspect Australia's Macquarie Futures. I'm also of the opinion that a number of the remaining non-U.S. banks may actually be net long the COMEX futures market in silver. But even if they aren’t, the remaining short positions divided up between the other 12 or so non-U.S. banks are immaterial — and have always been so. The same can be said of the 24 non-U.S. banks in gold as well.
As of June's Bank Participation Report, 22 banks [both U.S. and foreign] are net short 26.2 percent of the entire open interest in the COMEX futures market in silver — down from the 29.3 percent that 23 banks were net short in the May BPR.
That 26.2 percent is a larger number than the 18.8 percent in gold, but that still leaves the commodity trading houses and hedge funds short the lion's share of the remaining 63.8 percent of total open interest in silver.
Here’s the BPR chart for silver. Note in Chart #4 the blow-out in the non-U.S. bank short position [blue bars] in October of 2012 when Scotiabank was brought in from the cold. Also note August 2008 when JPMorgan took over the silver short position of Bear Stearns—the red bars. It’s very noticeable in Chart #4—and really stands out like the proverbial sore thumb it is in chart #5. Click to enlarge.
In platinum, 5 U.S. banks are net short 19,897 COMEX contracts in the June BPR, virtually unchanged from the 19,619 contracts they were short in the May BPR -- and almost a record high amount.
At the 'low' back in September of 2018, these U.S. banks were actually net long the platinum market by 2,573 contracts. So they have a very long way to go to get back to just market neutral in platinum...if they ever intend to, that is. They look permanently stuck on the short side to me, a fact that I've been pointing out recently.
Also in platinum, 18 non-U.S. banks were net short 3,294 COMEX contracts, down only 876 contracts from the 4,170 contracts that these same 18 non-U.S. banks were net short in the May BPR.
I was hoping that these non-U.S. banks would be market neutral in this BPR, but that didn't happen. But, having said that, on average each of these non-U.S. banks are net short less than 200 COMEX contracts each in this precious metal...which is no big deal...just like for the non-U.S. banks in silver and gold as well.
So it's the U.S. banks that are on the short hook big time -- and the real price managers...which is more than evident in the red bars on Charts No. 4 & 5 below. They have little chance of delivering into their short positions, although a very large number of platinum contracts have already been delivered over the last few years...including the April delivery month. But that fact, like in both silver and gold, has made no difference whatsoever to their paper short positions. The situation for them [the U.S. banks] in this precious metal is as equally dire in the COMEX futures market as it is with the other two precious metals...silver and gold...particularly the former.
Platinum remains the Big commercial shorts' No. 2 problem child after silver. How it will ultimately be resolved is unknown, but most likely in a paper short squeeze, as the known stocks of platinum are minuscule compared to the size of the short positions held -- and that's just the short positions of the world's banks I'm talking about here.
And as of May's Bank Participation Report, 23 banks [both U.S. and foreign] were net short 34.3 percent of platinum's total open interest in the COMEX futures market, which is actually up from the 32.3 percent that these same 23 banks were net short in May's BPR. The reason the percentage is up, not down, is because total open interest in platinum decreased by 6,054 contracts month-over-month, which increases the bank's concentration percentage.
Here's the Bank Participation Report chart for platinum. Click to enlarge.
In palladium, '3 or less' U.S. banks are net long 1,816 COMEX contracts, up from the 1,503 contracts that '3 or less' U.S. banks were net long in the May BPR.
Also in palladium, '13 or more' non-U.S. banks are net long 1,108 COMEX contracts, up from the 863 contracts that '13 or more' non-U.S. banks were net long in the May BPR.
It should be noted that these are record high numbers for all the banks -- and also represent a decent chunk of total open interest.
But as I've been commenting on for almost forever, the COMEX futures market in palladium is a market in name only, because it's so illiquid and thinly-traded. Its total open interest in yesterday's COT Report was only 11,541 contracts...compared to 67,537 contracts of total open interest in platinum... 137,871 contracts in silver -- and 436,301 COMEX contracts in gold.
The only reason that there's a futures market at all in palladium, is so that the Big 8 commercial traders can control its price. That's all there is, there ain't no more.
As of this Bank Participation Report, 16 banks [both U.S. and foreign] are net long 25.3 percent of the entire COMEX open interest in palladium ...compared to the 18.1 percent of total open interest that those same 16 banks were net long in the May BPR.
For the last 3+ years, the world's banks have not been involved in the palladium market in a material way. And with them now net long by fairly decent amounts, it's all hedge funds and commodity trading houses that are left on the short side.
Here’s the palladium BPR chart. Although the world's banks are now net long at the moment, it remains to be seen if they return as big short sellers again at some point like they've done in the past. Click to enlarge.
Excluding palladium for obvious reasons, and the non-U.S. banks in platinum, plus almost all of the non-U.S.. banks in gold and silver...only a small handful of the world's banks, most likely no more than 6 or so in total -- and mostly U.S.-based, except for HSBC, Barclays and maybe Standard Chartered... continue to have meaningful short positions in the precious metals. It's a near certainty that they run this price management scheme from their in-house/ proprietary trading desks...although it's a given that some of their their clients are short these metals as well.
But as I pointed out above, the world's commodity trading houses and some hedge funds are also mega net short the four precious metals...it's not just the banks.
And as has been the case for years now, the short positions held by the Big 4/8 traders/banks, is the only thing that matters...especially the short positions of the Big 4 -- and how this is ultimately resolved [as Ted said earlier] will be the sole determinant of precious metal prices going forward.
The Big 8 commercial traders, along with Ted's raptors...the small commercial traders other than the Big 8 commercial shorts...continue to have an iron grip on their respective prices -- until they don't.
At this point in time, nothing has changed in that regard...although their attempts to engineer prices lower recently, appears to be far weaker than it has been in the past. But having said that, I haven't counted them down and out just yet.
But considering the current state of affairs of the world's banking and financial system as it stands today -- and the physical shortage in silver -- and maybe in gold and platinum as well, the chance that these big bullion banks and commodity trading houses could get overrun at some point, is not zero -- and certainly within the realm of possibility if things go totally non-linear.
However, as Ted keeps reminding me, if they do finally get overrun...it will be for the very first time.
I have about an average number of stories, articles and videos for you today...but if you're looking for Doug Noland's latest missive...there was nothing new posted on his Internet site as of 4:50 a.m. EDT this morning.
CRITICAL READS
The End of Easy Money: Bankruptcy Filings Pile Up at Fastest Rate since 2010 -- Wolf Richter
It’s turning into a banner year for corporate bankruptcy filings, after years of Easy Money that caused all kinds of excesses, fueled by yield-chasing investors, in an environment where the Fed had repressed yields with all its might. Those yield-chasing investors kept even the most over-indebted zombies supplied with ever-more fresh money. But that era has ended. Interest rates are much higher, and investors are getting a little more prudent, and Easy Money is gone.
At the peak of the Fed’s yield repression in mid-2021, “BB”-rated companies – so these companies are “junk” rated – could borrow at around 3% (my cheat sheet for corporate credit rating scales by ratings agency). Companies are junk rated because they have too much debt and inadequate cash flow to service that debt. In other words, investors risked life and limb to earn 3%, and now these investors are asked to surrender life and limb, so to speak. But that’s how it goes with yield-chasing.
These “BB” junk bond yields have risen to nearly 7%. This means these companies that had trouble producing enough cash flow to service their 3% or 5% debt, have to refinance this debt when it comes due, or add new debt, at 7%. That 7% may still be low, considering inflation running around near that neighborhood, but it puts a lot more strain on those companies.
So lots of over-indebted junk-rated companies will restructure their debts in bankruptcy court at the expense of stockholders, bondholders, and holders of their leveraged loans. That’s how it’s supposed to work. That’s how the corporate-debt burden gets lifted off the economy. And it’s starting to work that way.
This commentary from Wolf was posted on his website on Wednesday -- and I found it in a Zero Hedge article that Brad Robertson sent our way. Another link to it is here. A directly related ZHstory from Thursday evening, also from Brad, is headlined ""Just the Tip of the Iceberg": CMBS Storm Unfolds as Delinquent Office Loans Hit Five-Year High" -- and linked here.
Newt Gingrich Calls Out the "Skull & Bones" Society on national television
This 1:35 minute video clip with host Maria Bartiromo on June 6 came as a real surprise, as I was amazed that anyone in the Washington establishment would dare mention them in public.
G. Edward Griffin and James Perloff describe this despicable organization in their books -- and the watered-down Wikipedia version of what they're about is linked here.
I found the clip in an infowars.com article that Brad Robertson sent me on Tuesday -- and I've been saving it for today's column for content reasons.
When I and others mention 'the powers-that-be'...these are some of them. Another link to it is here.
Forget inflation: deflation is the real danger -- Ambrose Evans-Pritchard
The global inflation shock of the last two years is over bar the shouting. Legacy effects will generate much noise for a few months but the one-off spike is reversing almost everywhere with an elegant symmetry.
China is sliding into outright deflation as its post-Covid recovery peters out. Wage cuts are spreading in a surreal replay of what happened in Europe and America during the 1930s. Such is the Spartan ethos of Xi Jinping’s ‘common prosperity’ campaign.
The Chinese producer price index has been negative for seven months, and the downward slide is accelerating. The headline CPI inflation rate has already dropped to 0.1pc and will soon be negative. The Shanghai region is at minus 1.1 pc already.
This has large implications. China remains the workshop of the world, with the scale to shift the global pricing structure. It needs to export its way out of an economic depression and will not hesitate to do so with a cheaper yuan, down 12pc since early 2022. A wave of disinflation is coming our way.
Wei Yao from Societe Generale says the regime seems paralysed in the face of a deepening Japan-style trap. “The zero-COVID shock and the housing crash last year seem to have brought China’s implicit government debt stress close to a breaking point. For China to escape a severe deflation scenario, the policy mindset requires a reset. We have seen little willingness so far,” she said.
Land sales for developers underpinned local government budgets during the property bubble. The real estate crash has dried up the revenue, setting off a funding crisis. Forced belt-tightening has neutralised a key instrument used by Beijing to inject stimulus into the economy.
Caixin magazine reported last week that the local authorities are drowning under $10 trillion of ‘hidden debt’ that they can no longer fully service. Some are having to cut medical benefits for the elderly. The orthodox (IMF) way out is to wipe the slate clean with root-and-branch restructuring of debts, which is what Japan failed to do in the 1990s, and China is now failing to do, because it is traumatic and runs into powerful vested interests.
The central bank (PBOC) is trickling out support but to little avail. It is pushing on a string, to borrow from Keynes. The transmission mechanism is broken.
This longish, but very worthwhile commentary from Ambrose is posted in the clear on the msn.com Internet site -- and I found it on the gata.org website. Another link to it is here. Gregory Mannarino's sometimes mildly 'ADULT' rated commentary from yesterday is linked here -- and it lasts for about 15 minutes.
The entire euro system faces failure -- Alasdair Macleod
In these dog days of summer, there is a new complacency over the financial and economic status of the Eurozone. Inflation is down, bank shares have rallied, and the end of further rises in interest rates is in sight.
The lull in bad news conceals a deteriorating situation. In common with other markets, Eurozone bond yields are rising, and banks are now visibly trying to reduce their excessive balance sheet leverage. This is bound to lead to credit shortages in the coming months, maintaining or even driving interest rates higher. Contracting credit could lead to funding dislocations for highly indebted Eurozone governments, all mired in debt traps.
Presiding over all this is a clueless ECB, long on rhetoric and short on economic nous. Furthermore, even though it has reduced its balance sheet by a trillion euros, the hidden losses in the euro system wipes out its equity many times over. How can it recapitalise itself, and how can it underwrite depositors in a deteriorating commercial banking system?
It is a recipe for an entire systemic failure.
Another short novel from Alasdair on the goldmoney.com Internet site, which I'll get around to reading on the weekend sometime. I found it in a GATA dispatch yesterday -- and another link to it is here.
The Coming Shock to the Global Monetary System -- Jim Rickards
On August 22, about 2½ months from today, the most significant development in international finance since 1971 will be unveiled.
It involves the rollout of a major new currency that could weaken the role of the dollar in global payments and ultimately displace the U.S. dollar as the leading payment currency and reserve currency.
It could happen in just a few years.
The process by which this will happen is unprecedented, and the world is unprepared for this geopolitical shock wave.
This monetary shock will be delivered by a group called the BRICS.
The acronym BRICS stands for Brazil, Russia, India, China and South Africa.
This play for global reserve currency status by the BRICS will affect world trade, direct foreign investment and investor portfolios in dramatic and unforeseen ways.
The most important development in the BRICS system concerns the expansion of BRICS membership. This has led to the informal adoption of the name BRICS+ for the expanded organization.
There are currently eight nations that have formally applied for membership and 17 others that have expressed interest in joining. The eight formal applicants are: Algeria, Argentina, Bahrain, Egypt, Indonesia, Iran, Saudi Arabia and the United Arab Emirates.
This interesting commentary from Jim put in an appearance on the Zero Hedge website at 7:45 p.m. on Thursday evening EDT -- and I thought it best to wait for today's column to post it. Another link to it is here.
Ghana returns to gold top spot in Africa as output jumps 32%
Ghana recorded a 32% increase in gold production last year, enabling it to win back the top spot from South Africa as the largest gold producer on the continent, the president of the mines chamber said on Friday.
Ghana lost the position to South Africa in 2021 after a drastic fall in output.
Gold output rose to 3.7 million ounces in 2022 from 2.8 million ounces the previous year, driven by growth in the output of both large and small-scale sectors.
"The large-scale gold sub-sector recorded its highest output in the country’s history in 2022," Joshua Mortoti, the President of the Ghana Chamber of Mines, told members at the annual general meeting.
He said a combination of output and the expansion of production at existing mines drove the large-scale sector’s contribution to national gold output up by 13% to 3.1 million ounces last year from 2.7 million ounces in 2021.
Mortoti said member companies of the mines chamber had sold over 77,620 ounces of gold under the Domestic Gold Purchase Programme, a scheme launched by the Bank of Ghana to boost reserves.
The above six paragraphs are all there is to this brief gold-related news item that showed up on the reuters.com Internet site at 7:38 a.m. PDT on Friday morning -- and is another story that I found embedded in a GATA dispatch. Another link to it is here.
The Photos and the Funnies
Still at the Revelstoke dam on September 4, we toured the historic site nearby, where I took the first three photos -- and then headed north past the dam...where I took the fourth picture looking back down the highway from whence we'd just come. I thought the lone cyclist, juxtaposed against the geology of the area, was particularly striking. This photo looks even more impressive when displayed on a large flat-screen TV. If you'd like to see that for yourself, just let me know -- and I'll send you the original photo, which is a 21 megabit file. Click to enlarge.


The WRAP
"Understand this. Things are now in motion that cannot be undone." -- Gandalf the White
Today's pop 'blast from the past' dates from very late 1964 -- and was the debut single of a British rock group that shot to stardom shortly after, as part of the 'British Invasion' of North America going on at the time. It finished No. 2 on the Billboard Hot 100 of that year. It was kept from the No. 1 spot by "Mr. Lonely" by Bobby Vinton. It's old enough where the video is in black & white -- and the link is here. There's a bass cover to this as well -- and it's far more intricate than I ever realized. That's linked here.
Today's classical 'blast from the past' is one of the famous orchestral works ever composed -- and it's not even 100 years old yet. His Boléro was one of the last completed works before illness forced French composer Maurice Ravel into retirement.
The composition was a sensational success when it premiered at the Paris Opéra on 22 November 1928 -- much to the surprise of the composer, who had predicted that most orchestras would refuse to play it.
It still brings down the house every time and everywhere it's performed -- and I've been fortunate to experience this live on two separate occasions. Here's superstar Maestro Valery Gergiev with the London Symphony Orchestra -- and the link to it is here.
It was a 'nothing' day in gold on extremely light volume -- and there's nothing that should be read into Friday's price action except to note that there was no follow-through from its big rally on Thursday...which certainly looked like short covering to me.
Silver's price spike at 8:30 a.m. in New York came within a penny of its 50-day moving average before it was hauled lower. Volume in it was on the lighter side, but much heavier on a relative basis than Friday's volume in gold.
Platinum had its third down day in a row, touching $1,000 in its current front month at its low tick. Its 50-day, sitting at $989 spot, remains a tempting target for the commercial traders, which are mostly U.S. bullion banks...as per today's Bank Participation Report. Even blowing through it by a goodly amount won't help them that much, as they are horridly short, with no change of covering even a decent portion of it no matter what they do.
Palladium's price was also engineered lower -- and was closed on Friday at a price not seen since June of 2019. The commodity trading houses and hedge funds are mega short this precious/industrial metal, as the world' banks are net long this commodity by respectable amounts.
Although copper was allowed to trade above its 200-day moving average intraday on Friday, it was hauled down and closed below it by 2 cents... finishing the Friday session at $3.79/pound...down a penny from Thursday.
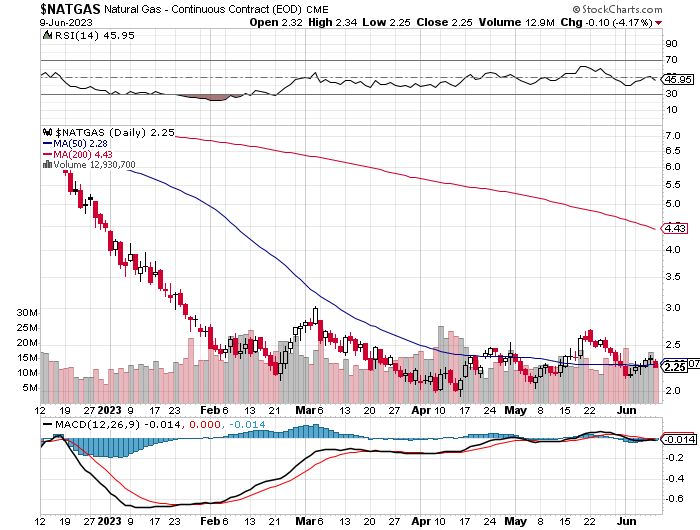
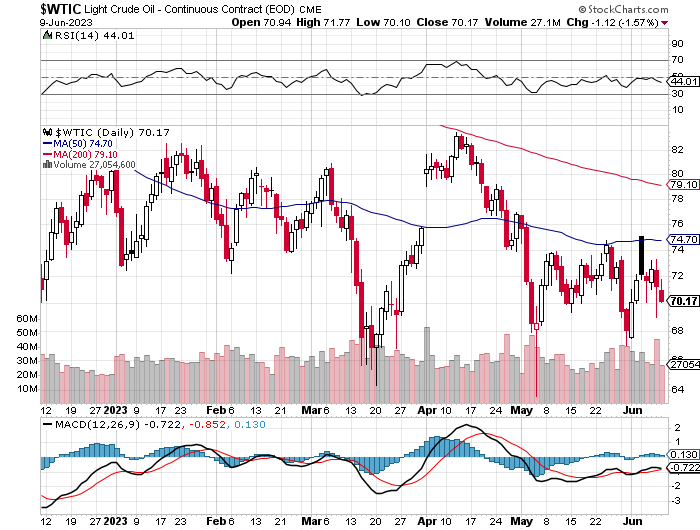
Natural gas's sojourn above its 50-day moving average was brief, as it was closed below it by 3 cents on Friday, as it finished the day at $2.25/1,000 cubic feet...down a dime from Thursday. WTIC was closed even further below its 50-day moving average, at $70.17/barrel...down $1.12 on the day.
Here are the 6-month charts for the Big 6+1 commodities, thanks to the folks over at the stockcharts.com Internet site as always and, if interested, their closing prices in their respective current front months should be noted. Click to enlarge.
Outside of the fact that the world's financial and monetary systems continue to circle the drain at an ever-increasing rate...the price management scheme continues in the commodities sector in general -- and in the precious metals in particular, with silver being the poster child in that arena.
Of course -- and under the hood in the COMEX futures market in silver is the fact that the Big 4 short holders have been moving heaven and earth not to add to their short short positions in that precious metal...which they haven't.
Looking at the Big 8 shorts in silver in total, their short position has remained remarkable steady around the 51,500 contract mark since early March -- and that's despite the ups and down in price we've had during that time period... including the $6 rally off its March 10 low tick.
Ted Butler has been going on about this 'sea change' in silver for some time now -- and rightly so...with the other big silver surprise being the sudden appearance of a Managed Money trader in the Big 4 short category. What they're doing there at this price level is a complete mystery...but the fact that they're there at all, just adds to the 'man bites dog' situation.
In his latest commentary in the public domain on Wednesday headlined "Mission Accomplished?" -- and linked again here...he had this to say...
"Then why the question mark on the mission being accomplished? Because despite everything I’ve alleged (or speculated about) to this point being as real as rain and easily verified by the actual record; whether we are actually at the end of the silver manipulation is dependent on whether the former big commercials shorts add aggressively to new short positions on the next silver price rally. If they do add aggressively to shorts, that would suggest I am incorrect in what I have just written. In that case, there should be ample time to adjust my thinking and positioning, because a decent rally would have already occurred. If they don’t add aggressively to such short positions, then that rally should prove epic -- and we won’t have to sit around and wonder any longer about the silver manipulation.
I can’t rule out the possibility of a continued sell-off, perhaps a sharp one, in the immediate period ahead; but neither is such a sell-off guaranteed. Should we get yet another deliberate price rig to the downside, that will only enhance the prospects for the coming eventual rally being one for the ages."
Like you, dear reader, I'm just waiting for the current set-up in silver to hatch into something -- and that's despite the bearish situation in gold, which may or may not make a difference this time around.
But the timeline for this to unfold is something not know to us -- and is not knowable. Only the powers-that-be have that information -- and none of us are on their distribution list. As has always been the case, all we can do is to continue waiting it out.
I'm still "all in" -- and have one eye on next week's FOMC meeting...wondering what the commercial traders of whatever stripe might have up their sleeves.
I'm done for the day -- and the week -- and I'll see here on Tuesday.
Ed
About the author

SUBSCRIBE: https://edsteergoldsilver.com/

Ed Steer’s Daily Analysis of the Gold and Silver Markets
After eight years of writing about the precious metals for Casey Research, the folks at Stansberry & Associates—who just recently purchased controlling interest in the company—decided that my ‘niche market’ column didn’t fit into their plans.
Since the time that Casey Research was kind enough to offer me a stand-alone column, it became their most highly-rated blog almost from the outset—and has remained that way up to this date...