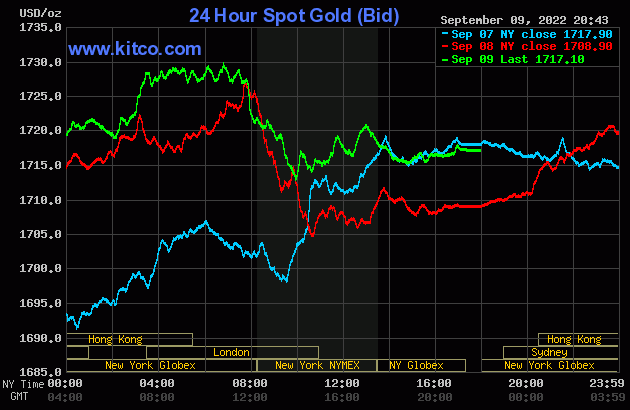
The gold price began to rally quietly and a bit unevenly from the 6:00 p.m. open in New York on Thursday evening, until 1 p.m. China Standard Time in GLOBEX trading on their Friday morning -- and after getting sold lower for about an hour, it rallied rather smartly until it ran into 'something' around 8:30 a.m. in London. Its attempts to rally from there were firmly turned lower multiple times, until even more resolute selling appeared minutes before 1 p.m. in London/8 a.m. in New York. Gold's low in New York was set exactly at the 10 a.m. EDT afternoon gold fix in London, right on the button -- and its ensuing rally was capped and turned lower at precisely 1 p.m. EDT. The sell-off from there lasted until around 2:45 p.m. in after-hours trading -- and it chopped a bit higher from there until the market closed at 5:00 p.m. EDT.
The low and high ticks in gold were recorded as $1,710.00 and $1,730.60 in the October contract -- and $1,719.40 and $1,740.50 in December. The October/December price spread differential in gold at the close in New York yesterday was $9.80...December/February was $12.50 -- and February/April was $14.80 an ounce.
Gold was closed on Friday afternoon in New York at $1,717.10 spot, up $8.20 on the day -- and about 13 bucks off its Kitco-recorded high tick. Gross gold volume in October and December combined was nothing really special at 159,000 contracts -- and there was 5,000 contracts worth of roll-over/switch volume on top of that, with almost all going into the New Year.
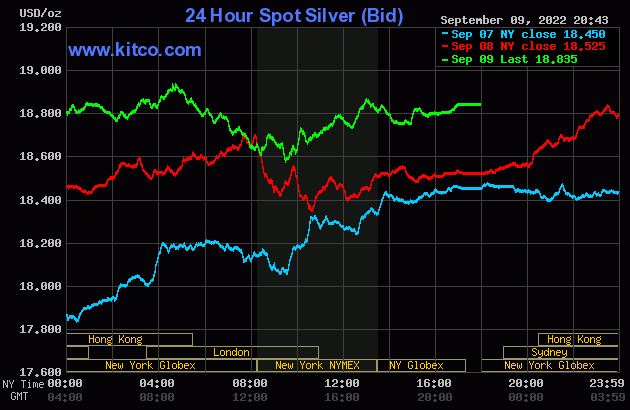
Silver's price path in GLOBEX trading in the overseas markets was virtually the same as gold's, with its high tick of the day coming around 9:45 a.m. in London. From there it was sold lower until its low tick was set at precisely 9:30 a.m. in New York...the open of the equity markets. Its ensuing rally was capped at exactly 1 p.m. EDT...the same as gold -- and it then had a quiet but somewhat uneven down/up move until trading ended at 5:00 p.m. EDT.
The low and high ticks in silver were reported by the CME Group as $18.445 and $18.86 in the December contract. The September/December price spread differential in silver at the close yesterday in New York was 10.9 cents -- and December/March was 13.4 cents an ounce.
Silver was closed in New York on Friday afternoon at $18.835 spot, up 31 cents on the day and about a dime below its Kitco-recorded low tick. Net volume was nothing special at around 42,300 contracts -- and there was a bit over 2,300 contracts worth of roll-over/switch volume in this precious metal... mostly into the New Year as well.
There's a premium of 17 cents an ounce in the spot month over September futures. This premium amount -- and higher, has existed for at least ten days now -- and is something that Ted has said that he's never seen before. But it just screams of tightness in the good delivery bar market.
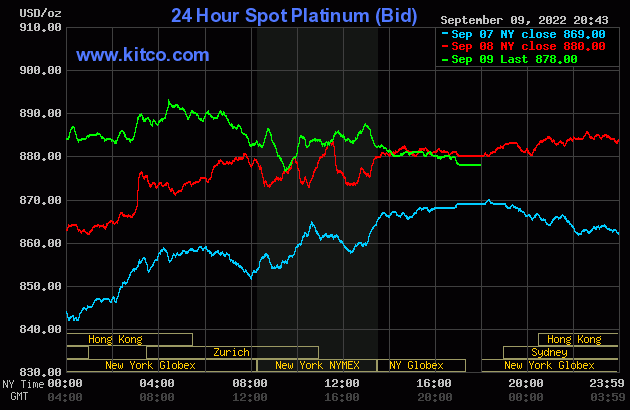
The platinum price crept/stair stepped its way very quietly higher until it also ran into 'something' around 10:25 a.m. CEST in GLOBEX trading in Zurich. From that juncture it was sold equally quietly and unevenly lower until the market closed at 5:00 p.m. EDT in New York. Platinum was closed at $878 spot, down 2 bucks on the day.
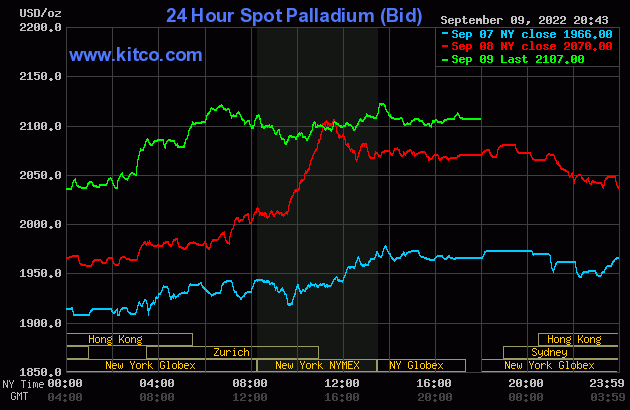
The palladium price began to head lower starting around 9 a.m. China Standard Time on their Friday morning in GLOBEX trading -- and its low appears to have been set at noon CST. It stair-stepped its way smartly higher from there until it topped out around 12:40 p.m. CEST in Zurich. It, like silver, was then sold lower until the equity markets opened in New York -- and from that point it crawled quietly higher until the COMEX close. It was then sold lower for a bit in the very thinly-traded after-hours market -- -- and didn't do a thing after that. Palladium was closed at $2,107 spot, up 37 dollars from Thursday.
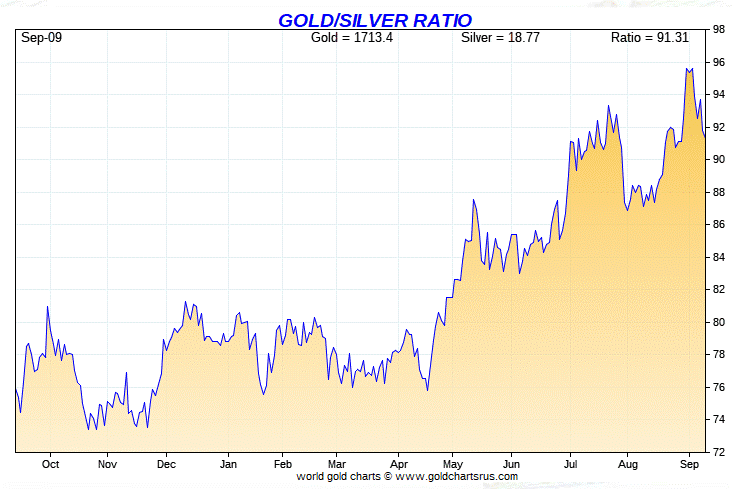
Based on the kitco.com spot closing prices in silver and gold posted above, the gold/silver ratio worked out to 91.2 to 1 on Friday...compared to 92.2 to 1 on Thursday.
And here's Nick Laird's 1-year Gold/Silver Ratio Chart, updated with this past week's data and, as is always the case, Friday's gold/silver ratio data point isn't on it. Click to enlarge.
![]()
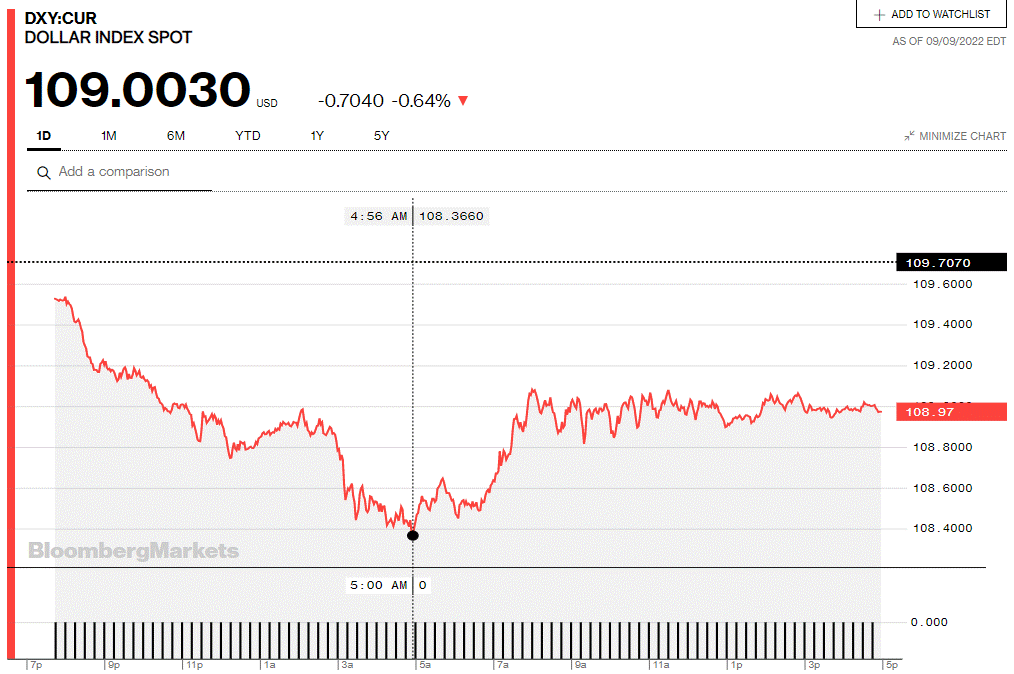
The dollar index closed very late on Thursday afternoon in New York at 109.71 -- and then opened lower by 13 basis points once trading commenced at 7:34 p.m. EDT on Thursday evening, which was 7:34 a.m. China Standard Time on their Friday morning. From that point it wandered quietly lower until its low tick was set a 9:56 a.m. in London. It then rallied a bit until 1 p.m. BST/8 a.m. EDT -- and from that juncture it chopped/wandered very quietly sideways to a bit lower until the market closed at 5:00 p.m. in New York.
The dollar index closed very late on Friday afternoon in New York at 108.97 -- and down 73 basis points on the day, but 50 basis points points of its recorded low tick in London.
Here's the DXY chart for Friday, thanks to Bloomberg, as I was able to log on without getting the usual message that I had to subscribe before I could look at anything. Click to enlarge.
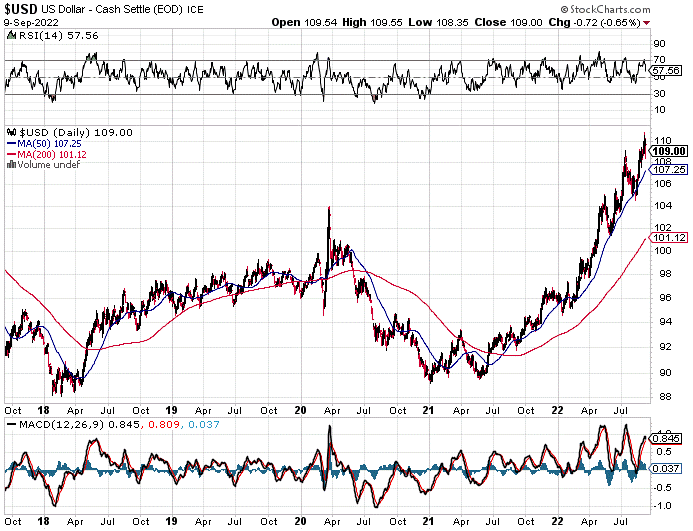
And here's the 5-year U.S. dollar index chart that appears in every Saturday column in this spot, courtesy of stockcharts.com as always. The delta between its close...109.00...and the close on the DXY chart above, was about 3 basis points above its indicated spot close on the DXY chart above. Click to enlarge as well.
U.S. 10-Year Treasury: 3.3210%...up 0.0290 (+0.88%)...as of 02:59 p.m. EDT
Here's the 5-year 10-year U.S. Treasury chart from the yahoo.com Internet site -- and it puts the yield curve into a somewhat longer-term perspective. I note that, for the first time, the Fed has allowed its yield to exceed what was set back at its highs of September and October of 2018. Click to enlarge.
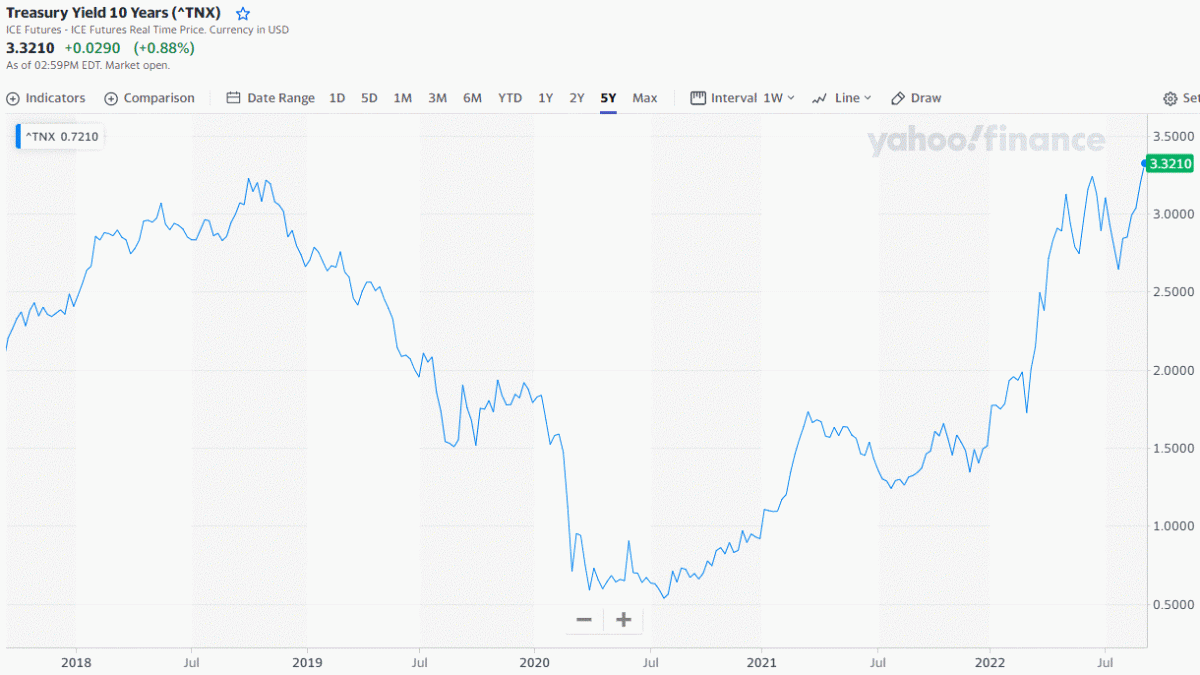
With the threat of another 75 basis point high in interest rates at the next fed meeting, it will be interesting to see how Mr. Bond Market reacts to that as that date approaches, starting ten days from now.
![]()
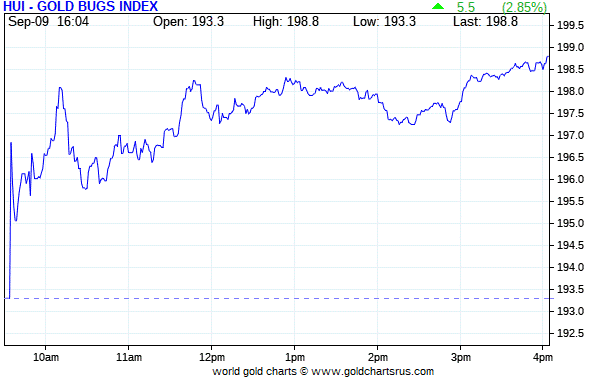
The gold shares gapped higher by a bit at the 9:30 opens in New York on Friday morning -- and then continued to wander/chop higher for the rest of the day. The HUI closed on its high tick, up 2.85 percent.
Computed manually, sansPeñoles once again, Nick Laird's Intraday Silver Sentiment/Silver 7 Index closed higher by 3.16 percent. I was underwhelmed.
Peñoles only traded 100 shares yesterday, closing up 5.99 percent, so I left it out and computed the index on what the remaining six silver companies did.
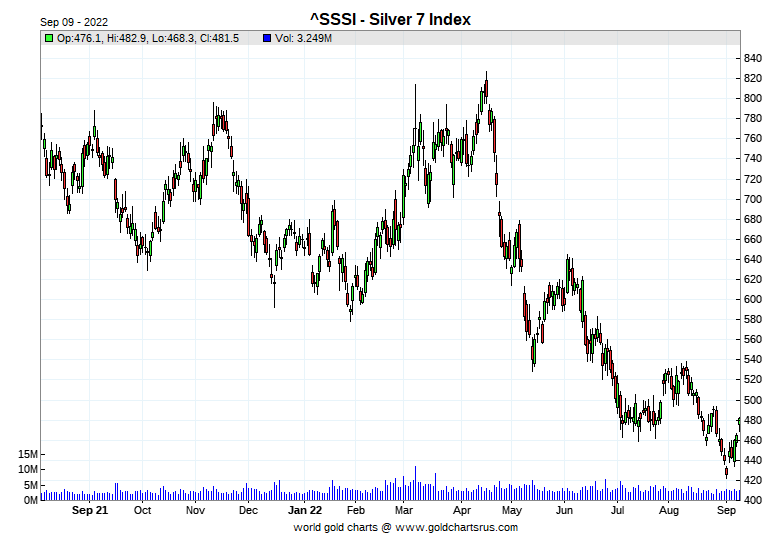
Here's Nick's 1-year Silver Sentiment/Silver 7 Index chart, updated with Friday's candle. Click to enlarge.
The star yesterday was Coeur Mining, as it closed higher by 5.52 percent -- and the biggest underperformer was SSR Mining, closing up only 1.50 percent.
The latest silver eye candy from the reddit.com/Wallstreetsilver crowd is linked here.
![]()
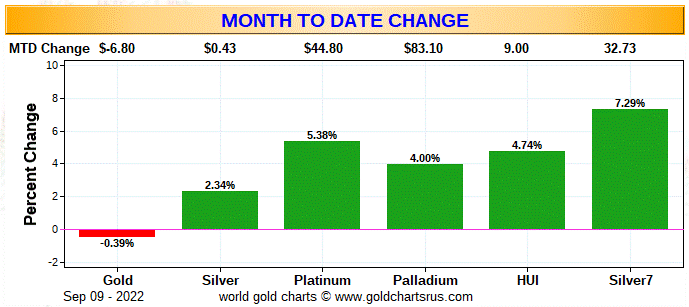
Here are two of the usual three charts that show up in every weekend missive. They show the changes in gold, silver, platinum and palladium in both percent and dollar and cents terms, as of their Friday closes in New York — along with the changes in the HUI and the Silver 7 Index.
There's no weekly chart, because Monday was a holiday in the U.S., so it was a 4-day work week -- and Nick Laird's program that computes the weekly number, would automatically pick up the previous Friday's data, which make it useless. The weekly chart will be back in its usual spot next Saturday.
Here's the month-to-date chart, which is only six business days old, so it's a pretty good proxy for the weekly chart as well. And as you can see, although the silver equities 'outperformed' on an actual basis, the gold stocks outperformed their silver cousins by an absolute country mile based on the performances of their respective underlying precious metals.
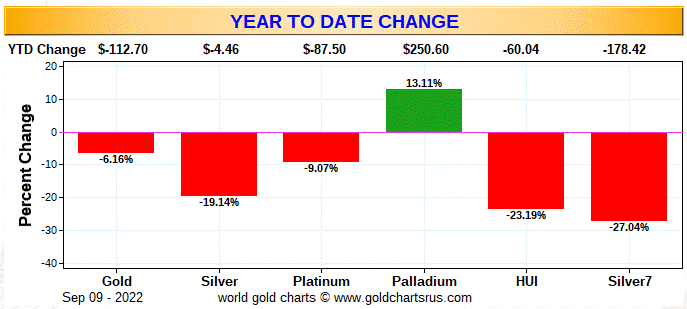
Here's the year-to-date chart and, with the exception of palladium, it's still butt-ass ugly. As I say in this space every week now, it's my opinion that there's been a very quiet and stealthy accumulation of silver equities going on in the deep background for quite some time -- and that fact is certainly obvious on this chart. The mark-down of Pan American Silver shares by that 4.68% about three weeks ago was somewhat counterbalance by that big gain in Peñoles last Friday. But even excluding that fact, just looking at the relative performance of their respective underlying precious metals, the silver stocks are obviously doing much better...relatively speaking of course. Click to enlarge.
Although I beat this to death every Saturday, what happens going forward continues to be in the hands of the commercial traders of whatever stripe, as they alone...as you know all too well...either directly or indirectly control the prices of everything precious metals-related...until they don't. The resolution of this appears to be getting closer with each passing day now.
![]()
The CME Daily Delivery Report showed that 91 gold -- and 19 silver contracts were posted for delivery within the COMEX-approved depositories on Tuesday.
In gold, the two short/issuers were Advantage and Marex Spectron, as they issued 69 and 22 contracts out of their respective client accounts. There were nine long/stoppers in total -- and the two biggest were JPMorgan and S.G. Americas, as they picked up 49 and 18 contracts for their respective client accounts.
In silver, the three short/issuers were Japanese trading house Mizuho, Morgan Stanley and Advantage, as they issued 10, 5 and 4 contracts out of their respective client accounts. ADM stopped 12 for clients -- and BofA Securities picked up the other 7 for their house account.
In palladium, there were 8 contracts issued and stopped and, like on Thursday, all were issued by Japanese trading house Mizuho.
The link to yesterday's Issuers and Stoppers Report is here.
So far in September there have been 3,882 gold contracts issued/reissued and stopped, double the number what was reported last week at this time, which is amazing considering the fact that September is now scheduled delivery month for gold. That number in silver is 6,175 contracts. In platinum, that number is 5 contracts -- and in palladium it's 195 contracts.
The CME Preliminary Report for the Friday trading session showed that gold open interest in September dropped by 947 COMEX contracts, leaving 567 still around, minus the 91 contracts mentioned a few paragraphs ago. Thursday's Daily Delivery Report showed that 1,327 gold contracts were actually posted for delivery on Monday, so that means that 1,327-947=380 more gold contracts were added to September deliveries. Silver o.i. in September fell by 142 contracts, leaving 177 still open, minus the 19 contracts mentioned several paragraphs ago. Thursday's Daily Delivery Report showed that 169 silver contacts were actually posted for delivery on Monday, so that means that 169-142=27 more silver contracts just got added to the September delivery month.
Total gold open interest at the close on Friday increased by 270 COMEX contracts -- and total silver o.i. rose by 532 contracts. Both numbers are subject to some revision by the time the final figures are posted on the CME's website later on Monday morning CDT.
Gold open interest in October rose by 291 COMEX contracts, leaving 42,313 still open.
![]()
There was another withdrawal from GLD yesterday, as an authorized participant removed 48,428 troy ounces of gold -- plus a further 22,100 troy ounces from GLDM. But an a.p. added 552,882 troy ounces of silver to SLV.
In other gold and silver ETFs and mutual funds on Planet Earth on Friday, net of any changes in COMEX, GLD, GLDM & SLV inventories, there was a net 87,227 troy ounces of gold removed. And a net 2,078,140 troy ounces of silver was taken out as well. That was a direct result of the 2,154,628 troy ounces that was pulled out of Deutsche Bank.
There was no sales report from the U.S. Mint yesterday.
Month-to-date the mint has sold only what I reported earlier this week: 21,500 troy ounces of gold eagles -- 11,500 one-ounce 24K gold buffaloes -- and 425,000 silver eagles.
![]()
There wasn't much activity in gold over at the COMEX-approved depositories on the U.S. east coast on Thursday. Nothing was reported received -- and 86,827 troy ounces was shipped out.
In the 'out' category, the largest amount was the 80,292 troy ounces that departed Brink's, Inc. -- and the remaining 6,534 troy ounces left HSBC USA.
There was a bit of paper activity, as 9,457 troy ounces was transferred from the Registered category and back into Eligible over at HSBC USA as well.
The link to Thursday's COMEX activity in gold, is here.
There was very little activity in silver. Nothing was reported received there, either -- and only 243,977 troy ounces was shipped out.
The largest 'out' amount was the 238,958 troy ounces that left JPMorgan. The remaining 5,018 troy ounces/one COMEX contract, departed Brink's, Inc.
There was a bit of paper activity, as 282,381 troy ounces was transferred from the Registered category and back into Eligible -- and all of that happened over an CNT.
The link to Thursday's COMEX silver activity is here.
There was only a tiny bit of activity over at the COMEX-approved gold kilobar depositories in Hong Kong on their Thursday. There were 10 kilobars received at Loomis International -- and one kilobar shipped out of Brink's, Inc. The link to that, in troy ounces, is here.
![]()
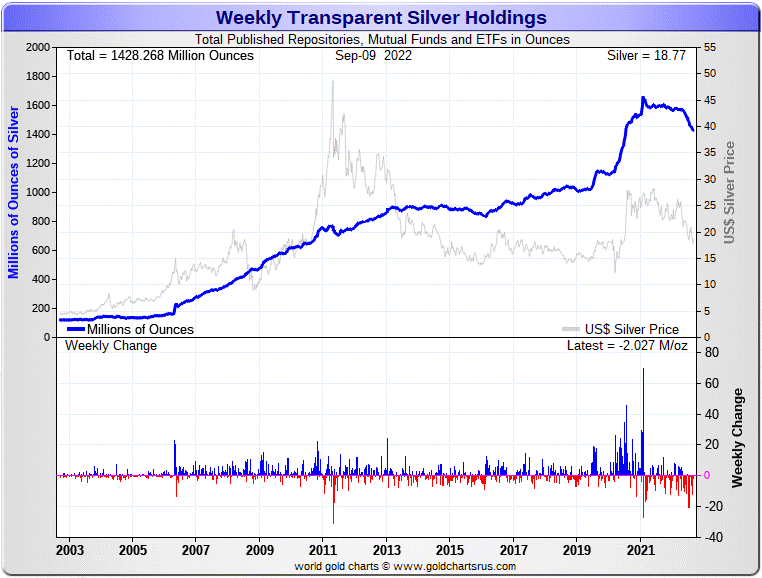
Here are the usual 20-year charts that show up in this space in every Saturday column. They show the total amount of physical gold and silver held in all know depositories, ETFs and mutual funds as of the close of business on Friday.
During the week just past, there was a net 773,000 troy ounces of gold removed -- and a net 2.027 million troy ounces of silver was taken out as well. That weekly withdrawal in silver pretty much equates to what was taken out of Deutsche Bank on Friday. If it hadn't been for that, there would have been no change in silver. Click to enlarge for both.
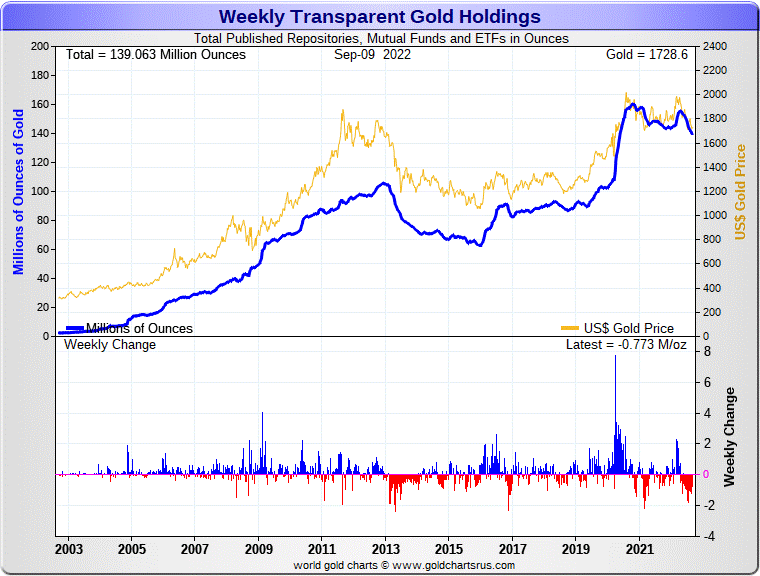
According to Nick Laird's data on his website, there has been a net 3.25 million troy ounces of gold -- plus a net 28.12 million troy ounces of silver removed from all the world's known depositories, mutual funds and ETFs during the last four weeks.
In silver...31 percent of that came out of SLV...8.83 million troy ounces...with 64 percent coming out of the COMEX...18.11 million troy ounces...mostly from JPMorgan. That left about 5 percent/1.4 million troy ounces removed from the rest of the world's ETFs and mutual funds combined over that time period.
In gold over the last month, the withdrawals were mostly COMEX/JPMorgan related...55%/1.78 million troy ounces. GLD/GLDM accounted for about 29%/951,000 troy ounces -- and the rest...16%/520,000 troy ounces, from the other ETFs and mutual funds.
The physical shortage in silver now appears to be even more extreme than it was last week, as the sizeable premium in the spot price over the September futures month has continued all week...made even more glaring by the contango that exists from September and into future delivery months. Very weird -- and a sure sign of physical tightness in the good delivery bar market. It's something that Ted has never seen before...ever.
One also has to wonder just how much of these silver withdrawals we've witnessed this past week [and month] are industrial user-related...or conversion of shares for physical metal. It certainly appears, as Ted Butler has been pointing out, that a lot of these conversions of shares for physical are heading overseas to India and China...mostly the former that's visible in the public domain.
Then there's the amount of silver that has been transferred from the Registered category and back into Eligible that's been going on for many months now. What is to be made of that?
Retail silver demand isn't what it used to be, of course...but there's some decent bottom fishing going on, because everyone senses that the worst might be over. However, the commercial traders of whatever stripe have had different ideas the over the last couple of weeks. But that hasn't stopped people from buying every dip engineered by the commercial shorts.
From what I've seen from the various precious metal websites I lurk at, there's decent inventory in all the popular bar and coins sizes everywhere now -- and the guys & dolls over at Wallstreetsilver continue to add new 'Silverbacks' every day.
But the real shortages, which appear to have begun already, will begin in the wholesale good delivery bar market when the serious money starts flowing into the world's various and sundry, depositories, ETFs and mutual funds, especially SLV, when the next big rally is allowed to begin. That's obviously still in the future at this point. However, one must suspect that with the signs of physical tightness everywhere one cares to look in the wholesale market, the day of reckoning can't be that far off.
Of course not to be forgotten about SLV is this not so little matter of the 51.66 million troy ounces/shares currently sold short in this ETF. That's most likely because the physical metal doesn't exist to deposit without driving the silver price to the moon...if it's even available in good delivery bar form at all, for that matter.
The new short report for SLV for positions held as of the end of August, comes out on Monday -- and I'll have that data for you in my Tuesday column.
Of course there's the other little matter of the 1 billion ounce short position held by Bank of America...with JPMorgan on the long side...that Ted cottoned on to some time ago.
And in closing here, I'll mention once again that it's a certainty that all of the precious metals in these funds are held by the strongest of hands -- and I'm sure that applies to every troy ounce that has been withdrawn or converted from them as well.
![]()
I received two charts from Nick Laird yesterday showing gold and silver withdrawals from the Shanghai Gold Exchange for August. I don't have the room for the charts here...probably in Tuesday's column...but here are the hard numbers. There was 166.12 tonnes/5.34 million troy ounces of gold taken out, plus 296.2 tonnes/9.52 million troy ounces of silver was withdrawn as well.
Silver withdrawals from the SGE have been particularly heavy over the last two months, as have the imports into India.
![]()
The Commitment of Traders Report, for positions held at the close of COMEX trading on Tuesday, showed the expected decrease in the commercial net short position in gold -- and the expected increase in the commercial net long position in silver. Both numbers were far bigger than even I was hoping for.
In silver, the Commercial net long position increased by 4,790 COMEX contracts, or 23.95 million troy ounces.
They arrived at that number by reducing their long position by 2,769 contracts, but also reduced their short position by 7,559 contracts -- and it's the difference between those two numbers that represents their change for the reporting week.
Under the hood in the Disaggregated COT Report, all three categories were net sellers, as the Managed Money traders increased their net short position by a further 3,712 COMEX contracts. They did this by increasing their short position by 6,430 contracts -- and also added 2,718 long contracts. The Other Reportables and Nonreportable/small traders reduced their net long positions by 801 and 277 contracts respectively.
Doing the math: 3,712 plus 801 plus 277 equals 4,790 COMEX contracts, the change in the Commercial net short position.
And before proceeding further, I'll point out that the Managed Money traders in silver, as of Tuesday's cut-off, were net short the COMEX futures market by 24,743 COMEX contracts/123.72 million troy ounces...up from the 21,031 contracts/105.16 million troy ounces they were short in last week's COT Report. I'll have more about this a bit further down.
The Commercial net long position in silver is now up to 5,055 COMEX contracts/25.28 million troy ounces. That's up big from the 1.33 million troy ounces that they were net long in last week's COT Report...an increased of 23.95 million troy ounces. That 23.95 million ounce change is obviously the headline number mentioned further up.
The Big 8 [which has at least two, if not three Managed Money traders in it according to Ted] are short 337.5 million troy ounces in this week's COT Report, down 1.7 million troy ounces from the 339.2 million troy ounces they were short in last Friday's COT Report.
As you know, the Big 8 short position is not a pure commercial trader number because Ted says that there are two -- and now most likely three Managed Money traders in that category....one in the Big 4 -- and the other two in the Big '5 through 8'.
He figures that the 'commercial only' component of the Big 8 is around 90 million troy ounces, down 100 million ounces from the 190 million troy ounces that they were short in last week's COT Report. So it's obvious that the Big 8 shorts were buying every long contract that they were able to during the reporting week just past...but it mostly involved the Big 4 shorts.
His raptors, the approximately 28 small commercial traders other than the Big 8 are net long by about 185 million troy ounces...down about 7,500 contracts from what they were short in last Friday's COT Report.
Here's the 9-year COT chart for silver that puts thing in a longer-term perspective...courtesy of Nick Laird as always. Click to enlarge.
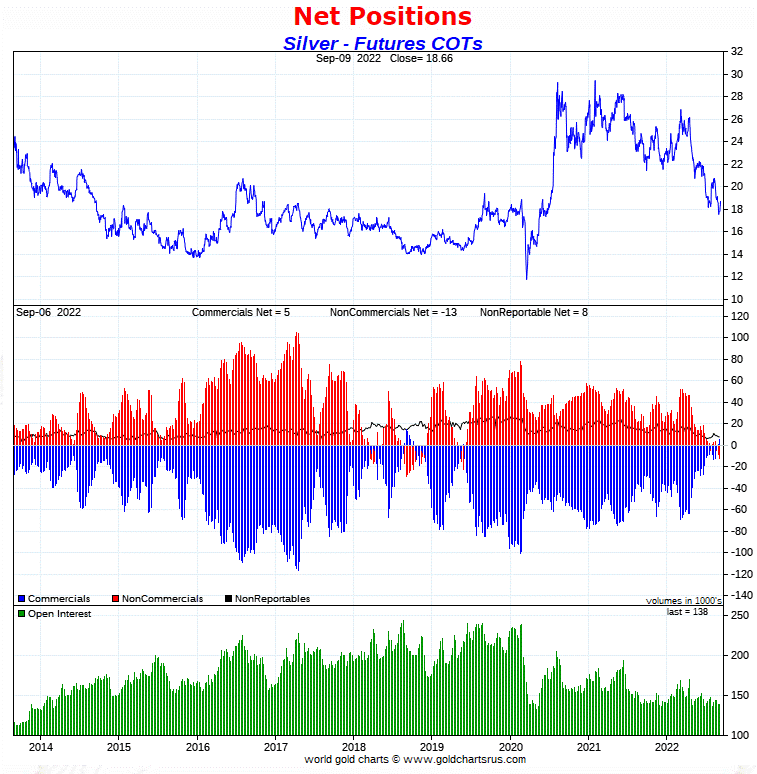
"So, even though we haven't touched silver's low price of July 26...the set-up in the COMEX futures market now, is far more wildly bullish than it was back then."
I used that above paragraph in this spot in last week's column, so this current week's report just adds more fuel to the coming price conflagration.
The big decrease in the commercial net short position...4,790 COMEX contracts...was, as Ted pointed out on the phone yesterday, mostly related to the 5,200 contracts that BofA issued on First Notice Day last week.
There are only two ways to reduce an existing short position in the COMEX futures market. The usual way is to buy a long contract to cover it -- and the only other way is to deliver the physical product itself. That's what BofA did.
That BofA covered a short position by delivering into it, doesn't alter the fact that it does reduce the overall commercial net short position by that same 5,200 COMEX contracts -- and correspondingly reduces the commercial net long position by that amount at the same time, as the long and short positions are extinguished at the same instant the moment delivery is made.
So most, but not all, of the change in the Commercial net short position in the week's COT Report was delivery related...except for the 6,400 contract increase in the gross short position of the Managed Money traders.
But, as just mentioned, that didn't slow down the Managed Money traders, as they continued to short aggressively during the reporting week. As Ted pointed out yesterday, the gross short position held by the Managed Money traders...58,600 COMEX contracts...is now about 8,300 contracts larger than the gross short positions held by all the commercial traders combined.
Who, as Ted said, would be this brain dead to short silver in these quantities -- and at these prices, in the face of tightest physical silver market in history. And as he also said, it appeared that the Big shorts moved heaven and earth to ensure these traders stayed maximum short during this past reporting week -- and since the Tuesday cut-off as well.
Like last week, words fail me in an attempt to describe the current bullish set up for silver...it's most white-hot bullish in COMEX history -- and even more so now. But, as has always been the case...how high we go in price from here -- and how fast, depends entirely on what these big commercial shorts do once Ted's raptors, the small commercial traders other than the Big 8, have sold the bulk of their remaining approximately 167 million troy ounce long position back to the Managed Money traders for big profits.
Will these big shorts step back into the market once again at that juncture, as they've always done in the past, to cap silver's price rise at that point?
Nobody knows that yet, either...but nothing else matters, absolutely nothing!
![]()
In gold, the commercial net short position fell by a very chunky 15,615 COMEX contracts, or 1.56 million troy ounces of the stuff.
They arrived at that number by increasing their long position by 3,148 contracts -- and also reduced their short position by 12,467 contracts. It's the sum of those two numbers that represents their change for the reporting week.
Under the hood in the Disaggregated COT Report, it was all Managed Money traders and then some, as they swung from the net long position they held last week, to a net short position in this week's report. They reduced their gross long position by 5,919 COMEX contracts -- and also added 12,831 new short contracts...for a total weekly change of 18,750 COMEX contracts.
The Nonreportable/small traders were also sellers, as they reduced their net long position by 1,738 contracts...while the Other Reportables were buyers, increasing their net long position by 4,873 contracts.
Doing the math: 18,750 plus 1,738 minus 4,873 equals 15,615 COMEX contracts, the change in the commercial net short position.
As I just mentioned, the Managed Money traders were net long in last week's COT Report to the tune of 11,788 COMEX contracts/1.18 million troy ounces -- and have now turned that into a net short position of 6,962 COMEX contracts as of this week's report.
The commercial net short position in gold sits at 11.41 million troy ounces, down 1.56 million troy ounces from the 12.97 million troy ounces they were short in last Friday's COT Report...which is the change in the headline number mentioned earlier.
The short position of the Big 8 traders works out to 16.77 million troy ounces, down about 0.37 million troy ounces from the 17.40 million troy ounces they were short in the prior week's COT Report.
After this big increase in the Managed Money trader short position during the reporting week, Ted's believes that there's now one big Managed Money traders in each of the Big 4 and Big '5 through 8' short categories.
But his back-of-the-envelope calculation suggests that the 'commercial only' component of the Big 8 shorts is around 14 million troy ounces, down about 1.4 million troy ounces from last week's report.
After 'sleeping on it, Ted said that his raptors, the small commercial traders other than the Big 8, are long gold by 26,000 COMEX contracts/2.6 million troy ounces..."roughly where it's been all along."
Here's Nick Laird's 9-year COT chart for gold, updated with Friday's data. Click to enlarge.
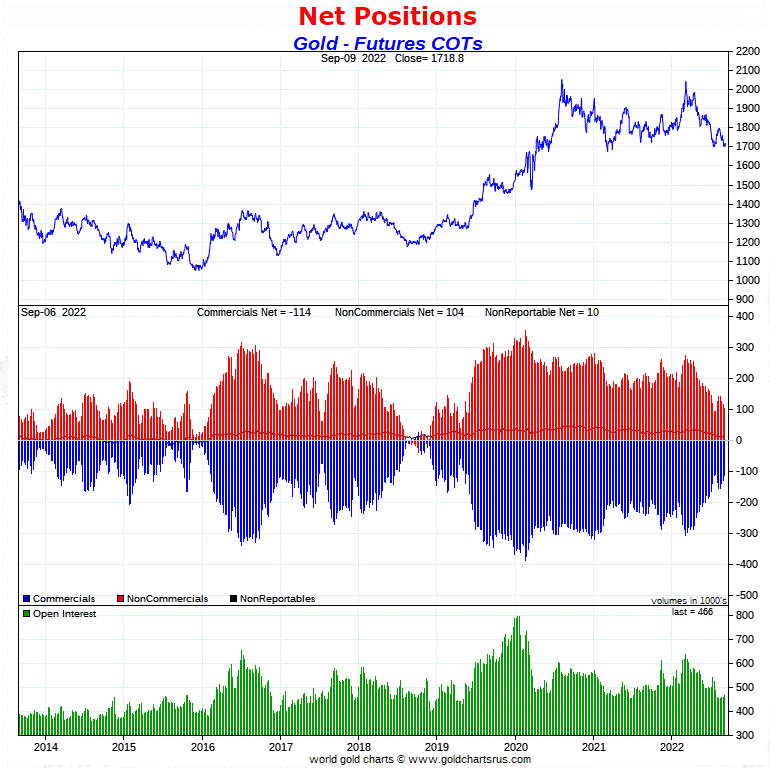
The concentrated short position of the large commercial traders in gold dropped considerably during the reporting week, which is always good news...but it's not yet zero.
As I've been pointing out for the last month or so, the most worrisome aspect of it is that since the low tick in gold was set in late July, they've shown no qualms about shorting the rally that followed -- and their continued improvement this week only corrects part of their current short position in this precious metal...as I just mentioned in the previous paragraph.
The commercial net short position since July 26 -- and except for that week and the week before, is the lowest and most bullish reading in more that three years.
The set-up in gold is still extremely bullish from a COMEX futures market perspective -- and obviously far more bullish than it was a week ago...especially considering the fact that the Managed Money traders are back to being net short once more.
![]()
In the other metals, the Managed Money traders in palladium -- and not surprisingly, flipped from a net long position last week, to a net short position this week, by increasing their short position by 646 COMEX contracts. They are now net short palladium by 404 contracts. Of course this net short position is now back to being a big net long position since the Tuesday cut-off, as it's the very act of these Managed Money traders buying or selling that changes these numbers. In platinum, the Managed Money traders increased their net short position by a further 3,450 COMEX contracts -- and are now net short platinum in the COMEX futures market by 19,075 contracts. Platinum, like in silver, is a bifurcated market in the commercial category, with the Producer/Merchants mega net short -- and the Swap Dealers mega net long.
In copper, the Managed Money traders increased their net short position by a further 2,466 COMEX contracts -- and are net short copper by 11,133 COMEX contracts...about 278 million pounds of the stuff. And, like in platinum and silver, copper is a totally bifurcated market in the commercial category. The Producer/Merchants are net short copper by a very decent amount -- and the Swap Dealers are mega net long.
Whether these bifurcated markets mean anything or not, will only be known in the fullness of time. Ted says it doesn't mean anything as far as he's concerned, as they're all commercial traders in the commercial category.
In this vital industrial commodity, the world's banks...both U.S. and foreign...are net long 14.3 percent of the total open interest in copper in the COMEX futures market as of yesterday's Bank Participation Report for August...up from the 11.9 percent they were net long in July. So it's the commodity trading houses such as Glencore, along with some hedge funds that are mega net short copper.
![]()
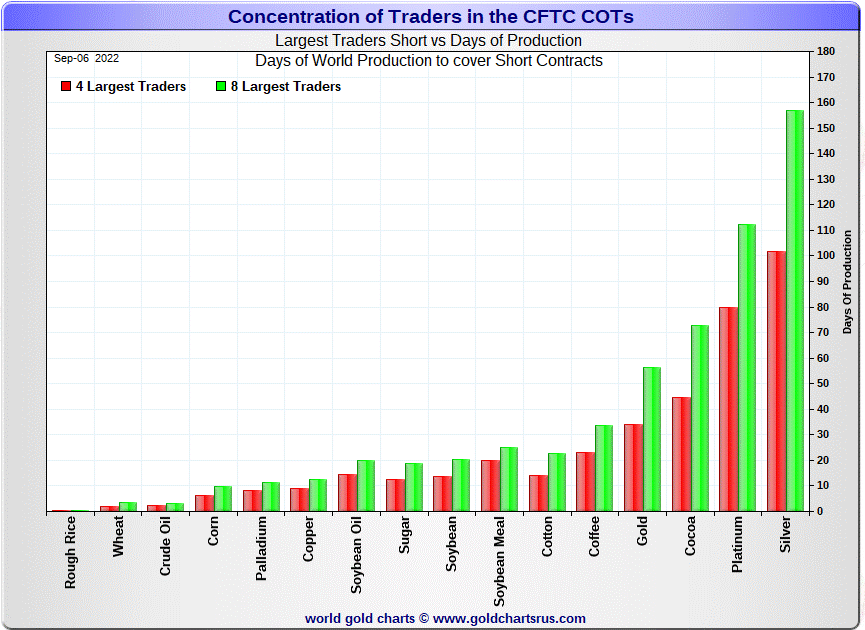
Here’s Nick Laird’s “Days to Cover” chart, updated with the COT data for
positions held at the close of COMEX trading on Tuesday, September 6. It shows the days of world production that it would take to cover the short positions of the Big 4 — and Big '5 through 8' traders in each physically traded commodity on the COMEX.
I consider this to be the most important chart that shows up in the COT series -- and it always deserves a moment of your time...but continues to come with a big caveat attached -- and mentioned in the next paragraph.
Although still important, because the Big 4/8 short categories in the four precious metals...along with a bunch of other commodities, including copper and WTIC...are contaminated by the short positions of Managed Money traders that are embedded in each, this chart is not at all accurate. The take-away here is that the short positions/days of world production of a lot of these COMEX-traded commodities is far less than what this chart indicates.
For that reason, it should be looked at for its 'entertainment value' only -- although the overall 'shape' of the chart would be about right...just not the number of day short held in each by the commercial traders. Most are a lot less than shown...as you'll see in silver below. Click to enlarge.
But the information that follows is accurate, as I'm able to compute this data manually.
In this week's 'Days to Cover' chart, the Big 4 traders are short about 102 days of world silver production, up about 1 day from last week's COT Report. The ‘5 through 8’ large traders are short an additional 55 days of world silver production, down about 2 days from last Friday's report, for a total of about 157 days that the Big 8 are short -- and down 1 day from last week's COT Report.
[Note: As you know, there are most likely three Managed Money traders in the Big 8 short category...one in the Big 4 -- and now two in the Big '5 through 8' category, according to Ted. This fact distorts the numbers you see above -- and below, and the distortions in silver are now so great, that I'm not going to bother doing much in the way of calculations...just approximations.]
That 157 days that the Big 8 traders are short, represents five months and a bit of world silver production, or 337.5 million troy ounces/67,490 COMEX contracts of paper silver held short by these eight traders...three of which are these Managed Money traders.
Ted computed that the Big 8 commercial-only component of that 67,831 contracts was actually only around 32,000 contracts/160 million troy ounces, which works out to about 74 days of world silver production for the Big 8 commercial traders. And using Ted's numbers for the Big 4 commercial-only shorts, the days held short by the Big 4 works out to 42 days of world production. These two 'days of world production' numbers...74 and 42...are vastly different than the 157 days and 102 days that the Big 8 and Big '5 through 8' traders show on the Days to Cover chart above.
This obviously means that the Managed Money traders are short the difference...which is a lot.
That's why the above chart should be looked at for its entertainment value only...particularly in silver.
Ted says that it appears that his raptors, the small commercial traders other than the Big 8, are now net long the COMEX futures market by around 167,000 contracts...down from the about 192,500 contracts they were net long last week. And as I mentioned earlier, Ted says that this drop was delivery related, as they took delivery of most if not all of those 5,200 contracts that BofA delivered on First Notice Day last week. This number is subject to revision once he's 'slept on it'. I will make a change on the website version of today's column once I read his weekly review later today.
Never forget, that despite their small size, they are great in number...about 28 or so at last count -- and still commercial traders in the commercial category.
The Big 8 traders are short 48.8 percent of the entire open interest in silver in the COMEX futures market, which is virtually unchanged the 48.9 percent they were short in the last COT report. And once whatever market-neutral spread trades are subtracted out, that percentage would be close to the 55 percent mark. In gold, it's 36.0 percent of the total COMEX open interest that the Big 8 are short, down a bit from the 37.9 percent they were short in last Friday's COT Report -- and something under the 45 percent mark once their market-neutral spread trades are subtracted out.
But remember that the Big 8 shorts in silver now have three Managed Money traders in their midst -- and most likely two Managed Money traders in gold, so these are not pure numbers, either. They are actually far less than stated, particularly in silver.
The Big 4/8 commercial traders are still a force to be reckoned with in gold and silver, but now much diminished. They improved their situation even more in both during this past reporting week, particularly in silver.
But these improvements have their limits, because at some point, the Managed Money traders et al. will refuse to go further short, or sell more longs -- and once that moment arrives, prices can fall no further, as its their very acts of doing that is what causes prices to fall. But up to this point, that limit certainly hasn't been reached...which is amazing.
As I keep reminding you in this spot every Saturday, the circumstances in silver have been altered by an unimaginable [and monstrously bullish] amount by Ted's discovery of the 1 billion troy ounce physical short position in silver that Bank of America holds in the OTC market, courtesy of JPMorgan & Friends...along with the big increase in Goldman's derivatives position in silver in that market, as shown in the latest OCC Report for Q1/2022...which Ted figures is a long position.
The latest OCC Derivatives Report for Q1/2022 was posted a bit over two months ago now-- and Ted had a lot to say about it in the public domain at that time -- and that's linked here if you wish to refresh your memory. The new OCC report for Q2/2022 won't be out for about another two weeks.
The situation regarding the Big 4/8 concentrated commercial short positions in silver, gold [and in platinum for those commercial traders in the Producer/ Merchant category] is still obscene to some extent, but as I mentioned a few paragraphs ago, has decreased drastically as of late...especially in the Big 4 in silver these past two weeks.
As Ted has been pointing out ad nauseam forever, the resolution of the Big 4/8 short positions will be the sole determinant of precious metal prices going forward...with that resolution currently still a work in progress, obviously.
And, as always, nothing else matters -- and I certainly look forward to what he has to say in his weekly review later this afternoon EDT.
![]()
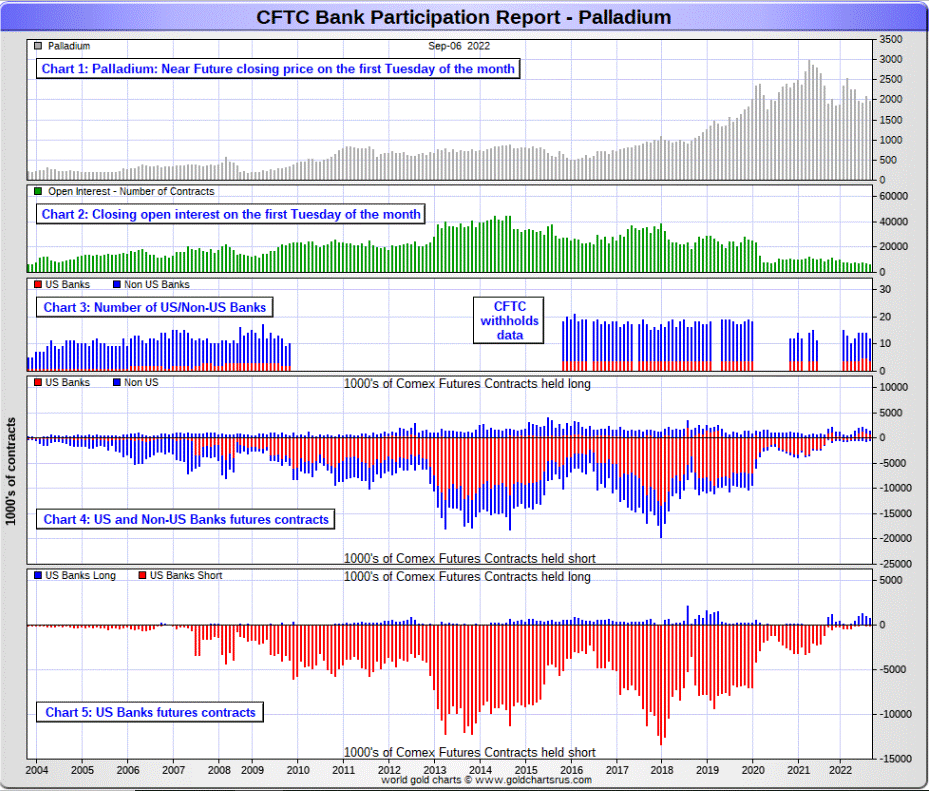
The September Bank Participation Report [BPR] data is extracted directly from yesterday's Commitment of Traders Report. It shows the number of futures contracts, both long and short, that are held by all the U.S. and non-U.S. banks as of Tuesday’s cut-off in all COMEX-traded products.
For this one day a month we get to see what the world’s banks are up to in the precious metals. They’re usually up to quite a bit -- and that was particularly true in silver.
[The September Bank Participation Report covers the time period from August 2 to September 6 inclusive.]
In gold, 5 U.S. banks are net short 42,735 COMEX contracts in the September BPR. In August’s Bank Participation Report [BPR] these same 5 U.S. banks were net short 46,039 contracts, so there was a decrease of only 3,304 COMEX contracts month-over-month. I was expecting a far higher number that, but it was their fifth monthly decrease in a row nonetheless.
Citigroup, HSBC USA, Bank of America and Morgan Stanley would most likely be the U.S. banks that are short this amount of gold. I still have my usual suspicions about the Exchange Stabilization Fund, although if they're involved, they are most likely just backstopping these banks.
Also in gold, 27 non-U.S. banks are net short 40,855 COMEX gold contracts. In August's BPR, 24 non-U.S. banks were net short 39,480 contracts...an increase of 1,375 contracts...not what I was expecting at all, but still down from the 92,025 contracts they were short in the March BPR. I was expecting a big decrease, but this didn't happen.
At the low back in the August 2018 BPR...these same non-U.S. banks held a net short position in gold of only 1,960 contacts -- so they've been back on the short side in an enormous way ever since.
I suspect that there are at least three large banks in this group, HSBC, Barclays and Standard Chartered. I still harbour suspicions about Scotiabank/ Scotia Capital, Dutch Bank ABN Amro, French bank BNP Paribas, plus Australia's Macquarie Futures. Other than that small handful, the short positions in gold held by the vast majority of non-U.S. banks are immaterial and, like in silver, have always been so.
As of this Bank Participation Report, 32 banks [both U.S. and foreign] are net short 17.9 percent of the entire open interest in gold in the COMEX futures market, which is down a tiny bit from the 18.6 percent that 29 banks were net short in the August BPR.
Considering the fact that the gold price was engineered lower by as much as it was during the reporting period -- and that the world's banks didn't do much of anything, it appears certain that its the commodity trading houses and hedge funds that are the ones that are mega short gold in the commercial category in the COMEX futures market -- and have been doing all the price management as of late.
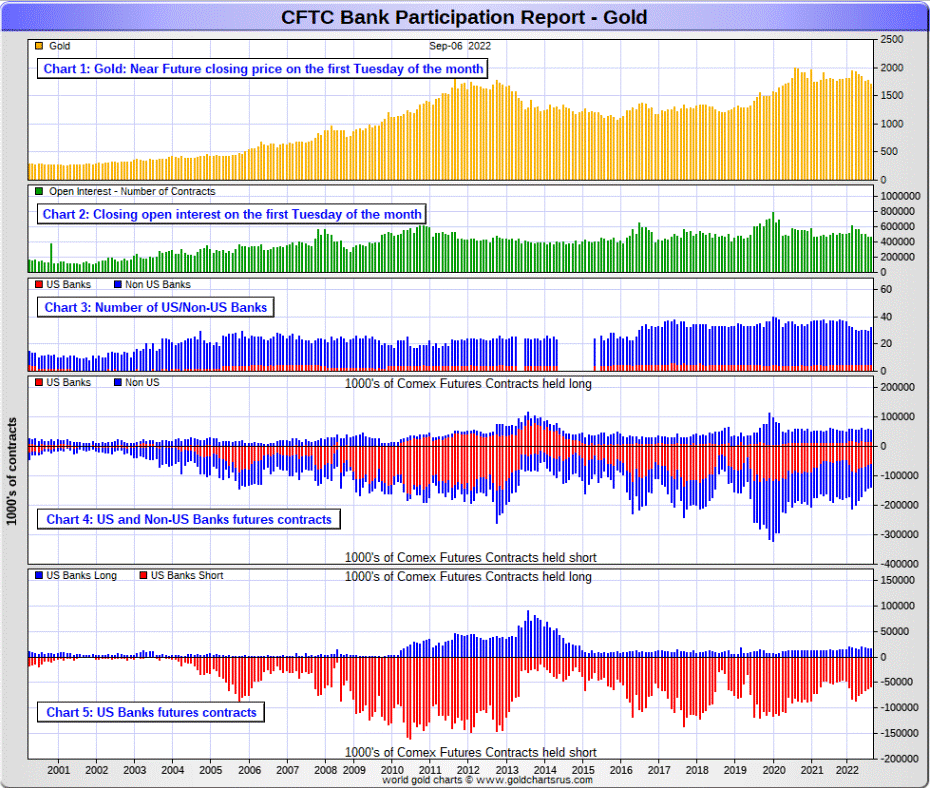
Here’s Nick’s BPR chart for gold going back to 2000. Charts #4 and #5 are the key ones here. Note the blow-out in the short positions of the non-U.S. banks [the blue bars in chart #4] when Scotiabank’s COMEX short position was outed by the CFTC in October of 2012. Click to enlarge.
In silver, 4 U.S. banks are net short 16,554 COMEX contracts in September's BPR. In August's BPR, the net short position of 5 U.S. banks was 23,247 contracts, which is down a hefty 6,693 COMEX contracts from last month.
You'd have to go back to June 2019 to find a lower number than this one.
The biggest short holders in silver of the five U.S. banks in total, would be Citigroup, HSBC USA, Bank of America, Morgan Stanley...and maybe Goldman Sachs...but not JPMorgan according to Ted. And, like in gold, I have my suspicions about the Exchange Stabilization Fund's role in all this...although, also like in gold, not directly.
Also in silver, 19 non-U.S. banks are net short 11,536 COMEX contracts in the September BPR...which is down 4,512 contracts from the 16,048 contracts that 15 non-U.S. banks were net short in the August BPR...the sixth month in a row of decreases. The chart below shows that this is the smallest net short position in silver that the non-U.S. banks have held since late 2012...ten years ago.
I would suspect that HSBC and Barclays hold a goodly chunk of the short position of these non-U.S. banks...plus some by Canada's Scotiabank/Scotia Capital still. I'm not sure about Deutsche Bank... but now suspect Australia's Macquarie Futures. I'm also of the opinion that a number of the remaining non-U.S. banks may actually be net long the COMEX futures market in silver. But even if they aren’t, the remaining short positions divided up between the other 14 or so non-U.S. banks are immaterial — and have always been so.
As of September's Bank Participation Report, 23 banks [both U.S. and foreign] are net short 20.3 percent of the entire open interest in the COMEX futures market in silver— down big from the 28.9 percent that 20 banks were net short in the August BPR. And much, much more than the lion’s share of that is held by Citigroup, HSBC, Bank of America, Barclays, Scotiabank -- and possibly one other non-U.S. bank...all of which are card-carrying members of the Big 8 shorts.
I'll point out here that Goldman Sachs, up until late last year, had no derivatives in the COMEX futures market in any of the four precious metals. But they did show up in the last two OCC Reports. Now they have a $5.96 billion position, virtually all in silver -- and Ted thinks they're long silver in the OTC market. I shan't bother talking about the 1 billion troy ounce short position the Bank of America is short in the OTC market...thanks to JPMorgan & Friends, as I've already covered that ground.
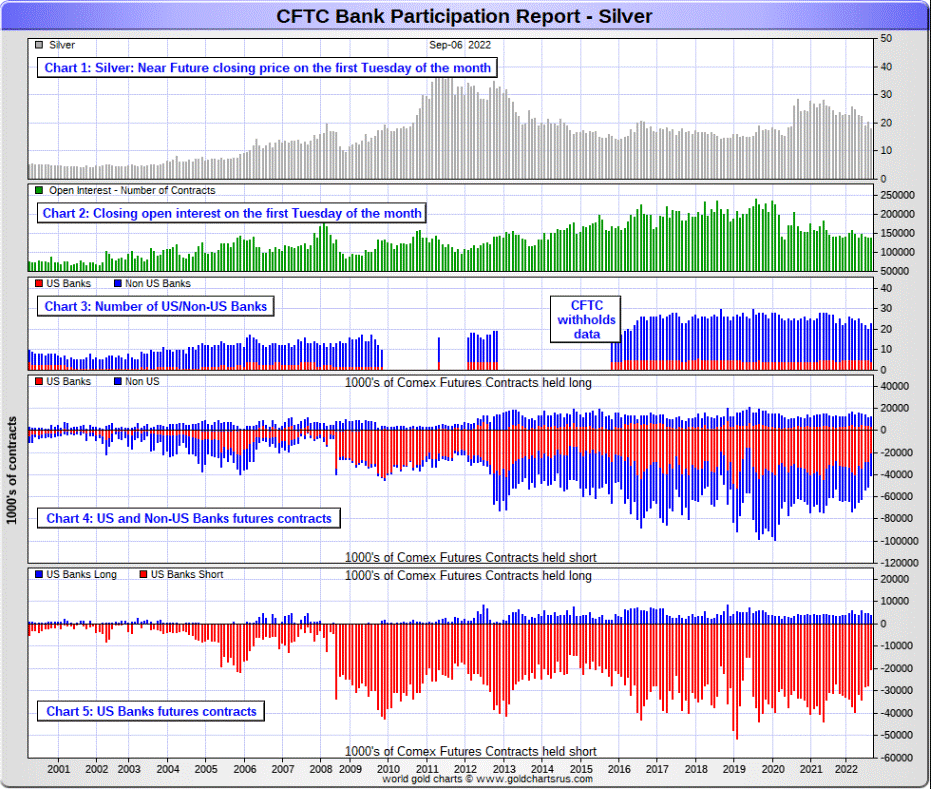
Here’s the BPR chart for silver. Note in Chart #4 the blow-out in the non-U.S. bank short position [blue bars] in October of 2012 when Scotiabank was brought in from the cold. Also note August 2008 when JPMorgan took over the silver short position of Bear Stearns—the red bars. It’s very noticeable in Chart #4—and really stands out like the proverbial sore thumb it is in chart #5. But, according to Ted, as of March 2020...they're out of their short positions, not only in silver, but the other three precious metals as well. Click to enlarge.
In platinum, 4 U.S. banks are net short 10,992 COMEX contracts in the September Bank Participation Report, which is down 2,976 contracts from the 13,968 COMEX contracts that 5 U.S. banks were short in the August BPR. This is still the smallest net short position that these U.S. banks have held since July 2020 -- and before that, since mid-2018.
At the 'low' back in July of 2018, these U.S. banks were actually net long the platinum market by 2,573 contracts. So they have a very long way to go to get back to just market neutral in platinum...if they ever intend to, that is.
Also in platinum, 14 non-U.S. banks are net long 1,115 COMEX contracts in the September BPR, which is up 518 contracts from the 597 contracts that 16 non-U.S. banks were net long in the August BPR.
So from a U.S./non-U.S. bullion bank perspective, this is a bifurcated market.
[Note: Back at the July 2018 low, these same non-U.S. banks were net short 1,192 COMEX contracts in platinum.]
And as of September's Bank Participation Report, 18 banks [both U.S. and foreign] are net short 12.6 percent of platinum's total open interest in the COMEX futures market, which is down a decent amount from the 19.2 percent that 21 banks were net short in August's BPR.
But it's the U.S. banks in this bifurcated market that are on the short hook big time -- and the real price managers. They have little chance of delivering into their short positions, although a very large number of platinum contracts have already been delivered during the last couple of years. But that fact, like in both silver and gold, has made no difference whatsoever to their paper short positions. The situation for them [the U.S. banks] in this precious metal is as almost as equally dire in the COMEX futures market as it is with the other two precious metals...silver and gold...particularly the former.
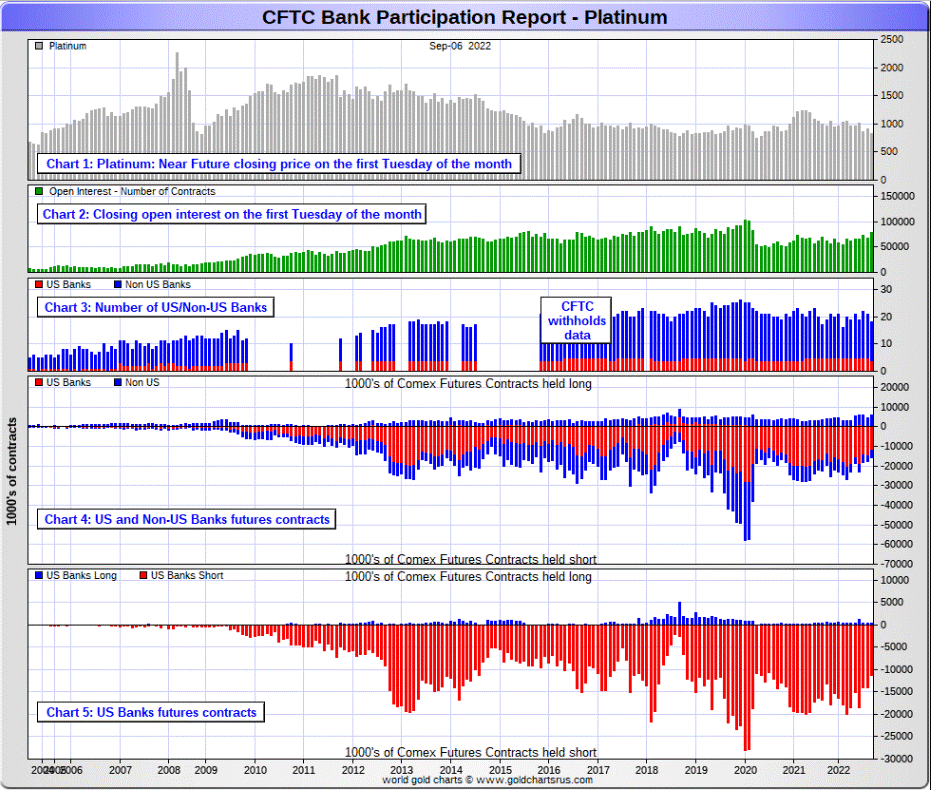
Here's the Bank Participation Report chart for platinum. Click to enlarge.
In palladium, 4 U.S. banks are net long 577 COMEX contracts, down 314 contracts from the 891 COMEX contracts that 5 U.S. banks were net long in August's BPR.
Also in palladium, 8 non-U.S. banks are net long 168 COMEX contracts in the September BPR, up 76 contracts from the 92 contracts that 8 non-U.S. banks were net long in August.
Except in February's Bank Participation Report, these non-U.S. banks have been net long palladium for more than two years now -- and the U.S. banks since December of last year.
And as I've been commenting on for almost forever, the COMEX futures market in palladium is a market in name only, because it's so illiquid and thinly-traded. Its total open interest in yesterday's COT Report was only 6,065 contracts...compared to 78,610 contracts of total open interest in platinum... 138,300 contracts in silver -- and 465,908 COMEX contracts in gold.
The only reason that there's a futures market at all in palladium, is so that the Big 8 commercial traders can control its price. That's all there is, there ain't no more.
As of this Bank Participation Report, 12 banks [both U.S. and foreign] are net long 12.2 percent of the entire COMEX open interest in palladium...compared to the 14.1 percent of total open interest that 14 banks were net long in August's BPR.
And because of the small numbers of contracts involved, along with a tiny open interest, these numbers are pretty much meaningless.
But, having said that, for the last almost three years in a row now, the world's banks have not been involved in the palladium market in a material way. And with them now net long, it's all hedge funds and commodity trading houses that are left on the short side.
Here’s the palladium BPR chart. Although the world's banks are now net long at the moment, it remains to be seen if they return as big short sellers again at some point like they've done in the past. Click to enlarge.
Excluding palladium for obvious reasons -- and platinum in the non U.S. bank category...only a small handful of the world's banks, most likely four or so in total -- and mostly U.S-based, except for HSBC, Barclays and maybe Standard Chartered...continue to have meaningful short positions in the precious metals. It's a near certainty that they run this price management scheme from within their own in-house/proprietary trading desks...although it's a given that some of their their clients are short these metals as well.
The futures positions in silver and gold that JPMorgan holds are immaterial -- and have been since March of 2020...according to Ted Butler. And what net positions they might hold, would certainly be on the long side of the market. It's the new 7+1 shorts et al. that are on the hook in everything precious metals-related.
And as has been the case for years now, the short positions held by the Big 4/8 traders/banks, is the only thing that matters...especially the short positions of the Big 4 -- and how this is ultimately resolved [as Ted said earlier] will be the sole determinant of precious metal prices going forward.
The Big 8 shorts, along with Ted's raptors...the small commercial traders other than the Big 8 commercial shorts...continue to have an iron grip on their respective prices. The Big 4/8 shorts have engineered prices lower in order to cover as many of their short positions as possible -- and they've been most successful at it.
That 'iron grip' will persist until they either voluntarily give it up...or are told to step aside, as it now appears that there's no chance that they will ever get overrun. If that possibility had ever existed in reality, it would have happened already. However, considering the current state of affairs in the world today -- and the physical shortage in silver, I suppose one shouldn't rule it out entirely.
I have a lot of stories, articles and videos for you today...including a few articles that I've been saving for today's column for length and/or content reasons. And quite a few of them are very much on the longish side.
![]()
CRITICAL READS
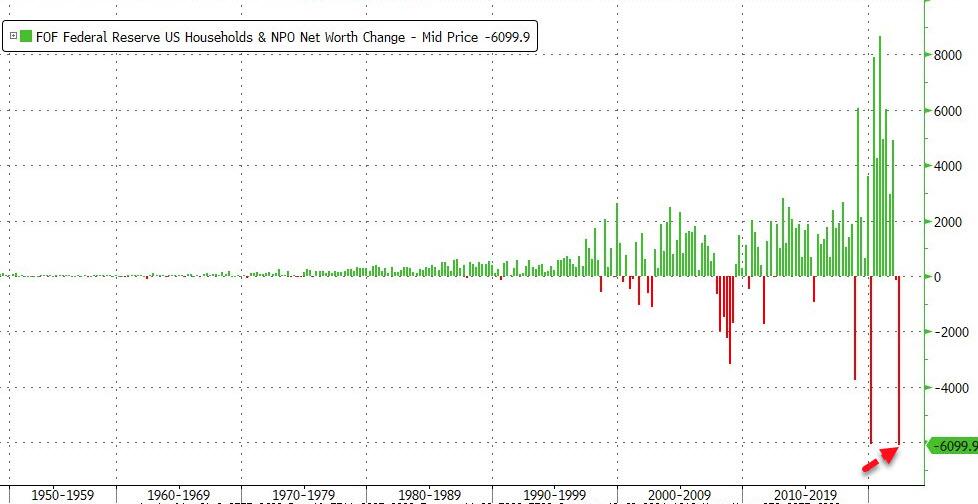
U.S. Household Net Worth Crashed By Most Ever in Q2
Globally, debt and equity capital markets lost around $23 trillion of 'wealth' in Q2 as Putin's invasion sent commodity prices higher, slammed stocks on recession fears, and central banks around the world engaged in policy-tightening to battle the inflationary monster at their doors.
In the U.S., The Fed's Flow of Funds data issued today shows that U.S. Households lost a shocking $6.1 trillion in Q2 - the largest quarterly loss ever (bigger than the aggregate loss reported in Q1 2020 during the peak of COVID lock-down policies around the world)...Click to enlarge.
We do caveat that drop with the words we shared for Q1:
"This number is garbage and only makes sense if households were allowed to mark their own stock prices... the real net worth drop could be multiples of this..."
This is the second consecutive quarterly drop in net worth (after falling about $147 billion in the first quarter), dragging the total down to $143.8 trillion... as The Fed balance sheet begins to rollover...
And this is all happening against a background of the "strongest economy ever..."
This 3-chart Zero Hedge article showed up on their Internet site at 12:30 p.m. EDT on Friday -- and I thank Brad Robertson for sharing it with us. Another link to it is here. Gregory Mannarino's almost always "ADULT" rated post market close rant yesterday is linked here.
![]()
Valuable Insight from the Q2 2022 Z.1 -- Doug Noland
Reuters headline: “U.S. Household Wealth Suffers Record Drop in Second Quarter.” Bloomberg: “U.S. Household Net Worth Falls Most on Record on Slump in Stocks.” Yes, Household Net Worth dropped $6.1 TN during Q2, the largest decline since Q1 2020. However, the hit to the Household Balance Sheet was not the most newsworthy facet of an intriguing Fed Q2 2022 Z.1 “flow of funds” report.
I had been anxiously waiting for new Credit data. The second quarter was miserable for the securities markets. There was the sharp drop in perceived wealth, along with a meaningful tightening of market financial conditions. Understandably, focus for many analysts had turned to economic recession. Meanwhile, the quarter was notable for an extraordinary surge in price pressures. How would these countervailing forces impact lending and Credit growth more generally? The Z.1 provides Valuable Insight.
The bottom line: despite pockets of weakness in securities finance, a historic system Credit inflation runs unabated. On a seasonally-adjusted and annualized basis (SAAR), Non-Financial Debt expanded at a $4.316 TN pace during Q2. This was more than double the $1.846 TN annual average for the decade 2010 to 2019, while almost 50% ahead of 2004’s cycle peak $2.899 TN - that was not exceeded until 2020’s insane $6.796 TN Credit splurge.
There are powerful inflationary biases percolating throughout the economy - unlike anything experienced in decades. Importantly, securities markets no longer completely dominate and dictate system financial conditions. Lending and bank Credit have become powerful drivers of Credit growth, along with ongoing deficit spending and the expansionary GSEs.
While it’s mum’s the word when it comes to Credit growth, Fed officials undoubtedly know the numbers. They must also know that inflation will not be moving back to their 2% target until they orchestrate a marked Credit slowdown (with myriad negative consequences). They’ve been forced to abandon the notion that tinkering with market financial conditions would do the trick. Now, it’s press ahead with a major tightening cycle until something works. And between the Z.1 and recent speculative market dynamics, there is certainly no reason to backtrack from the “they’ll hike until something breaks” thesis.
This week's commentary from Doug is a number-cruncher's heaven -- and don't be surprised if you get a little lost. But as he points out..."an historic system credit inflation runs unabated." That's all you really need to know -- and should come as no surprise, either. Another link to it is here.
![]()
Will the earnest Planet Savers plunge the world into darkness once again?
Europe is in a tight spot. It put itself there.
It shut down its economy in the Covid Panic. It kept its interest rates way too low, for way too long. It aims to rid itself of fossil fuel, upon which its economy and its living standards depend. And now, in its misbegotten proxy war with Russia, it faces General Winter – Russia’s traditional ally.
We are here in Paris… enjoying a short holiday… and just finishing a $110 breakfast.
Consumer prices are almost all, to some measure, dependent on energy. And Europe’s most important source of energy is Russia. Now that the Russians have cut off, indefinitely, gas coming from the Nord Stream 1 pipeline, prices are on the rise. Consumer prices in England, for example, are expected to rise over 20%. Here’s Bloomberg:
"Soaring energy bills are threatening to put six in 10 British manufacturers out of business, according to a survey that lays bare the extent of the crisis facing the next prime minister.
“The current crisis is leaving businesses facing a stark choice,” the report said. “Cut production or shut up shop altogether if help does not come soon.”
And this from The Sun:
SEVEN in ten pubs could shut for good this winter because of rising energy costs, a survey reveals.
"Thousands of landlords already rocked by repeated lock-downs are teetering on the brink following a doubling in gas and electricity prices."
This interesting commentary from Bill was posted on his website on Friday morning EDT -- and another link to it is here.
![]()
Europe Fails to Agree on Russian Gas-Price-Caps Faced With "Hard-Core Physical Reality"
An emergency meeting of E.U. energy ministers on Friday meant to reassure both energy companies and the European public regarding soaring prices and severely strained supply amid Russian countermeasures in response to Western sanctions is off to shaky and fractured start. Rather than reassure anyone of anything, it's already clear the issue of a proposed cap on gas prices has only divided the bloc further, akin to the same prior question with oil.
Leading the way in pointing out the flawed logic of the plan, Hungarian Foreign Minister Peter Szijjarto pointed out the blow-back would be worse than the sting aimed at Russia. "If price restrictions were to be imposed exclusively on Russian gas, that would evidently lead to an immediate cut-off in Russian gas supplies. It does not take a Nobel Prize to recognize that," he said.
Echoing prior words of Hungarian leader Viktor Orbán, he said "The plan that would impose a price cap exclusively on Russian gas coming via pipelines is entirely against European and Hungarian interests."
Jozef Síkela, the Czech energy minister chairing the meeting, went into it echoing a martial tone with talk of engaging in "energy war" which is unlikely to match any corresponding action (there won't be any): "We are in an energy war with Russia. Putin is trying, by manipulating the market, to break the social peace in our countries, affect our way of life and attack our economies."
Síkela said ministers were hoping to send "a clear message that will calm down the markets" by day's end. This as over the course of the six-month Ukraine war Russian gas supplies to the collective E.U. have been cut by a stark 80% amid ominous reminders that "winter is coming".
And yet, with Italy, Poland, Hungary and Greece standing out as among the most vocal opponents of such a cap among at least 10 E.U. countries who have voiced their reservations, FT notes that some governments are "warning that singling out Russia could push President Vladimir Putin to cut supplies to Europe completely."
This interesting and worthwhile story appeared on the Zero Hedge website at 9:50 a.m. on Friday morning EDT -- and it comes to us courtesy of Brad Robertson. Another link to it is here.
![]()
Europe’s Energy Armageddon from Berlin and Brussels, Not Moscow -- F. William Engdahl
[NOTE: I posted his article in my Friday column, but though it of such importance that I'm sticking it today's column as well, in case you didn't have time for it yesterday. -- Ed]
On August 22 the exchange-traded market price for natural gas in the German THE (Trading Hub Europe) gas hub was trading more than 1000% higher than a year ago. Most citizens are told by the Scholz regime that the reason is Putin and Russia’s war in Ukraine. The truth is quite otherwise. E.U. politicians and major financial interests are using Russia to cover what is a Made in Germany and Brussels energy crisis. The consequences are not accidental.
It is not because politicians like Scholz or German Green Economy Minister Robert Habeck, nor E.U. Commission Green Energy Vice President Frans Timmermans are stupid or clueless. Corrupt and dishonest, maybe yes. They know exactly what they are doing. They are reading a script. It is all part of the E.U. plan to deindustrialize one of the most energy-efficient industrial concentrations on the planet. This is the U.N. Green Agenda 2030 otherwise known as Klaus Schwab’s Great Reset.
E.U. Gas Market Deregulated
What the E.U. Commission and government ministers in Germany and across the E.U. are carefully hiding is the transformation they have created in how the natural gas price is determined today. For almost two decades the E.U. Commission, backed by the mega banks such as JPMorgan Chase or large speculative hedge funds, began to lay the basis for what is today a complete deregulation of the market for natural gas. It was promoted as the “liberalization” of the European Union’s natural gas market. What it now allows is for unregulated real-time free market trading to fix prices rather than long-term contracts.
Beginning around 2010 the E.U. began to push a radical change in rules for pricing natural gas. Prior to that point most gas prices were set in fixed long-term contracts for pipeline delivery. The largest supplier, Russia’s Gazprom, provided gas to the E.U., most especially to Germany, in long-term contracts pegged to the price of oil. Until the last several years almost no gas was imported by LNG ships. With a change in U.S. laws to allow export of LNG from the huge shale gas production in 2016 U.S. gas producers began a major expansion of LNG export terminal construction. The terminals take an average of 3 to 5 years to build. At the same time Poland, Holland and other E.U. countries began to build LNG import terminals to receive the LNG from abroad.
Emerging from World War II as the world leading oil supplier, the Anglo-American oil giants, then called the Seven Sisters, created a global oil price monopoly. As Henry Kissinger noted during the oil shocks of the 1970s, “Control the oil and you control entire nations.” Since the 1980s Wall Street banks, led by Goldman Sachs, created a new market in “paper oil,” or futures and derivative trading of future oil barrels. It created a huge casino of speculative profits that was controlled by a handful of giant banks in New York and the City of London.
Well, dear reader, this scenario certainly sounds familiar -- and is still ongoing to this day in the Big 6 commodities, plus others I'm sure. This commentary from William was posted on the globalresearch.ca Internet site back on September 1 -- and is definitely worth your while. I thank reader George Neis for pointing it out -- and another link to it is here.
![]()
China’s BRI Shapes a Multipolar Future for Saudi Arabia
Xi Jinping’s visit to Saudi Arabia is heralding more tectonic changes in the rules of the Great Game in ways that few have begun to realize.
While many people are quick to criticize China for having looked the other way while the atrocious Saudi-led offensive in Yemen has continued to kill hundreds of thousands of civilians since 2015, these same people miss the fact that a higher geopolitical reality is being born which will have a much greater benefit to both the people of Yemen and humanity more generally if it is not sabotaged.
Just to be clear: Saudi Arabia has a lot of blood on her hands.
However, the monarchy is also not merely the unidimensional player which many often assume whose goal is to simply bask forever in oil profits while spreading wahhabite radicalism across the Arab world while subduing any nation who stands in their way.
There is also an emergent robust young generation in Saudi Arabia (half of the 31 million Saudis are under 25) and a renewed embrace of advanced technological progress as a driver for a post-hydrocarbon age. This more healthy dynamic within the Saudi population and governing class was outlined clearly in the Saudi Vision 2030 program of April 2016 and earlier the January 2016 Joint Statement between the People’s Republic of China and the Kingdom of Saudi Arabia which read: “In the process of jointly pursuing the Silk Road Economic Belt and the 21st Century Maritime Silk Road initiative, China is willing to coordinate development strategies with Arab states, put into play each other’s advantages and potentials, promote international production capacity cooperation and enhance cooperation in the fields of infrastructure construction, trade and investment facilitation, nuclear power, space satellite, new energy, agriculture and finance, so as to achieve common progress and development and benefit our two peoples.”
This positive orientation can be seen by an array of common sense transformations of the Saudi foreign policy priorities over recent years made possible by the smooth diplomacy of both China and Russia who are leading in the creation of a new viable security/financial architecture far outside of the control of western unipolarists. Among the chief of these new priorities is a focus on vectoring east towards a pro-China policy, and improving diplomatic relations with historic enemies within the region.
This very worthwhile essay put in an appearance on the strategic-culture.org Internet site back on September 1 -- and I thank Roy Stephens for sending it our way earlier this week. It obviously had to wait for Saturday's column -- and another link to it is here.
![]()
War and Industrial Policy -- Zoltan Pozsar
War means industry.
Wars cannot be fought with supply chains that crisscross a globalized world,
where production happens on faraway, little islands in the South China Sea,
from where chips can be transported only if air spaces and straits remain open…
Global supply chains work only in peacetime, but not when the world is at war,
be it a hot war or an economic war. The low inflation world had three pillars:
cheap immigrant labor keeping nominal wage growth “stagnant” in the U.S.,
cheap Chinese goods raising real wages amid stagnant nominal wages, and
cheap Russian natural gas fueling German industry and Europe more broadly.
Implicit in this “trinity” were two giant geo-strategic and geo-economic blocks:
Niall Ferguson called the first one “Chimerica”. I will call the other one “Eurussia”.
Both unions were a “heavenly match”: the E.U. paid euros for cheap Russian gas, the U.S. paid U.S. dollars for cheap Chinese imports, and Russia and China dutifully recycled their earnings into G7 claims. All sides were entangled
commercially as well as financially, and as the old wisdom goes, if we trade,
everyone benefits and so we won’t fight. But like in any marriage, that’s true only if there is harmony. Harmony is built on trust, and occasional disagreements can only be resolved peacefully provided there is trust. But when trust is gone, everything is gone, which is the scary conclusion from Dale Copeland’s book:
Economic Interdependence and War
Reviewing 200 years of history, including the Napoleonic and Crimean wars,
the book explains that “when great powers have positive expectations of the
future trade environment, they want to remain at peace in order to secure the
economic benefits that enhance long-term economic power. When, however,
these expectations turn negative, leaders are likely to fear a loss of access to
raw materials and markets, giving them an incentive to initiate crises to protect their commercial interests”. This “theory of trade expectations” holds lessons for understanding not only today’s conflict between the U.S. on the one hand, and Russia and China on the other, but also the outlook for inflation. Put simply……if there is trust, trade works. If trust is gone, it doesn’t. Today, trust is gone:
Chimerica does not work anymore and Eurussia does not work either. Instead,
we have a special relationship between Russia and China, the core economies
of the BRICS block and the “king” and the “queen” on the Eurasian chessboard
– a new “heavenly match”, forged from the divorce of Chimerica and Eurussia.
This very long essay from Zoltan caused a sensation when it first published back on 24 August. It's been hidden behind various and sundry paywalls since...but here it is in the clear thanks to New Zealand reader Jon Wallace. It's posted on the credit-suisse.com Internet site -- and another link to it is here. Pack a lunch!
![]()
An Asian Bretton Woods may be on the way -- Alasdair Macleod
The financial war between Russia with China’s tacit backing on one side, and America and her NATO allies on the other has escalated rapidly. It appears that President Putin was thinking several steps ahead when he launched Russia’s attack on Ukraine.
We have seen sanctions fail. We have seen Russia achieve record export surpluses. We have seen the rouble become the strongest currency on the foreign exchanges.
We are seeing the west enter a new round of European monetary inflation to pay everyone’s energy bills. The euro, yen, and sterling are already collapsing — the dollar will be next. From Putin’s point of view, so far, so good.
Russia has progressed her power over Asian nations, including populous India and Iran. She has persuaded Middle Eastern oil and gas producers that their future lies with Asian markets, and not Europe. She is subsidising Asia’s industrial revolution with discounted energy. Thanks to the west’s sanctions, Russia is on its way to confirming Halford Mackinder’s predictions made over a century ago, that Russia is the true geopolitical centre of the world.
There is one piece in Putin’s jigsaw yet to be put in place: a new currency system to protect Russia and her allies from an approaching western monetary crisis. This article argues that under cover of the west’s geopolitical ineptitude, Putin is now assembling a new gold-backed multi-currency system by combining plans for a new Asian trade currency with his new Moscow World Standard for gold.
This short novel from Alasdair, which I haven't had time to read yet, was posted on the goldmoney.com Internet site on Wednesday -- and for obvious reasons, had to wait for today's column. I found it embedded in a GATA dispatch -- and another link to it is here.
![]()
U.S. step up Russian aluminium, nickel imports since Ukraine war
The European Union and United States have ramped up buying key industrial metals from Russia, data showed, despite logistical problems spurred by the war in Ukraine and tough talk about starving Moscow of foreign exchange revenue.
The metal shipments highlight the West's difficulty in pressuring Russia's economy, which has performed better than expected and seen its rouble currency surge as buoyant oil revenue has helped offset the impact of sanctions.
E.U. and U.S. imports of Russia's main base metal products aluminium and nickel during March-June increased by as much as 70%, official trade data compiled by Reuters from the United Nations Comtrade database show.
The total value of E.U. and U.S. imports of the two metals from March to June were $1.98 billion, the data showed.
The West has imposed repeated waves of sanctions on a wide range of Russian products, people and institutions, but has largely spared the industrial metals sector.
This Reuters story, filed from London, appeared on their website on Wednesday -- and I thank reader 'Robert in Denver' for pointing it out. Another link to it is here.
![]()
Top Rice-Exporter India Curbs Shipments, Adds to Fresh Food Inflation Fears
We told readers in April that the next challenge for the global food supply could be a plunge in rice production. Then in early August, severe heatwaves in India, the world's biggest rice shipper, wreaked havoc across farmland in the country, depressing crop output. Today, India restricted some rice exports and placed levies on others, exacerbating a world already squeezed by a food crisis.
Bloomberg reported India imposed a 20% duty on white and brown rice exports and banned shipments of broke rice -- parboiled and basmati rice were excluded from the export duty and/or trade restrictions. The new curbs apply to about 60% of India's rice exports and go into effect Friday.
India's clamp down on grain exports is to calm domestic prices after low rainfall during the monsoon season curtailed planting. The country accounts for 40% of global rice shipments and could spark yet another wave of food inflation for the poorest nations importing the grain.
"Such severe disruptions in global supplies, combined with a record level of consumption worldwide, should supercharge" prices and further fuel food inflation, said Sabrin Chowdhury, head of commodities at Fitch Solutions.
This Zero Hedge article showed up on their Internet site at 7:20 p.m. on Friday evening -- and another link to it is here.
![]()
The Energy Transition Could Be Derailed By a Looming Copper Shortage
“Think of copper as a common carrier, so to speak, of decarbonization. It is literally the wiring that connects the present to the future,” writes Nathaniel Bullard, BloombergNEF's Chief Content Officer. While many of us imagine renewable energies to be just that – infinitely renewable, with no use of finite resources – the reality is that solar planes, wind turbines, energy transmission infrastructure, batteries for energy storage, and motors for your electric cars and electric bicycles all rely on metals that are not infinitely sourceable. Much lip service has been paid to the extraction and exploitation of lithium to power electric vehicle batteries, but one could argue that copper is even more central to – and therefore potentially threatened by – a large-scale green energy transition.
The reverse is also true – a looming copper shortage threatens to completely derail the clean energy transition, and by extension, climate pledges across the world. According to a recent report from S&P Platts, if copper shortfalls follow projected trends, climate goals will be “short-circuited and remain out of reach.”
Copper is particularly effective in a wide range of low-carbon alternatives because of its relatively high electrical conductivity and low reactivity. It’s not that traditional energy production and transmission and gas-powered vehicles don’t use copper in their manufacturing – it’s just that renewables and electric vehicles require a whole lot more of it.
“An EV requires 2.5 times as much copper as an internal combustion engine vehicle,” reports CNBC. “Meanwhile, solar and offshore wind need two times and five times, respectively, more copper per megawatt of installed capacity than power generated using natural gas or coal.”
Copper production is already struggling to keep up with booming demand, and S&P projects that current levels of demand will nearly double by the year 2035, climbing to a whopping 50 million metric tons. That figure will climb to more than 53 million metric tons by 2050, which amounts to “more than all the copper consumed in the world between 1900 and 2021.”
BloombergNEF’s projections are a bit more conservative, but still striking, finding that copper demand will increase by over 50% by 2040. Worryingly, the same report projects that primary copper production can increase by just 16% in the same time period.
If the above is all true, then why oh why is copper sitting at the price it is, dear reader??? You know the answer already. This article appeared on the oilprice.com Internet site on Wednesday -- and was picked up by Zero Hedge at 6:30 a.m. EDT on Friday morning. I thank Brad Robertson for this story as well. Another link to it is here.
![]()
With Accession of King Charles III, Look of British Currency Set to Change
The face of King Charles III instead of that of Queen Elizabeth II will begin to be seen on new British coins and banknotes issued in the United Kingdom and Commonwealth countries beyond the British Isles. These include Canada, Australia, New Zealand, British territories in the Caribbean, Gibraltar, the Falkland Islands, and the English Channel islands of Jersey, Guernsey, and the Isle of Man.
Exactly when Britons will notice these changes is not immediately clear, and existing currency with a rendition of Queen Elizabeth will remain in circulation as legal tender, but the Bank of England will likely not wait long to begin effecting the change. There are 4 1/2 billion pound notes in circulation, adding up to about $93 billion. These will have to be replaced, a process likely to be carried out over several years.
During the short reign of King Edward VIII, new coins with his likeness were struck but the monarch abdicated the throne before they could be put into circulation.
New Royal Mail postage stamps will also bear the king's image or profile, but according to British media reports the cypher of Queen Elizabeth, ER, that now adorns Royal Mail post boxes will remain. The Guardian reported that some post boxes still bear the cypher GR, that of King George VI, who preceded Elizabeth II on the throne.
The ER cypher also appears on police helmets. Those may start to be modified in consideration of the new monarch. The royal cypher EIIR that is emblazoned on flags that fly on official buildings and sometimes on vessels of the Royal Navy is likely to change.
The rest of this news item is hidden behind the paywall over at the nysun.com Internet site -- and I found it on the gata.org website. Another link to it is here.
![]()
Turkish central bank’s gold reserves at 2-year high
The CBRT has purchased 75 tons of net gold in the first seven months of the year and increased official gold reserves by 12 tons in July, the World Gold Council data showed.
This was broadly in line with the monthly average so far this year and takes year-to-date net gold purchases to 75 tons, the data showed.
CBRT’s total official gold reserves now stand at 469 tons, a two-year high.
Global net gold reserves, meanwhile, increased by 37 tons in July. The increase was 64 tons in June.
The central bank that made the most net purchases in July was the Central Bank of Qatar, with 15 tons. Qatar was followed by India with 13 tons, Türkiye with 12 tons and Uzbekistan with 9 tons of net purchases. The biggest net sales in the month in question came from Kazakhstan with 11 tons.
Although the CBRT lagged behind Qatar and India in July, it maintained its position as the central bank that purchased the most gold in 2022.
This gold-related news item put in an appearance on the dailysabah.com Internet site on Thursday afternoon Turkey Time -- and I found it on Sharps Pixley. Another link to it is here.
![]()
The Photos and the Funnies
Here's the last photo taken as we exited the canyon on October 2. The sun had just come out from behind the clouds -- and there was enough to really light up the rocks on either side of the creek and the road. A couple of kilometers further down the road, I took another side road heading west that I'd scouted on Google Earth the day before. Photo two was looking east down the Similkameen River Valley towards the village of Keremeos -- and our ultimate destination...Osoyoos. I'd wished that I'd arrive at that spot about twenty minutes sooner so that the foreground wouldn't have been in such deep shadow. Photo three was taken back on pavement...the track bed of the long defunct Great Northern Railway -- and the gussied-up bridge in the foreground is an old railway bridge across a creek...c.1906. Photo four was taken looking at the outskirts Keremeos...a small village strung out along B.C. Highway 3. Click to enlarge.


![]()
The WRAP
"Understand this. Things are now in motion that cannot be undone." -- Gandalf the White
![]()
Today's pop 'blast from the past' is one I've posted before, but it's been a while, so I don't feel too guilty about posting again. It was released in 1967 by the just newly-named Los Angeles-based psychedelic rock band, Strawberry Alarm Clock -- and its history is interesting. It was originally the 'B' side of the 45 rpm, but was switched to the 'A' side on its second release months later -- and the rest, as they say, is history, as it hit No. 1 on Billboard in November of that year. The link is here -- and the bass cover is linked here.
Today's classical 'blast from the past' is virtuoso violin work by French composer Camille Saint-Saëns. It's his Introduction and Rondo Capriccioso, Op. 28...which he composed in 1863 -- and dedicated to Spanish virtuoso violinist Pablo de Sarasate.
It was originally intended to be the rousing finale to Saint-Saëns' first violin concerto, Op. 20, though its success as a solo composition at its first performance by Sarasate himself, led Saint-Saëns to publish it separately.
Here's violinist Ray Chen and the Malta Philharmonic Orchestra performing the work at the Svetlanov Hall in Moscow. Maestro Sergey Smbatyan conducts -- and the link is here.
![]()
With the exception of platinum in its spot month, the other three precious metals were allowed to close up on the day, but certainly off their highs by a bit -- and it was plain to see that the power-that-be weren't going to allowed any of them to run away to the upside. This was most obvious in GLOBEX trading in London...particularly in gold.
Volumes in any of them weren't overly heavy yesterday, so 'da boyz' had a relatively easy time of it -- and Ted was of the opinion that there was little sign of much Managed Money short covering yesterday...or since the Tuesday cut-off for next weeks Commitment of Traders Report.
Gold gained back most of its Thursday loses during the Friday trading session -- and silver's price was capped and turned lower before it could even get a sniff of $19 spot. As I pointed out at the top of today's column, which I'll repeat again here..."There's a premium of 17 cents per ounce in the spot month over September futures. This premium amount -- and higher, has existed for at least ten days now -- and is something that Ted has said that he's never seen before. But it just screams of tightness in the good delivery bar market."
Although platinum was closed down a few dollars in the spot market yesterday, it closed higher by $10.50 an ounce in its current front month, which is October. That rally closed platinum above its 50-day moving average by about four bucks -- and also represents the fifth day in a row that it has closed higher.
Palladium's higher close yesterday, the third big up-move in a row, has now taken it back above any moving average that matters.
Copper closed higher by 4 cent, but 6 cents off its intraday high, at $3.57/ pound. Friday was the second day in a row that it has closed above its 50-day moving average. You'd never know that there a looming physical shortage in this industrial metal from its current price action...as per this article in the Critical Reads section above -- and the same can be said about silver as well, except even more so.
Natural gas [chart included] didn't do much yesterday, closing higher by 8 cents at exactly $8.00/1,000 cubic feet. But WTIC had a big day...up $3.25/
3.89% -- and finishing the Friday session at $86.79/barrel. It has now gained back almost every penny of its big down day on Wednesday, but is still 8 bucks or so below its 50 and 200-day moving averages.
Here are the 6-month charts for the Big 6+1 commodities, thanks to stockcharts.com as always -- and yesterday's price action in all should be noted. Click to enlarge.
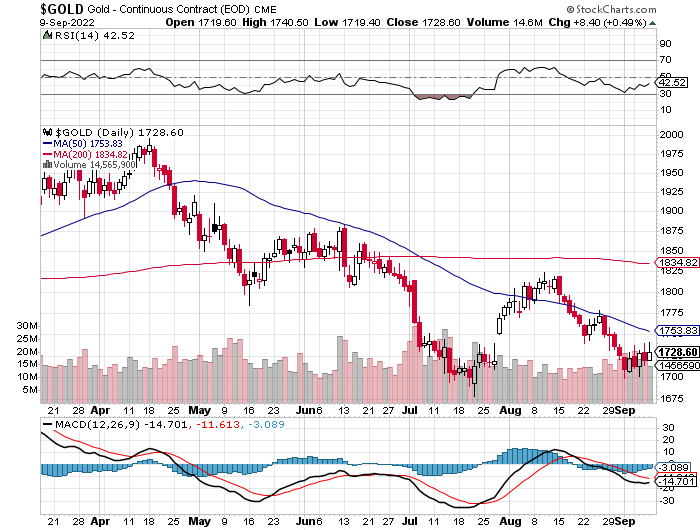
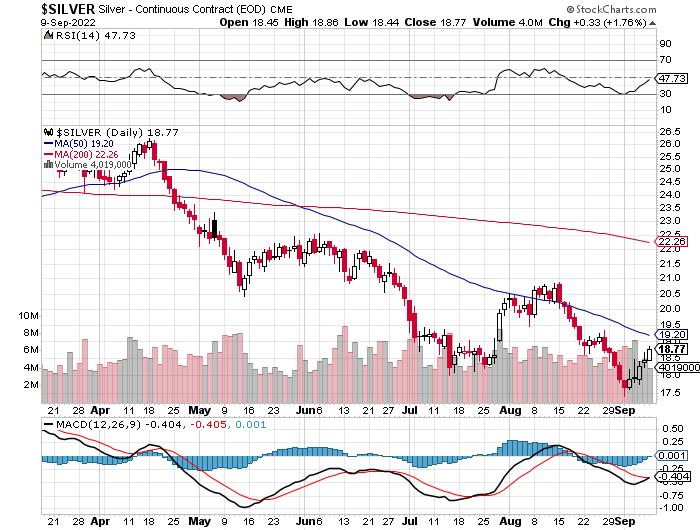
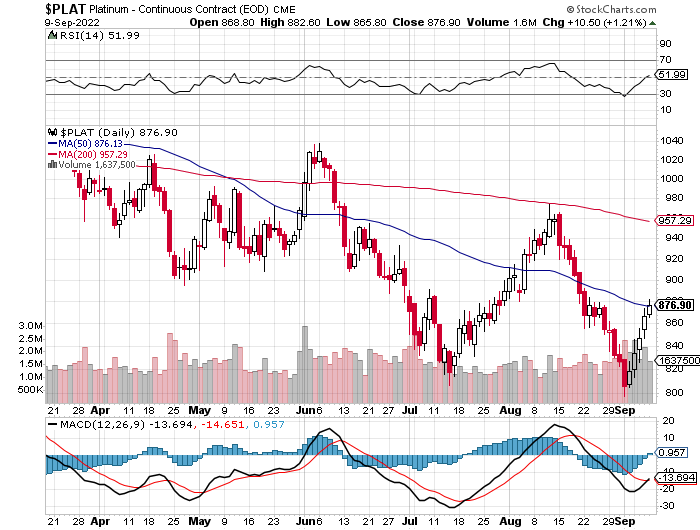
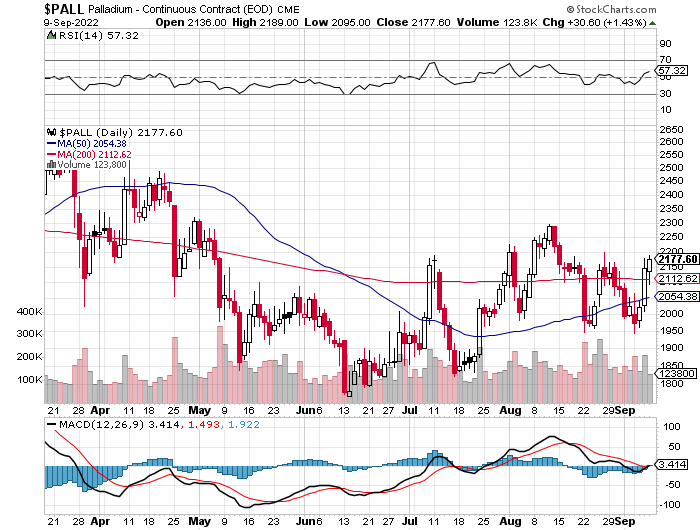
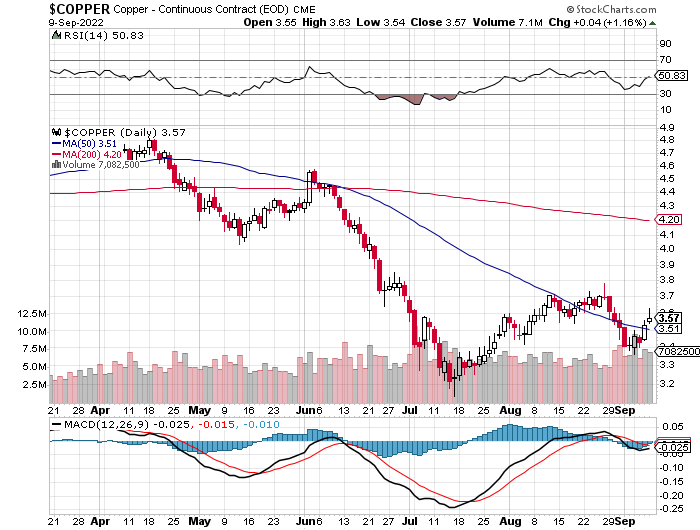
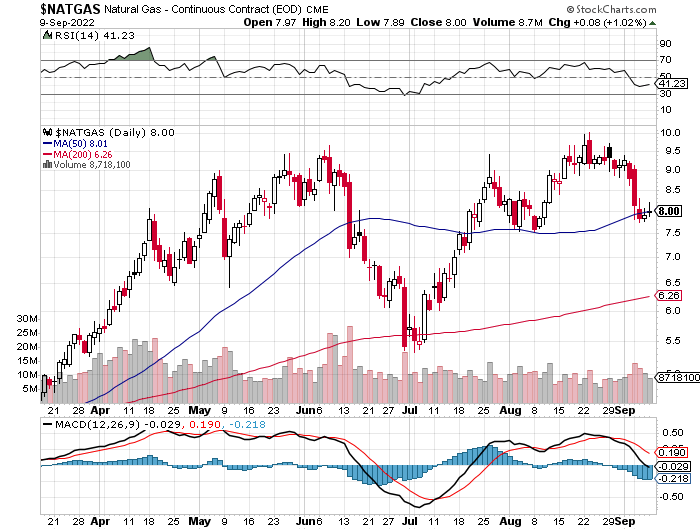
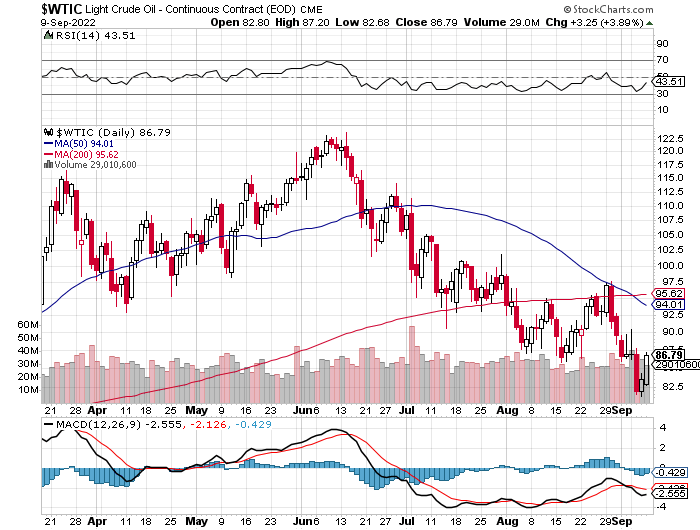
In last week's COT Report, Ted commented on the fact that the concentrated short position in silver held by the Big 4 and Big '5 through 8' commercial traders was the lowest ever.
But he could hardly contain himself on the phone yesterday afternoon when describing how much the short position of the Big 4 commercial traders had improved during the reporting week just past...from 24,000 COMEX contracts last week, to just 18,000 contracts this week.
And despite the fact that silver rallied in price during the last three days going into Tuesday's cut-off, the Managed Money traders were more than eager to go even deeper on the short side. You couldn't make this stuff up.
Yes, there was improvement in gold as well, but it was only a small fraction of the improvement in silver -- even though the Managed Money traders are now net short gold in the COMEX futures market once again.
It's a real stretch of the imagination to think that these Big 4/8 shorts would consider going back on the short side after all their Herculean efforts to rid themselves of their gargantuan short positions since silver and gold's high ticks of March 8...when the nickel market blew up on the LME.
Outside of the COMEX future market the supply/demand fundamentals just scream of tightness in any direction one cares to look. This is particularly the case in the only market that matters...1,000 troy ounce good delivery bar.
It's visible in COMEX warehouse stocks, as their inventories continue to plummet -- and also visible in the large amount of silver being transferred from the Registered category and back into Eligible...a sure sign, as Ted said, that the owners of this silver have no intentions of selling any time soon.
Continuing on, we have a short position in SLV that would choke a horse, which obviously means that the authorized participants involved are unable to secure enough physical metal, so they've had to short the shares in lieu of. Or, on the other hand, don't want to purchase what little supply is available in the open market, as that would drive the silver price to the moon and the stars... putting them even deeper in the hole.
Then, as mentioned in my 'Days to Cover' discussion further up, there's this little matter of the 1 billion troy ounce short position that, according to Ted, JPMorgan & Friends have snookered Bank of America into.
As I said in an interview with Goldcore out of Dublin, Ireland on Wednesday, a market-clearing event in silver, if allowed by the powers-that-be, would drive the its price far into triple-digit territory in its final blow-off top...which is a number that Ted came up with some time ago -- and I'm in complete agreement.
The stage is set. The Managed Money traders are all in the trap -- and as far as I'm concerned it just a matter of when...not if. I'll also mentioned one more time that when this event does begin, it won't be happening in a news vacuum.
When that day of reckoning arrives, I'll slip into First Majestic Silver's #TRIPLEDIGITSILVER T-shirt that's hanging in my closet -- and enjoy the spectacle as it unfolds.
But, on the other hand -- and I'm speculating here, the day that this begins -- and the 50-year price management scheme in the precious metals is allowed to unwind, will also be the day that the deep state/new world order crowd begin their final move, as the melt-down in everything paper will be on in earnest.
So we should be careful of what we wish for, dear reader. However, commodities in general -- and gold and silver in particular, will be all that are left standing when the greatest 'Everything Bubble' the world has ever known, breaths it last.
And, for that reason, as you already know...I'm still "all in" -- and will remain so, to whatever end.
See you on Tuesday.
Ed
About the author

SUBSCRIBE: https://edsteergoldsilver.com/

Ed Steer’s Daily Analysis of the Gold and Silver Markets
After eight years of writing about the precious metals for Casey Research, the folks at Stansberry & Associates—who just recently purchased controlling interest in the company—decided that my ‘niche market’ column didn’t fit into their plans.
Since the time that Casey Research was kind enough to offer me a stand-alone column, it became their most highly-rated blog almost from the outset—and has remained that way up to this date...