It looks there may be trouble ahead for copper. This goes well beyond the falling copper price and annual surpluses.
According to the article, China’s True Demand For Copper Is Only Half as Much as You Think:
For years, traders on the mainland have used copper as collateral to finance trades in which they borrowed foreign currencies and invested the proceeds in higher-yielding assets denominated in renminbi. This carry trade with Chinese characteristics allowed them to net a tidy profit.
(As an aside, however, the devaluation of yuan in August prompted analysts to wonder whether this trade has reached its best-before date—something that would have implications for the future global demand for copper, if true. Meanwhile, there have been persistent rumors of regulators cracking down on such trades.)
This practice of warehousing copper to help engage in financial arbitrage “inflated demand, kept prices higher, and led miners to raise output,” according to Bloomberg Intelligence Analysts Kenneth Hoffman and Sean Gilmartin, who sought to identify the extent to which demand for copper has been buoyed by its use as collateral for such trades.
As the article states, Chinese investors have been buying copper to finance trades. Thus, they have been warehousing one heck of a lot of copper to finance these trades This has kept demand artificially higher, causing mining companies to add more copper production.
How much more copper do these Bloomberg analysts believe is being acquired in China over and above forecasted industrial demand? Let’s look at the chart below:
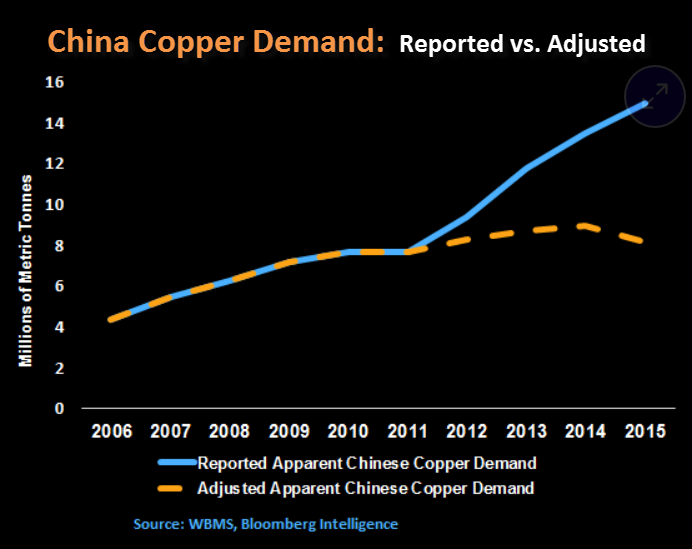
As we can see in the chart, reported and apparent Chinese copper demand were the same until 2011. Then in 2011, we see a disconnect. Reported Chinese copper consumption continues to increase significantly (in Blue), while apparent copper consumption (Yellow dashed line) rises moderately then falls in 2015.
The article above continues with the following:
The decline in Chinese copper demand for household appliances and electronics since 2011 doesn’t jibe with the headline demand statistics, the analysts note, which show the country’s total copper demand increased of 45 percent from 2011 to 2015.
Moreover, when benchmarked against cement—another material widely used for construction purposes—copper’s rapid rise in China looks particularly suspicious. While cement intensity, or percentage used per square meter, rose 11 percent in the time period, copper intensity surged an astounding 117 percent.
Putting all this together, Hoffman and Gilmartin conclude that “real Chinese demand may be 54 percent lower than anticipated” after stripping out the demand for copper tied to the carry trade.
What the Bloomberg analysts are saying here is that they believe real Chinese copper demand is 54 percent lower after stripping out demand for copper tied to carry trade finance. This is bad news for the copper industry and copper price. While the Chinese may continue buying copper for financial carry trades, this will end at some time…. probably sooner than later.
Lastly the article states this interesting factor:
That amounts to nearly 7 million metric tonnes of copper procured for use as collateral in 2015 alone, according to the pair’s calculations—equal to the mass of more than 30,000 Statues of Liberty.
So, according to these two analysts calculations, Chinese investors acquired nearly 7 million metric tons of copper as collateral in 2015 along…. enough to make 30,000 Statures of Liberty. This accounts for 35% of global copper mine supply in 2015.
What happens to all this accumulated copper (estimates are 15 million tonnes) when these finance carry trade deals go south?
Global Copper Surpluses Likely To Surge Going Forward
In 2015, the world experienced a 363,000 tonne surplus of copper. This data comes from the GFMS 2016 Copper Survey (Thomson Reuters). Some reporting agencies show a lower surplus, but I like to use the data by GFMS.
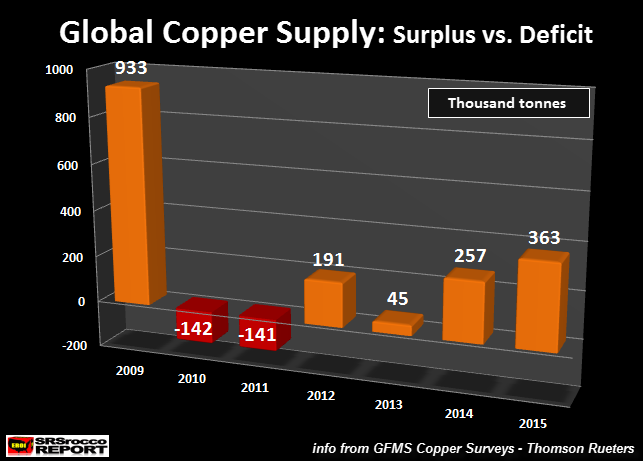
The one important part of the chart to take notice is the large surplus in 2009. This was due to falling demand from the global depression as well as increased supply. It then became a deficit in 2010 and 2011 as global economies recovered from massive Central Bank QE monetary expansion polices.
However, China’s real copper consumption began to disconnect in 2012 as Chinese investors bought and warehoused copper for collateral in finance carry trades. So, if we were to remove that demand from the equation, the surpluses from 2012 to 2015 would be much greater. Again, according to the two Bloomberg analysts , it was nearly 7 million tonnes more of Chinese copper demand than the industry needed.
If the world suffered a 933,000 tonne copper surplus in 2009 when the global markets and economies were tanking, what kind of surpluses will the world experience when the copper finance trades go south on top of slowing global industrial demand?
Again, this could have serious ramifications for the global copper market and price. So, why is this good for silver?
Falling Copper Supply Means Falling Silver Supply
This next graph comes from my THE SILVER CHART REPORT. It is chart #9 of 48 charts contained in the report. It shows the breakdown of global silver production in 2014:
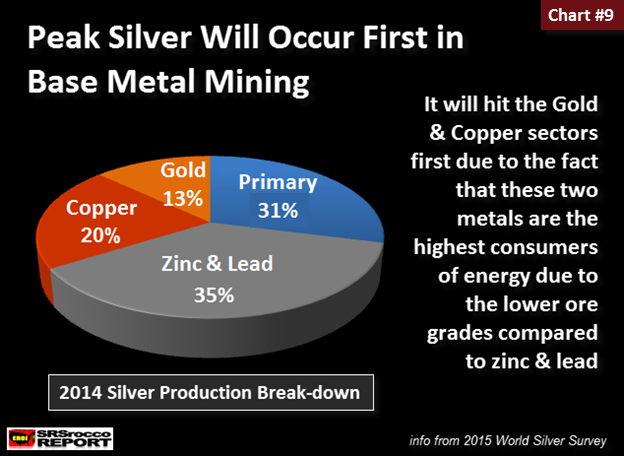
Global silver as a by-product of copper mining accounts for 20% of total world supply. As we can see, zinc and lead account for 35% of the total pie. Thus, falling world copper production will impact overall silver supply. Furthermore, as global economic activity continues to decline (shown by present deteriorating market indicators) more copper mines will shut down.
Then if we add the huge (estimated) 15 million tonnes of warehoused copper from Chinese financial carry trade activity, we could see a big drop of global copper mine supply.
So, why is this good for silver? As global base metal supply, especially copper, starts to decline, it will drastically impact global silver mine supply. Again, 55% of world silver mine supply comes from copper, zinc and lead production.
While many analysts believe falling supply and demand for base metals are also bad news for silver, I don’t agree. This is due to silver’s superior investment properties compared to the base metals. Moreover, as more stress comes down on the highly leveraged financial system, more investors will move into physical safe havens as gold and silver.
The value of silver in the future will be recognized more as a high quality store of value, rather than a commodity, based on cost of production and supply-demand forces. I wrote about this in my article, SILVER INVESTMENT: Switching From A Commodity To High Quality Store Of Value.
I believe the future forecasts of increased economic activity and growing production of energy, metals and commodities will be grossly overstated. Thus, it will be more important for investors to find assets to protect the wealth they have, rather they risk making gains in a falling market environment.
The precious metals will be some of the safest assets to own at this time.
—————————–
Please check back for new articles and updates at the SRSrocco Report. You can also follow us at Twitter below:
![]()
About the author


Independent researcher Steve St. Angelo (SRSrocco) started to invest in precious metals in 2002. Later on in 2008, he began researching areas of the gold and silver market that, curiously, the majority of the precious metal analyst community have left unexplored. These areas include how energy and the falling EROI – Energy Returned On Invested – stand to impact the mining industry, precious metals, paper assets, and the overall economy.
Steve considers studying the impacts of EROI one of the most important aspects of his energy research. For the past several years, he has written scholarly articles in some of the top precious metals and financial websites.
You can find many of Steve’s articles on noteworthy sites, such as GoldSeek-SilverSeek.com
WEBSITE: https://srsroccoreport.com/