The market doesn’t realize it yet, but the coming collapse of the global stock and bond markets will totally wipe out world silver supplies. Unfortunately, this will occur at the time when main stream investors finally understand the value of owning physical silver.
Global Financial turmoil and low silver prices motivated experienced precious metals investors to purchase record amounts of silver. However, the market is starting to see a huge inflow of new and first-time gold and silver buyers. According to Money Metal Exchange, they experienced a 365% increase in first-time buyers over the past 45 day period (June 16th-July 31st).
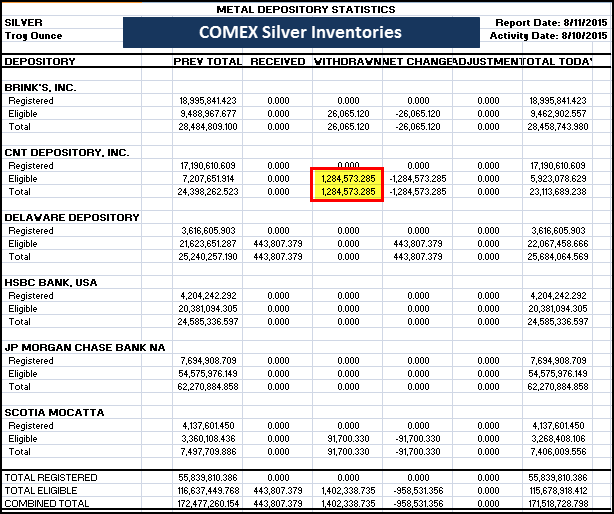
This recent surge in buying has put a huge dent in the retail physical silver market and is now impacting the wholesale market. The COMEX suffered another large 1 million oz (Moz) withdrawal from its warehouse inventories today:
The CNT Depository had 1.28 Moz of silver taken out of its Eligible category. When we add up the other small withdrawals and the 443,807 oz deposit, the net amount of silver removed from the COMEX was 958,531 oz. Almost another cool million ounces of silver removed in just one day.
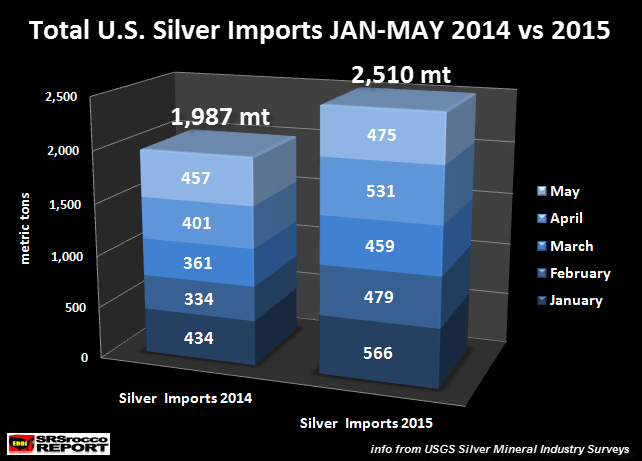
Then we had a new update on U.S. silver imports from the folks at the USGS. According to the data for May, the U.S. imported another 475 metric tons (mt) of silver. If we add up all U.S. silver imports JAN-MAY, it turns out to be a whopping 2,510 mt (81 million oz).
As we can see, total U.S. silver imports year to date (2,510 mt) are 523 mt greater than the same period last year (1,987 mt). Thus, silver imports are 26% higher than they were during the first five months of 2014 and are on track to reach 6,000 mt in 2015. This continues to be a surprise because the U.S. market demand for silver is probably less than it was last year.
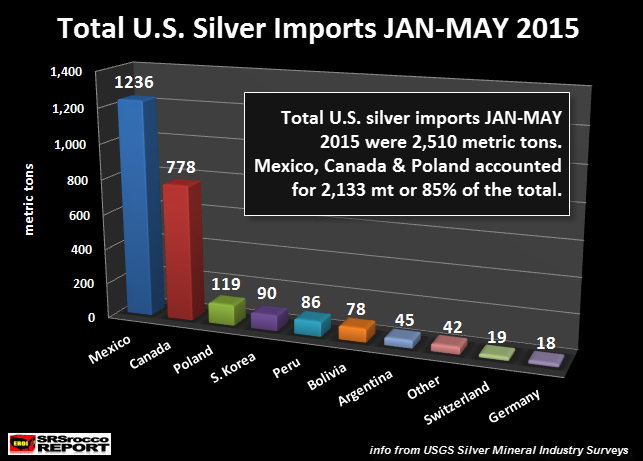
However, the Silver Institute recently published a news release stating that U.S. silver jewelry imports increased 11% in the first five months of 2015. Now, silver jewelry imports are not stated as either “silver bullion” or “silver Dore Bars” in the USGS import data. For example, the chart below shows which countries exported silver bullion and Dore’ bars to the United States:
Mexico, Canada and Poland accounted for 2,133 mt (85%) of the total 2,510 mt of silver imported by the U.S. Jan-May 2015. Also, these three countries are not major fabricators of silver jewelry as are Asia and India.
Furthermore, the U.S. only fabricated 397 mt of jewelry in 2014 (2015 World Silver Survey). Basically, the United States only manufactured 397 mt (12.7 Moz) of silver jewelry in 2014. Even though the U.S. may be importing more silver jewelry this year, it’s not apart of the silver bullion and Dore’ bar data.
So, where is all this silver going that the U.S. is importing at a near record pace this year?? I would imagine the majority of the silver is being acquired by large entities and wealthy individuals. I chat with some folks in the industry and they continue to tell me that 80+% of their precious metal sales are silver. And these aren’t just small Mom & Pop purchases… these are large 6 & 7 figure sales in silver.
Which is why we also see huge demand for Silver Eagles over Gold Eagles. Gold Eagles were very strong in July due to the possible Greek Exit of the European Union and its impact on the global financial markets. Gold Eagle sales jumped from 76,000 oz in June to 176,000 oz in July. However, sales of Gold Eagles are only 7,500 oz for the first 11 days of August.
Now compare that to Silver Eagle sales:
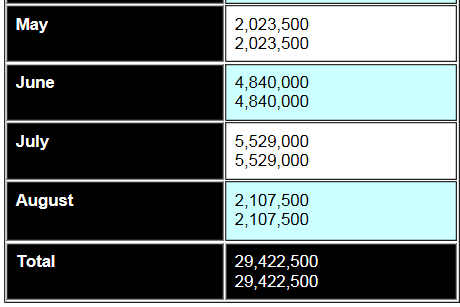
Silver Eagle sales in the first eleven days in August have already reached 2.1 Moz, surpassing the total for May of 2 Moz. Amazingly, investors have purchased 281 Silver Eagles for every Gold Eagle oz in August. Compare that to the 31/1 ratio in July:
July Silver Eagle sales = 5,529,000
July Gold Eagle sales = 176,000 oz
July Silver/Gold Eagle ratio = 31/1
August Silver/Gold Eagle ratio = 281/1
While many investors cut back on buying gold this month because they believe the global financial situation is now back under control by the wizards at the Fed and Central Bank, other savvy investors continue to purchase silver hand-over-fist. We must remember, this record silver buying is only by 1% of the market. The real question is…. What happens to global silver supply when the majority of the market wakes up?
Investors need to realize just how much silver the U.S. and India are importing. If you read my THE SILVER CHART REPORT, you would have seen this chart below. This is Chart #44 of a total of 48 charts explained in detail in the report:
This chart shows the annual silver imports for the U.S. and India. As you can see, U.S. silver imports (Blue) are more consistent compared to India (Tan), which are more volatile. This is due to India’s erratic annual silver bar purchases. Some years, India imports a great deal of silver bar, while other years demand falls considerably. However, 2013 and 2014 were banner years… and the best is yet to come in 2015.
According to ETF Securities July Metal Update, India has imported 61% more silver in the first six months of 2015 compared to the same period last year. India is on track to import 9,000 mt or 300 Moz of silver in 2015. If the U.S. imports 6,000 mt (193 Moz), these two countries will import a total of 493 Moz of silver in 2015. Not only will the U.S. and India import 105 Moz more silver this year than they did in 2014, these two countries are on pace to consume nearly 60% of global mine supply.
CONDITION RED: Investors Better Wake Up Before It’s Too Late
Even though we are seeing elevated buying of physical silver investment, I would imagine many individuals are just waiting to pull the trigger to make their purchases. They are either waiting for the perfect moment to purchase their silver at a lower cost, or they are trying to time the coming Market Crash.
I have to say… THIS IS A LOUSY STRATEGY. Of course, we can never know how the future unfolds, but evidence is mounting that the FAN is going to hit the SH*T sooner than later. If the retail silver market is already experiencing rationing of Silver Eagles and Maples as well as 2-4 week wait times on other silver bullion products, this will likely get worse in the future.
Many investors are holding off buying silver because they believe we could see lower silver prices for decades as we experienced from 1983-2003. While that notion is held by many investors, this time around will certainly be different. Why? Because the world will no longer enjoy a growing global oil supply as it did over the past three decades. Growing global oil production allowed the U.S. Fiat Dollar to remain the world’s reserve currency as it controlled the flow the world’s energy supply.
I still read where many websites repeat the infamous saying by Mayer Amschel Bauer Rothschild — “”Give me control of a nation’s money and I care not who makes it’s laws.” This may have be true when Mayer Rothschild (1744-1812) said it over two hundred years ago, but today it should read, “Who CONTROLS the ENERGY SUPPLY, controls the money.”
The United States Shale Oil Industry is in deep trouble. Now that the price of oil has fallen below $44, watch for spectacular fireworks in the next two quarters. Thus, the collapse of the U.S. Shale Oil Industry may be straw that breaks the back of the market as did the Subprime Housing Market Fiasco in 2008.
The coming Global Market Crash will totally wipe out world silver supplies. The clues are all around us to see, but the majority of investors just don’t want to believe the END IS NEAR.
Please check back for new articles and updates at the SRSrocco Report. You can also follow us at Twitter below:


