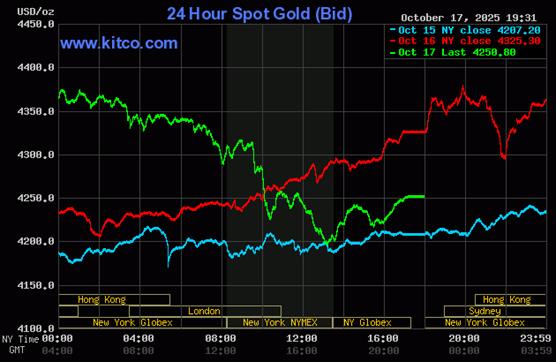
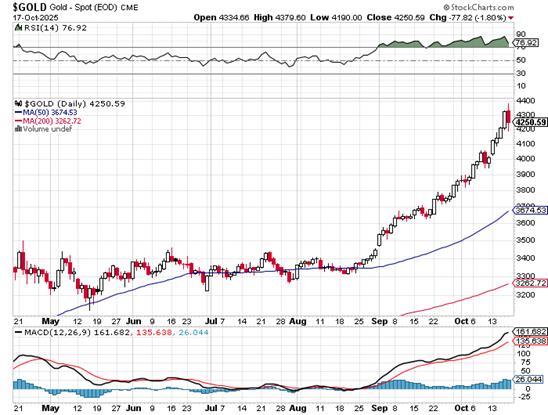
The gold price struggled sharply higher until it was brutally capped minutes before 8 p.m. in Globex trading in New York on Thursday evening -- and its violent engineered down/up move that followed came to an end at 1 p.m. China Standard Time on their Friday afternoon. Then the collusive commercial traders of whatever stripe went to work, with most of the price damage coming between 9:30 a.m. and 1 p.m. in COMEX trading in New York. From that point it was allowed to wander quietly higher until the market closed at 5:00 p.m. EDT.
The high and low ticks in gold were reported as $4,196.00 and $4,392.00 in the December contract...an intraday move of $196.00 an ounce. The October/ December price spread differential in gold at the close in New York yesterday was $23.40...December/February was $33.80...February/April was $29.70 -- and April/June26 was $29.30 an ounce.
Gold was closed in New York on Friday afternoon at $4,250.80 spot...down $74.80 on the day -- and quite some distance...$64.30...off its Kitco-recorded low tick. Net volume was one of the highest I've ever seen...somewhere close to the Oort cloud...at 533,000 contracts -- and there were about 39,500 contracts worth of roll-over/switch volume on top of that.
I saw that another very hefty 4,060 gold contracts, plus 400 silver contracts were traded in October yesterday -- and it remains to be seen just how much of that shows up in tonight's Daily Delivery and Preliminary Report data further down in today's column. I suspect most of it will, as that's been the case lately. I'll have a lot more to say about this in The Wrap.
![]()
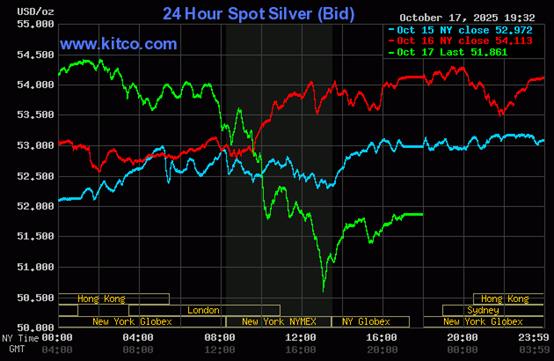
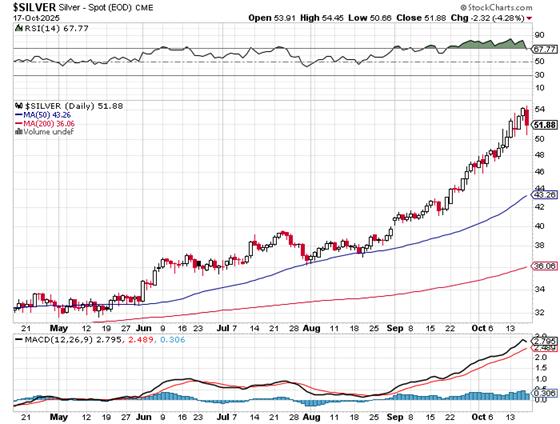
For the most part, the bear raid in silver was pretty much identical to the one that 'da boyz' pulled off in gold, with its engineered low tick set at the same precise moment. However, its ensuing and enthusiastic rally wasn't allowed to get too far.
The high and low ticks in silver were recorded by the CME Group as $53.765 and $49.66 in the December contract...an intraday move of an knee-wobbling $4.105 an ounce. The December/ March price spread differential in silver at the close in New York yesterday was 56.7 cents... March/May was 36.2 cents -- and May/July26 was 34.0 cents an ounce.
Silver was closed on Friday afternoon in New York at $51.86 spot...down $2.25 on the day -- and $1.29 off its Kitco-recorded low tick. Net volume was very monstrous at around 170,500 contracts -- and there were around 12,500 contracts worth of roll-over/switch volume in this precious metal.
![]()
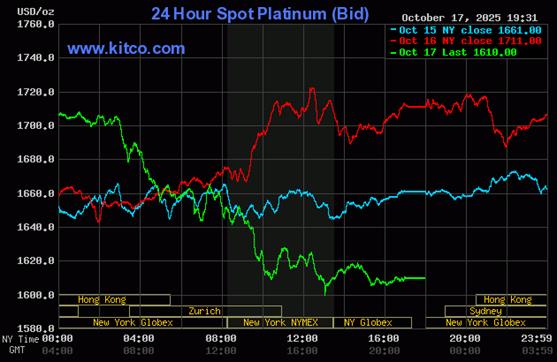
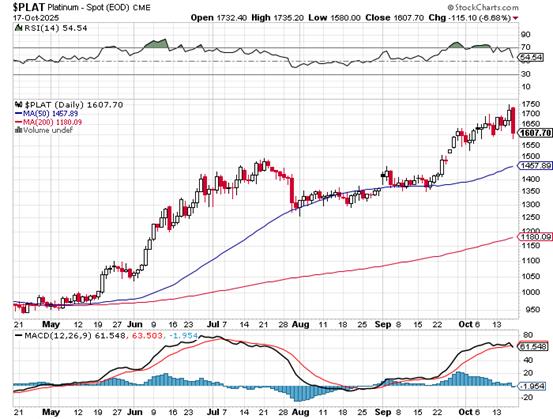
Platinum's price path was very similar to gold and silver's, but only up until the Globex open in Zurich on their Friday morning -- and 'da boyz' laid the lumber on it starting at that juncture... setting its engineered low tick at the same time as well. Its ensuing rally attempt after that ran into 'something' about two hours later -- and it was sold down a bit until shortly after 3 p.m. in after-hours trading -- and it didn't do anything after that. Platinum was closed at $1,610 spot...down $101 on the day -- and only 10 bucks off its Kitco-recorded low tick.
![]()
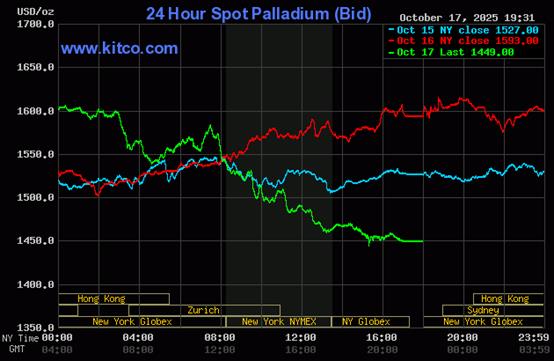
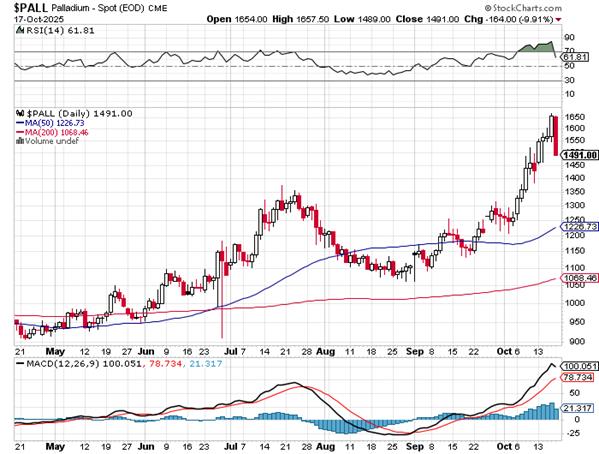
With the exception of its rally in late-morning trading in Zurich, palladium's price path was guided/engineered lower in pretty much a straight line from 9 a.m. CEST, until 1:03 p.m. in COMEX trading in New York -- and its tiny up/down move after that was hardly noticeable. 'Da boyz' closed palladium at $1,449 spot...down a hefty $144 an ounce -- and only 6 dollars off its Kitco-recorded high tick.
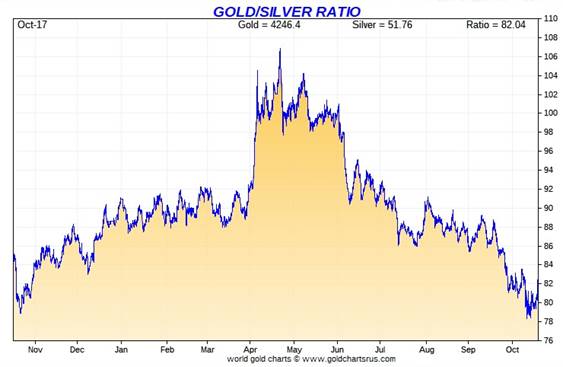
Based on the kitco.com spot closing prices in silver and gold posted above... the gold/silver ratio worked out to 82.0 to 1 on Friday...compared to 79.9 to 1 on Thursday.
Here's Nick's 1-year Gold/Silver Ratio chart, updated with this past week's data. Click to enlarge.
![]()
The dollar index closed very late on Thursday afternoon in New York at 98.34 -- and then opened lower by 9 basis points once trading commenced at 7:45 p.m. EDT on Thursday evening...which was 7:45 a.m. China Standard Time on their Friday morning. It chopped quietly and unevenly lower until around 1:56 p.m. CST -- and then began to chop/stair-step its way broadly and quietly higher until its high tick of the day was set at 10:14 a.m. in New York. It chopped quietly lower from that juncture until 12:22 p.m. EDT -- and then edged quietly higher at an ever-increasing rate until the market closed at 5:00 p.m.
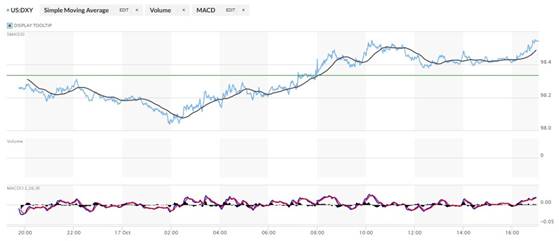
The dollar index finished the Friday trading session in New York at 98.43...uponly 9 basis points above its close on Thursday -- and 11 basis points below it indicated close on the DXY chart below.
Here's the DXY chart for Friday...thanks to marketwatch.com as usual -- and the above-mentioned discrepancy should be noted. Click to enlarge.
![]()
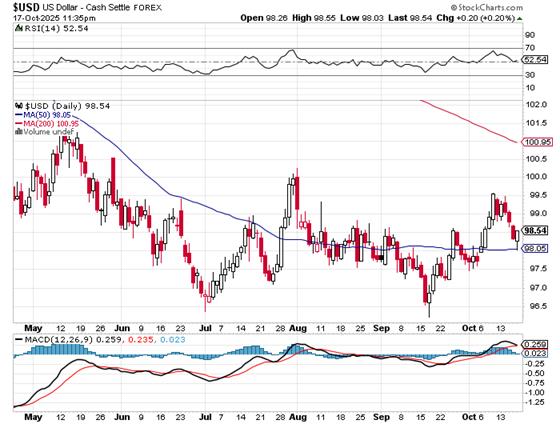
Here's the 6-month U.S. dollar index chart...courtesy of stockcharts.com as always. The delta between its close...98.54...and the close on DXY chart above, was 12 basis points above that. Click to enlarge.
![]()
As has been the case for a very long while now, what the currency market are doing is irrelevant to the price action in the precious metals -- and that's particularly the case when the collusive commercial traders are out and about in force like they were on Friday.
U.S. 10-year Treasury: 4.0070%...up 0.0310/(+0.7797%)...as of the 1:59:54 p.m. CDT close
For the week, the 10-year yield was down 4.40 basis points...thanks to the daily interventions by the Fed.
Here's the 5-year 10-year U.S. Treasury chart from the yahoo.com Internet site -- which puts the yield curve into a somewhat longer-term perspective. Click to enlarge.
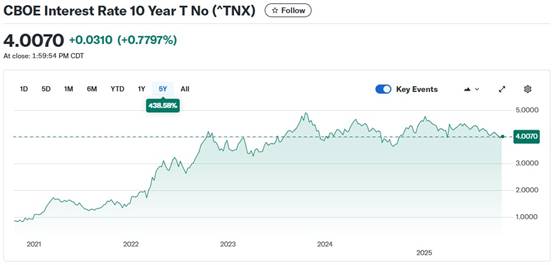
As I continue to point out in this spot every week, the 10-year hasn't been allowed to trade above its 4.92% high tick set back on October 15, 2023 -- and it's more than obvious from the above chart that it will be kept as low as possible, for as long as possible. The Fed is putting in a lot of overtime every day to ensure that it does.
![]()
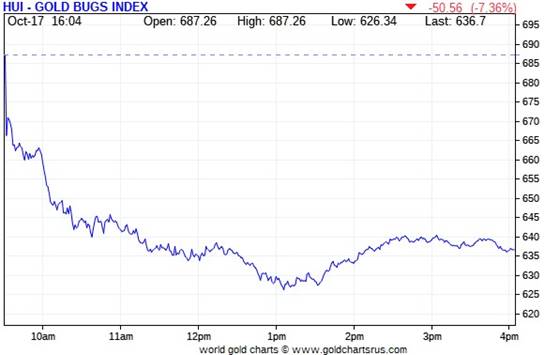
Not surprisingly, the gold shares cratered at the 9:30 opens of the equity markets in New York on Friday morning -- and continued to sell off until a few minutes after 1 p.m. EDT when the collusive commercial traders of whatever stripe set gold's low tick. They then crawled a bit higher at an ever-decreasing rate until around 2:45 p.m. -- and then faded a hair until the markets closed at 4:00 p.m. EDT. The HUI closed down 7.36 percent.
![]()
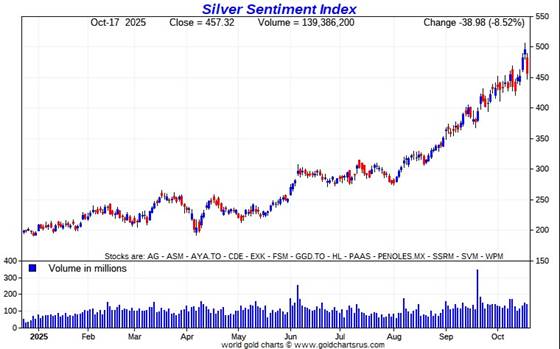
The silver equities followed an identical price path as their golden brethren -- and Nick Laird's Silver Sentiment Index got clocked by 8.52 percent. Here's his 1-year chart. Click to enlarge.
![]()
It was pretty much wall-to-wall dogs yesterday -- and I shan't bother itemizing them.
There was no news yesterday on any of the silver companies that comprise the above Silver Sentiment Index.
The silver price premium in Shanghai is still selling at a discount to the U.S. price. The discount on Friday was -1.26 percent.
The reddit.com/Wallstreetsilver website, now under 'new' and somewhat improved management, is linked here. The link to two other silver forums are here -- and here.
![]()
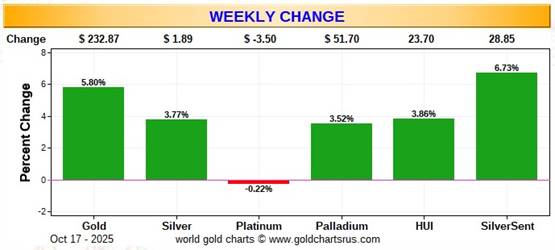
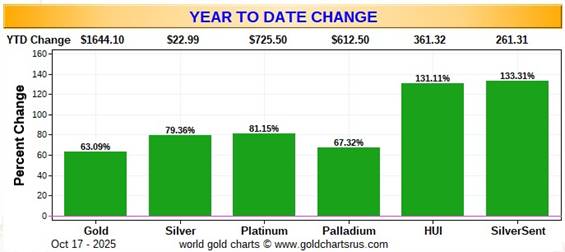
Here are the usual three charts that appear in this spot in every weekend missive. They show the changes in gold, silver, platinum and palladium in both percent and dollar and cents terms, as of their Friday closes in New York — along with the changes in the HUI and the Silver Sentiment Index.
Here's the weekly chart -- and despite the lickin' that 'da boyz' laid on everything precious metal-related yesterday...everything gold and silver-related managed to close in the green regardless...which is testament to the underlying strength of this bull market. I note that the silver equities outperformed their golden brethren by a bit. Click to enlarge.
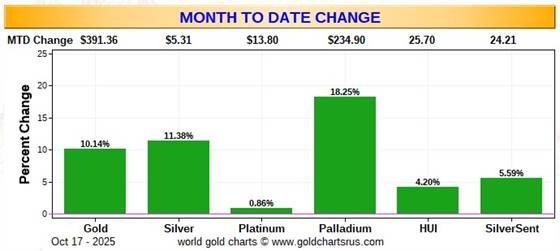
Here's the month-to-date chart...and as I said in this space last week, it's obvious that whatever entities have been active in suppressing the share prices, has been doing so since the start of the month. Click to enlarge.
Here's the year-to-date chart -- and although impressive on its face, being green across the board, the equities still lag the metals...especially the silver stocks. Silver has now surpassed gold in year-to-date gains -- and by a very wide margin...16 percentage points. I have no idea when this situation will change, as the suppression of the precious metals shares since the beginning of the month is a new one on me. But, having said that, they're all up big on the year, for which we should be grateful...but should be up far more than they are. Click to enlarge.
Your copy should address 3 key questions: Who am I writing for? (Audience) Now that silver is at a new nominal high of about $52 the ounce -- and the silver well in London has pretty much run dry, the gold/silver ratio remains at a farcical 82 to 1 as of the Friday's close. The 'normal' and historical ratio is around 15 to 1...which would put silver at about $283. And if priced at the ratio of 7:1 that it comes out of the ground at...compared to gold...that would put silver at a touch over $600 an ounce. So a triple-digit silver price is in our futures -- and all that remains to be resolved is what that number will be.
![]()
The CME Daily Delivery Report for Day 15 of October deliveries showed that 2,161 gold -- plus 312 silver contracts were posted for delivery within the COMEX-approved depositories on Tuesday.
In gold, the largest short/issuer was Canada's RBC Capital Markets, issuing 1,076 contracts out of its client account -- and down the list after them was Wells Fargo Securities, issuing 479 contracts out of its house account. After them came JPMorgan, British bank Barclays and Goldman Sachs...issuing 261, 229 and 105 contracts -- and all from their respective client accounts.
The only three long/stoppers that mattered of the six in total were British bank HSBC, Deutsche Bank and Morgan Stanley, picking up 1,050...564 and 525 contracts respectively...HSBC for their client account.
In silver, the only two short/issuers that mattered were Australia's Macquarie Futures and Wells Fargo Securities, issuing 150 and 130 contracts out of their respective house accounts. The only two long/stoppers that mattered were British bank HSBC and JPMorgan, picking up 192 and 93 contracts for their respective client accounts.
In platinum and palladium, there were 20 and 2 contracts issued and stopped respectively.
The link to yesterday's Issuers and Stoppers Report is here.
Month-to-date there have been a very hefty 53,544 gold contracts issued/reissued and stopped -- and that number in silver is 6,454 COMEX contracts. In platinum it's 4,551 contracts...which is a whole heck of a lot for it -- and in palladium it's 312 contracts.
Back on September 30 when the First Day Notice numbers for October were posted on the CME's website, it showed that gold open interest in that month was only 29,988 COMEX contracts -- and in silver, that number was 2,644 contracts.
It's only Day 15 of the October delivery month -- and there have already been 78.6% more gold contracts added to October -- and silver deliveries are up 144% from the first day notice number. The rush for physical metal has become, as Phil Baker stated...'rapacious'. I have much more on this in The Wrap.
The CME Preliminary Report for the Friday trading session, showed that gold open interest in October dropped by 1,860 COMEX contracts, leaving 2,667 still open...minus the 2,161 contracts out for delivery on Tuesday as mentioned a bunch of paragraphs ago. Thursday's Daily Delivery Report showed that 4,334 gold contracts were actually posted for delivery on Monday, so that means that 4,334-1,860=2,474 more gold contracts were added to the October delivery month.
Silver o.i. in October increased by 17 contracts, leaving 339 still around... minus the 312 contracts out for delivery on Tuesday as per the above Daily Delivery Report. Thursday's Daily Delivery Report showed that 308 silver contracts were actually posted for delivery on Monday, so that means that 308+17=315 more silver contracts were added to the October delivery month.
Total gold open interest in the Preliminary Report on Friday night actually rose by 3,529 COMEX contracts -- and total silver o.i. also increased, it by 1,309 contracts. Both these numbers were a surprise, as I was expecting massive decreases after the pounding that 'da boyz' laid on silver and gold yesterday. The final numbers that come out on Monday will be of some interest.
[I checked the final total open interest numbers for the Thursday trading session -- and it showed a decent drop in total gold open interest...from +7,607 contracts, down to -1,983 COMEX contracts. There was also a drop in total silver o.i. on Thursday...from +3,806 contracts, down to +2,476 contracts.]
Gold open interest in November in the final report for Thursday -- and posted on the CME's website on Friday morning, fell by a further 203 contracts, leaving 3,870 still open. The final silver o.i. number for November on Thursday dropped by 34 contracts, leaving 2,399 COMEX contracts still around.
![]()
There was a monster deposit into GLD on Friday, as authorized participants added 404,916 troy ounces of gold. And after no action in SLV on Thursday, there were 2,404,779 troy ounces of silver added to it on Friday as well.
Of course there was monster activity in their respective shares yesterday. SLV closed down 4.43% on 3.03x its average daily trading volume. But on the other hand -- and despite the fact that the gold stocks got crushed, GLD closed lower by only 1.88% on 4.69x volume...so there were monster buyers gorging on GLD shares yesterday as well. I'll have more on this in The Wrap.
Over at Sprott's PSLV, it was down 4.43 percent too...but only on 0.54x of its normal daily trading volume...nothing at all.
The SLV borrow rate started the Friday session at 16.22% -- and closed at 19.23%...with 300,000 shares available to short by the end of the day. The GLD borrow rate began the day at 0.61% -- and closed at 0.53%... with 2.7 million shares available.
Although there is no stress evident in the gold market in London as far as deliveries are concerned, the world-wide white hot demand may at some point in the future create delivery problems similar to those we're currently witness to in silver. For that reason, I'm watching the comatose GLD borrow rates for any sign of life, no matter how small.
In other gold and silver ETFs and mutual funds on Earth on Friday ...net of any changes in COMEX, GLD, GLDM and SLV activity, there were a net 280,888 troy ounces of gold were added...but an astonishing and somewhat surprising 4,618,741 troy ounces of silver were taken out...with the largest two amounts being the 3,905,749 troy ounces that left iShares/SSLN -- and the 933,463 troy ounces that departed Deutsche Bank. I suspect that this silver was more desperately needed elsewhere.
And still no sales report from the U.S. Mint -- and of course nothing month-to-date, either.
![]()
There was only a bit of activity in gold over at the COMEX-approved depositories on Thursday. Once again, nothing was reported received -- and only 40,992.525 troy ounces/1,275 kilobars were removed. There were 19,322.751 troy ounces/601 kilobars shipped out of Brink's, Inc...followed by the 16,075.500 troy ounces/500 kilobars that departed HSBC USA. The remaining 5,594.274 troy ounces/174 kilobars left JPMorgan.
There was a bit of paper activity, as 28,625 troy ounces were transferred from the Registered category and back into Eligible over at HSBC USA.
The link to Thursday's COMEX gold activity is here.
But there was no let-up in silver. Nothing was reported received, but a further 2,704,032 troy ounces were shipped out, involving six different depositories.
The two largest amounts were the truckloads that left HSBC USA and Manfra, Tordella & Brookes...605,170 and 600,113 troy ounces respectively.
There was big paper activity, as a net 753,657 troy ounces were transferred from the Registered category and back into Eligible involving four different depositories, with the largest amount being the 629,532 troy ounces transferred in that direction over at CNT.
The link to all of Thursday's considerable COMEX silver action is here.
During the lasts five business days, there have been 17.145 million troy ounces of silver depart the COMEX for parts unknown...but most likely London.
The Shanghai Futures Exchange updated their silver inventories as of the close of business on their Friday -- and it showed that a net and further 1,998,248 troy ounces of silver were removed...leaving their silver inventories at 29.582 million troy ounces. This is the biggest one-day drop I've ever seen -- and all five SFE silver depositories showed withdrawals yesterday.
For the week, there were a hefty 8.005 million troy ounce of silver removed from their warehouses...a huge amount. I'm already more than curious as to what the Shanghai Gold Exchange silver withdrawals will show for the week just past when they're posted on their Internet site early next week.
![]()
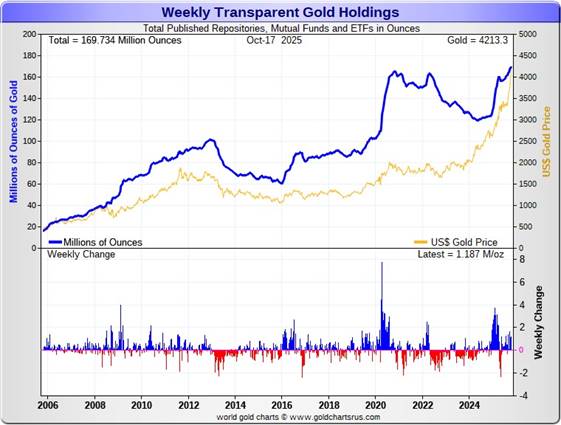
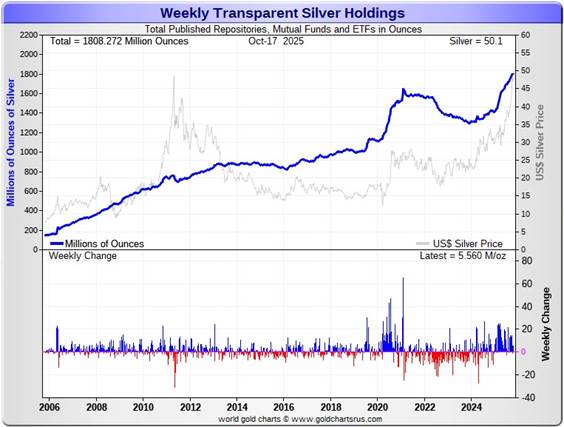
Here are the usual 20-year charts that show up in this space in every weekend column. They show the total amounts of physical gold and silver held in all known depositories, ETFs and mutual funds as of the close of business on Friday.
During the business week just past, there were a net 1.187 million troy ounces of gold added -- and a net 5.560 million troy ounces of silver were added as well.
According to Nick Laird's data on his website, a net 3.127 million troy ounces of gold were added to all the world's known depositories, mutual funds and ETFs during the last four weeks. The three largest 'in' amounts were the 1.755 million into GLD, followed by the net 426,0000 troy ounces into five different iShares ETFs -- and the 409,000 troy ounces into iShares IAU. The two biggest withdrawals by far were the net 576,000 troy ounces that left the COMEX -- and 126,000 troy ounces that were shipped out of Deutsche Bank.
And now for the first time since around October 2022...there is now a new record high amount of gold in all the world's ETFs, depositories and mutual funds.
However, it should be noted that despite the fact that silver has now just made it back to a bit above $50 -- and an new all-time high...the amount of silver held in all these depositories, ETFs and mutual funds is a very noticeable amount above its old all-time high inventory level of January 2021.
Except for the odd week here and there, there have been 37 consecutive weeks of net silver inflows into all the world's depositories, ETFs and mutual funds. As I keep saying in this space, there are obviously some deep-pocket silver stackers out there that know what we know -- and probably know more than we know as well...now that the bottom of the silver inventory barrel is upon us in London.
A net 16.779 million troy ounces of silver were added during that same 4-week time period. That number would have been a lot higher except for that gross 14.919 million troy ounces shipped out of the COMEX...all in this this past week, plus 5 million oz. total out of three other ETFs...Deutsche Bank, WisdomTree and iShares/SSLN. The largest net 'in' amount being the 20.200 million troy ounces added to various and sundry Indian ETFs this past week. That was followed by Aberdeen, with 4.715 million troy ounces added. Then came Sprott's PSLV, with 4.629 million added -- and lastly were the 4.131 million troy ounces added to iShares/SLV. The list goes on and on.
Retail sales have picked up noticeably -- and dealer buy-backs have waned considerably as well. But they're not setting the world on fire...at least here in North America as of yet. The big institutional investors continue making their presence felt in the various ETFs and mutual funds...silver in particular, as you can tell. Gold deposits have picked up quite a bit as well over the last few weeks...but are still lagging behind where they should be, considering what the gold price is sitting at.
At some point there will be ever larger quantities of silver and gold required by all the rest of these ETFs and mutual funds once serious institutional buying really kicks in -- and that's in our face now.
However, the really big buying lies ahead of us when the silver price is finally allowed to rise substantially...which it must do. I'm sure is something that the powers-that-be in the silver world are keenly aware of -- and appear to be in a full-blow panic about now.
Things haven't changed a lot from last week. Physical demand in silver at the wholesale level enormous/rapacious. COMEX silver deliveries have been huge all year...including the current delivery month...October...where 32.270 million troy ounces have been issued and stopped so far. This is more than double what was posted for delivery in October on First Day Notice. The amount of silver being physically moved, withdrawn, or changing ownership is going parabolic. COMEX gold deliveries in October are already 76% higher than posted on First Day Notice.
This "rapacious" silver demand will continue until available supplies are depleted...which now appears at hand -- and we are also fast approaching the sixth year of a structural deficit in silver according to the ongoing reports from The Silver Institute.
The vast majority of precious metals being held in these depositories are by those who won't be selling until the silver price is many multiples of what it is today.
Sprott's PSLV is the third largest depository of silver on Planet Earth with 203.9 million troy ounces...up 1.3 million troy ounces from last week -- and a great distance behind the COMEX, the largest silver depository, where there are 509.5 million troy ounces being held...down a further 13.0 million troy ounces this past week...but minus the 103 million troy ounces being held in trust for SLV by JPMorgan.
That 103 million ounce amount brings JPMorgan's actual silver warehouse stocks down to around the 105 million troy ounce mark...quite a bit different than the 208.1 million they indicate they have...down a net 600,000 troy ounces on the week.
PSLV remains a very long way behind SLV as well -- as they are now the second largest silver depository after the COMEX, with 498.3 million troy ounces as of Friday's close...up a net 1.8 million ounces from last week.
The latest short report [for positions held at the close of business on Tuesday, September 30] showed that the short position in SLV fell by a rather inconsequential 6.69%...from the 58.25 million shares sold short in the prior report...down to 54.35 million shares in this latest short report that came out this past Thursday...9.95% of total SLV shares outstanding. This amount remains grotesque, obscene -- and fraudulent beyond all description...as there is no physical silver backing any of it as the SLV prospectus requires.
BlackRock issued a warning five or so years ago to all those short SLV that there might come a time when there wouldn't be enough metal for them to cover. That would only be true if JPMorgan decides not to supply it to whatever entity requires it.
The next short report...for positions held at the close of trading on Wednesday, October 15...will be posted on The Wall Street Journal's website on Friday evening EDT on October 24.
Then there's that other little matter of the 1-billion ounce short position in silver held by Bank of America in the OTC market...with JPMorgan & Friends on the long side. Ted said it hadn't gone away -- and he'd also come to the conclusion that they're short around 25 million ounces of gold with these same parties as well. Once the silver price approaches three digits, we'll see if they need to get bailed, like Bear Stearns did back in 2008 -- and for the same reason.
The latest OCC Report for Q2/2025 came out about a month ago now -- and it showed that the precious metal derivatives held by the four largest U.S. banks only increased by $25.8 billion/4.89% from Q1/2025...which is nothing much at all -- and that's despite the fact that precious metal prices rose fairly substantially during that time period.
JPMorgan's precious metals derivatives rose from $323.5 billion, up to $358.5 billion in Q2/2025 -- and Citigroup's also rose, but not by much, from $142.8 billion...up to $150.7 billion. BofA's fell from $61.7 billion, down to 44.7 billion -- and the derivatives position held by Goldman Sachs is a piddling and immaterial $219 million -- down from the $269 million held in Q1/2025.
But with JPMorgan holding 64.7% of all the precious metals derivatives... Citibank holding 27.2% -- and Bank of America about 8% of the total of the four reporting banks, it's only JPMorgan and Citigroup that matter.
And as I keep pointing out in this spot every weekend, the OCC indicator is flawed for two very important reasons, as way back 10-15 years ago, this report used to include the top dozen or so U.S. banks -- and included the likes of Wells Fargo and Morgan Stanley, amongst others... that are card-carrying members of the Big 8 shorts. Now the list is down to just four banks...so a lot of data is hidden...which is certainly the reason why the list was shortened. On top of that, the list doesn't include the non-U.S. banks that are members of the Big 8 shorts: British, French, German, Canadian -- and Australian.
Because of the ongoing shut-down of the U.S. government, there's still no Commitment of Traders data on the CFTC's website -- and won't be until it's over.
![]()
CRITICAL READS & VIDEOS
Auto Loan Delinquencies Surge 50% As Cracks Deepen Across U.S. Credit Markets
A month after bankruptcies of subprime auto lender Tricolor and auto-parts supplier First Brands, new cracks emerged in U.S. credit markets. This week, Zions and Western Alliance disclosed they were victims of loan fraud tied to funds investing in distressed commercial real estate. The revelations come amid broader credit trouble, and shifting our focus back to autos, there's new data this morning about credit products tied to the riskiest consumers that have seen a 50% surge in delinquencies.
Bloomberg cites data from the credit-scoring company, VantageScore, which reveals that delinquencies among the low-tier consumers have surged 50% since 2010. Fueling the delinquencies is a perfect storm of record-high car prices, elevated interest rates, longer loan terms, and monthly payments that average nearly as much as rent for some folks.
Since 2019, new vehicle prices have jumped over 25% to $50,000, while average monthly payments reached $767, with 20% of borrowers paying over $1,000 per month. Loan rates now exceed 9%, worsening the affordability crisis.
Notably, prime and near-prime borrowers are now defaulting faster than subprime consumers, as lenders tightened standards for the lowest-credit segment, according to the report. The average auto loan balance has risen 57% since 2010, and many borrowers are "upside-down", owing more than their cars are worth.
"We're seeing the cost of cars and the cost related to car ownership increase enormously," VantageScore chief economist Rikard Bandebo said in an interview. "In the past five years, it has increased even faster."
This Zero Hedge story showed up on their Internet site at 2:20 p.m. on Friday afternoon EDT -- and another link to it is here.
![]()
Before we delve into bugs and larvae currently gnawing away at the Bubble’s periphery, a brief jaunt down memory lane. From economist (and actor) Ben Stein’s August 12, 2007, New York Times op-ed, “A Market Crisis Disconnected From Reality” - which articulated the conventional view following the June subprime eruption.
“The total mortgage market in the United States is roughly $10.4 trillion. Of that, a little over 13%, or about $1.35 trillion, is subprime - certainly a large sum. Of this, nearly 14% is delinquent, meaning late in payment or in foreclosure. Of this amount, about 5% is actually in foreclosure, or about $67 billion. Of this amount, according to my friends in real estate, at least about half will be recovered in foreclosure. So now we are down to losses of about $33 billion to $34 billion. The rate of loss in subprime mortgages keeps climbing. In time, perhaps it will double, maybe back to $67 billion… But by the metrics of a large economy, it is nothing. The total wealth of the United States is about $70 trillion. The value of the stocks listed in the United States is very roughly $15 trillion to $20 trillion. The bond market is even larger… My point is this: I don’t know where the bottom is on subprime. I don’t know how bad the problems are at Bear. Yet I do know that the market reactions are wildly out of proportion to the real problems that have been revealed or even hinted at… This economy is extremely strong. Profits are superb. The world economy is exploding with growth… Some smart, brave people will make a fortune buying in these days, and then we’ll all wonder what the scare was about.”
“Terminal phases” tend to be as confounding as they are enthralling. Things appear robust. Late-cycle loose financial conditions ensure boom-sustaining Credit excess. Booming debt bolsters corporate earnings, incomes and economic activity, as ever-inflating stock and asset prices crystallize the perception of boundless wealth and bright prospects (“permanently high plateau”).
For a bit, Ben Stein and the risk-dismissive bullish narrative appeared well-founded. The S&P500 reached a record 1,576 intraday on October 11, 2007. It’s worth noting that Q3 2007 saw Corporate Bonds (from the Fed’s Z.1) expand a then record $471 billion and Total Mortgages grow a strong $302 billion, as Credit boom momentum at the “Core” initially spurned cataclysmic “Periphery” developments.
But I’m getting somewhat ahead of the game. There is yet no cataclysm, though it was another week that suggests the clock is ticking. Friday’s 1.7% rally reduced the week’s losses for the KBW Regional Bank Index in half. Zions 5.8% Friday rally cut its week’s loss to 5.1%, with Western Alliance Bancorp’s 3.1% recovery reducing losses to 3.3%. Despite Friday’s gains, the NASDAQ Financial and Insurance indices closed the week down 1.9% and 3.6%. The NASDAQ Financial Index ended Thursday at the lowest close since June 27th, with the NASDAQ Insurance Index trading Thursday to lows since April 9th.
Doug's weekly commentary is always worth reading -- and this week's efforts appeared on this website just before midnight PDT. The link to it is here.
![]()
Three worthwhile and informative video interviews
1. INTEL Roundtable w/Larry Johnson, Ray McGovern, & Scott Ritter : Weekly Wrap 17-October
This 23-minute video interview that is live from Moscow. It was hosted by Judge Andrew Napolitano as usual -- and was posted on the youtube.com Internet site early on Friday morning EDT. I thank Guido Tricot for his one -- and the two that follow. The link to this one is here.
2. Why Trump’s Gaza Deal Will Fail -- Professor John Mearsheimer
This 25-minute video interview with the Professor was also hosted by the Judge from Moscow. It showed up on the youtube.com Internet site on Friday morning EDT -- and the link to it is here.
3. Spheres of Security to Prevent World War III -- Professors John Mearsheimer and Jeffrey Sachs
How should the security needs of great powers be balanced with the sovereignty of smaller nations on their border? The concept of Spheres of Security limits the activity of other borders of other great powers. Mexico has the freedom to engage in political and economic cooperation with any state, yet Mexico does not have the freedom to host Russian missiles or Chinese military bases. This is common sense and must be applied to all great powers, yet how feasible is such an agreement between the great powers?
John J. Mearsheimer is the R. Wendell Harrison Distinguished Service Professor of Political Science at the University of Chicago, where he has taught since 1982. Jeffrey D. Sachs is a world-renowned economics professor, bestselling author, innovative educator, and global leader in sustainable development.
This 1 hour and 16 minute discussion hosted by Professor Glenn Diesen appeared on the youtube.com Internet site very early on Wednesday morning EDT -- and is worth your while if you have the interest. I thank Guido for this one as well -- and the link to it is here.
![]()
Ray Dalio Explains Why Gold & Why Now...
Bridgewater Associates founder Ray Dalio stated on Friday that gold has started replacing some U.S. Treasury holdings as the riskless asset for investors, amid a continued surge in the yellow metal’s prices.
This comes after he said investors should allocate as much as 15% of their portfolios to gold even as the precious metal surged to new all-time highs this week.
“Gold is a very excellent diversifier in the portfolio,” Dalio said Tuesday at the Greenwich Economic Forum in Greenwich, Connecticut.
“If you look at it just from a strategic asset allocation perspective, you would probably have something like 15% of your portfolio in gold … because it is one asset that does very well when the typical parts of the portfolio go down.”
Dalio took to social media on Wednesday to invite questions about gold as an investment.
This article was posted on the Zero Hedge website at 8:30 p.m. EDT on Friday evening -- and another link ![]()
India’s Festive Season Drives Gold Premiums to Decade-High Levels
Gold premiums in India have surged to their highest levels in over ten years due to strong demand linked to the festive season. As of October 17, dealers in India are charging premiums of up to $25 per ounce over official domestic prices. This increase comes as spot gold prices broke through the $4,300 mark for the first time, climbing 7.6% in a week amid escalating U.S.-China trade tensions and predictions of a potential U.S. interest rate cut.
Domestic gold prices in India have reached a historic high of 131,699 rupees per 10 grams. Facing high premiums, Indian dealers have noted a significant rise in investor interest despite weaker jewelry demand. Ashok Jain, a gold wholesaler based in Mumbai, remarked on the impact of the ongoing price rally, which has encouraged purchases, particularly in small denomination coins and bars as preparations for the Dhanteras and Diwali festivals commence.
This gold-related news item was posted on the el-balad.com Internet site on Friday -- and I found it on Sharps Pixley. Another link to it is here. A related story from the metroindia.net Internet site is headlined "Gold rush ahead of Diwali; Buyers prefer solid metal over jewellery" -- and I found that on Sharps Pixley as well. The link to it is here.
QUOTE of the DAY
The WRAP
"Understand this. Things are now in motion that cannot be undone." -- Gandalf the White
![]()
Today's pop 'blast from the past' is from the disco era...1979 to be exact. When the song was first heard by Benny Anderson and Björn Ulvaeus of ABBA fame, it inspired them to write their 1979 hit Gimme! Gimme! Gimme! (A Man After Midnight). Neither the tune nor the artist need any introduction -- and the link to it is here. Of course there's a bass cover this -- and that's linked here.
Several weeks back I featured Polish child prodigy/composer/virtuoso pianist Frédéric Chopin's first piano concerto -- and today it's his No. 2 in F minor, Op. 21..which he composed in the fall of 1829. He completed the work before he had finished his formal education, at around 20 years of age.
It was first performed on 17 March 1830, in Warsaw, Poland, with the composer as soloist. It was the second of his piano concertos to be published, and so was designated as "No. 2", even though it was written first.
Here's 19-years young Spanish-born pianist Rosalía Gómez Lasheras doing the honours at the Young Pianist Festival finale in Amsterdam on November 24, 2013...which she won -- and for good reason, as it's a fantastic performance. The link is here.
![]()
I said in my closing commentary in The Wrap on Friday that because of the big options expiry in SLV..."we could see a disorderly/wild & crazy session in the precious metals during COMEX trading today."
I was right about that more than I wanted to be, but even I was taken aback by the ferocity of those collusive commercial traders, as they didn't take any prisoners. If you were brave/smart enough to buy that dip...good for you.
And you just have to know that it was the collusive commercial traders behind it all, because it's a certainty...as Ted Butler pointed out from time to time... that the traders in the Managed Money, Other Reportables and Nonreportable/ small traders category, that are mega net long the four precious metals, didn't have a Zoom meeting on Thursday evening to decide how to collectively lose billions of dollars on Friday.
But what is also certain, as I've mentioned previously, was that a goodly portion of all the new money invested on the long side in all areas of the precious metals space, was done on margin -- and they all got blown out yesterday. The vast majority of precious metal investors did nothing.
The other thing that I noticed in both gold and silver was that after their respective engineered low ticks were in, their ensuing rallies had to be constrained, or they would have gained back far more of their loses than were allowed.
Despite the carnage yesterday, silver & gold are still up 79 and 63 percent year-to-date respectively -- and their equities are higher by 133 and 131 percent over the same time period. Ho hum...this too shall pass -- and we'll get over it.
But only the paper prices were changed yesterday, as demand for physical gold and silver at the wholesale level remains close to incandescent...as does retail demand overseas. The backwardation in silver is still there -- as are the liquidity issues in London and elsewhere...with the drumbeat of the supply/ demand deficit now deafening.
Based on the December price of $50.104 in the CME's settlement numbers for silver last night, the backwardation between it and the closing spot price on Friday was $1.75 an ounce...with diminishing backwardation extending all the way out to and including September 2026.
As for why 'da boyz' went after platinum and palladium with such ferocity, is unknown...but they really laid the lumber to both in the spot market -- and in their current front months, where they were closed down $115 and $164 respectively.
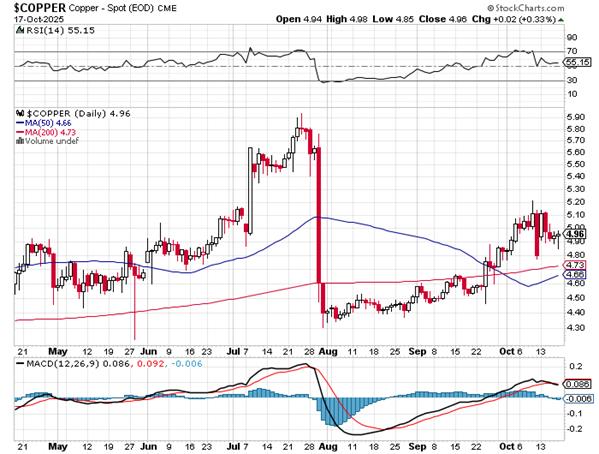
But they were a 'no-show' elsewhere, as copper traded in only a 13 cent range yesterday -- and closed well of its $4.85 low tick...up 2 cents at $4.96/pound.
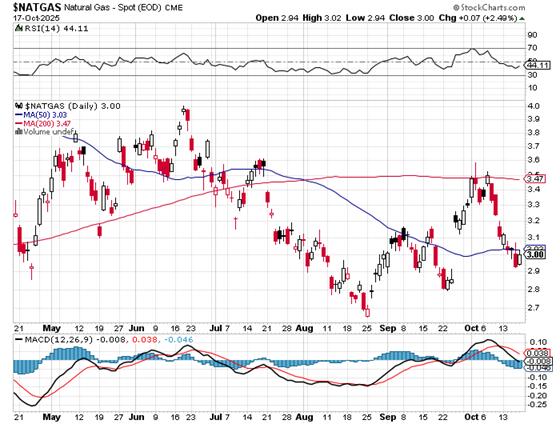
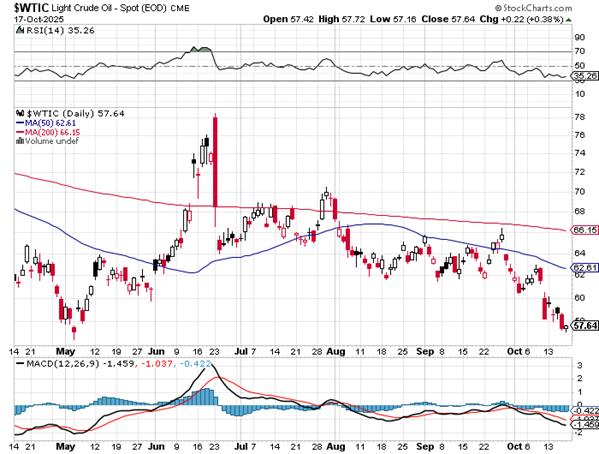
Natural gas [chart included] touched its 50-day moving average at its high tick on Friday, but was closed below it by 3 cents at $3.00/1,000 cubic feet...up 7 cents on the day. WTIC closed higher by an inconsequential 22 cents at $57.64/barrel.
Here are the 6-month charts for the Big 6+1 commodities...courtesy of stockcharts.com as always and, if interested, their COMEX closing prices in their current front months on Friday should be noted. Click to enlarge.
In an e-mail I received from reader Paul O'Brien early on Friday morning, he had this to say about GLD and SLV..."Absolutely gargantuan volume in GLD and SLV in pre-market! By 8 a.m. over 2 million shares traded in GLD and SLV each! Never seen that before that I can remember. Boys are desperate for sure! I would think they would be drowning in margin calls by now!"
They are.
One has to suspect that 'da boyz' were mostly successful in their attempts to close as many SLV call options out of the money as they could, as I noted that at its intraday low tick yesterday, they got SLV below $46 by about a dime. That was the object of the exercise -- and because they couldn't take down silver/SLV on its own, they smashed the entire precious metals complex at the same time in order to cover their tracks.
It was also noteworthy that even though gold and its shares closed down a whole bunch, GLD only closed down 1.88%...but on 4.69x its average daily trading volume...way more than SLV -- and it's a given that those short GLD [and SLV] were the big buyers of all those shares sold in a panic.
As I've been mentioning for most of the week -- and once again at the top of today's column in my gold commentary, the number of new gold contracts traded/delivered in October every day has been enormous.
I pointed out further up -- and do so in every Saturday column, total gold open interest on First Day Notice for October deliveries was only 29,988 contracts. As of last night's Daily Delivery Report, the number of gold contracts issued and stopped so far this month is now up to 53,544 COMEX contracts.
Another 4,060 gold contracts were traded in October on Friday -- and of that amount, last night's Preliminary Report showed that 2,474 contracts of that amount were added to the October delivery month -- most of which is out for delivery on Tuesday.
In a GATA dispatch from yesterday, was this most excellent and right-on-the-money post by a chap named Michael Lynch that deals directly with this situation. It's headlined "The run on physical gold accelerates" -- and was posted on his econanalytics.substack.com Internet site on Friday. It deals with October COMEX gold deliveries up until Thursday night. It's a MUST READ -- and linked here!
The only thing that I would factor in, is that you can add those 2,161 contracts added on Friday to the last bar of his last chart...taking October deliveries from 51,383 COMEX contracts, up to 53,544 contracts.
There are still ten business days left in the October delivery month -- and I'm prepared to bet that proverbial ten dollars that October should turn out to be the heaviest delivery month of the year so far...surpassing February by a bit. However, it's entirely possible that December will turn out to be the heaviest delivery month of 2025. Time will tell.
So, despite the machinations in the paper market, the relentless and rapacious demand for physical silver and gold continues without interruption. It's now a race to secure as much of these precious metals as possible before supplies run out -- and their respective prices are allowed to reflect that.
As I stated in yesterday's missive, the straws in the wind...which has now achieved hurricane force...for much higher demand [and prices] for gold and silver are growing every greater in number.
The first and by far the biggest straw was that interview with former Hecla Mining and Silver Institute CEO Phil Baker commenting on that "rapacious" demand for physical silver that will require far higher prices to satisfy. He's 100% correct about that -- and the link to it is here. That was followed by that Morgan Stanley story stating that their client's investment portfolio should be revised to 60/20/20...with that last 20% being gold. And lastly was Jamie Dimon's comment that it is now "semi-rational" to hold gold... suggesting it could rise to $5,000 to $10,000 an ounce. That story is linked here. I said at the time, that coming from him, it was a ringing endorsement to buy it with both hands -- and that's what it was.
The attempt by the western globalist power & financial elite to keep everyone on the paper asset side of the street for the last 54 years is crumbling fast. The rush to hard assets, led by both silver and gold, is not only on in earnest...but now unstoppable.
As always, I'm still "all in" -- and will remain so to whatever end.
See you here on Tuesday.
Ed
About the author

SUBSCRIBE: https://edsteergoldsilver.com/

Ed Steer’s Daily Analysis of the Gold and Silver Markets
After eight years of writing about the precious metals for Casey Research, the folks at Stansberry & Associates—who just recently purchased controlling interest in the company—decided that my ‘niche market’ column didn’t fit into their plans.
Since the time that Casey Research was kind enough to offer me a stand-alone column, it became their most highly-rated blog almost from the outset—and has remained that way up to this date...