YESTERDAY in GOLD, SILVER, PLATINUM and PALLADIUM
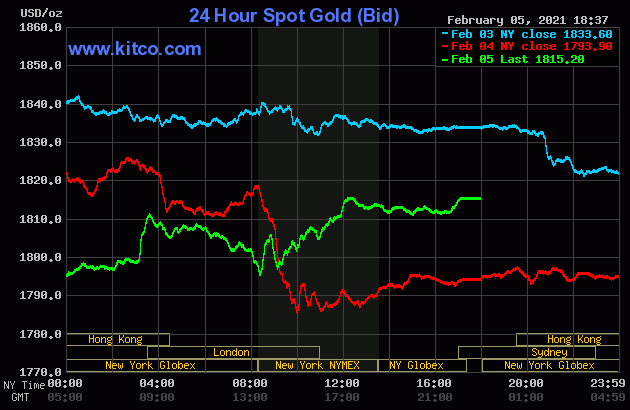
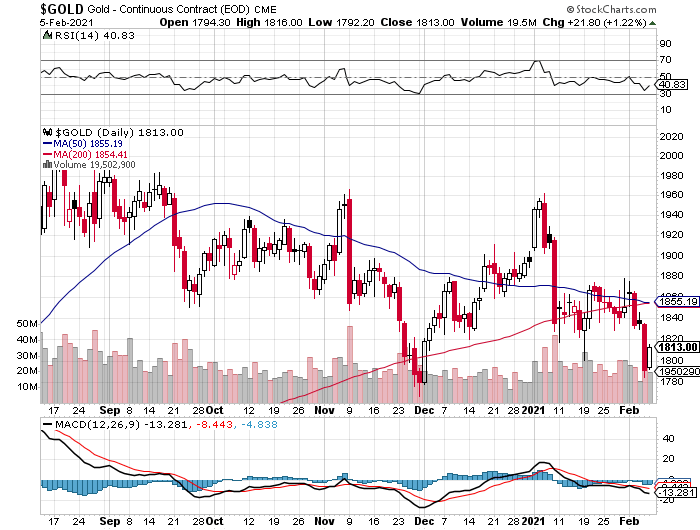
The gold price didn't do much of anything in morning trading in the Far East on their Friday. But starting around 12:45 p.m. China Standard Time it began to edge a bit higher -- and jumped up some more minutes after the London open. That rally wasn't allowed to get far -- and from that juncture it was sold lower going into the 8:30 a.m. jobs report in New York. That sent the gold price higher, but it obviously ran into 'something' around 12:30 p.m. EST -- and it crawled lower until around 4:20 p.m. in after-hours trading. It ticked a few dollars higher going into the 5:00 p.m. EST close.
The low and high tick were reported by the CME Group as $1,792.20 and $1,816.00 in the April contract. The April/June price spread differential in gold at the close yesterday was $2.60...June/August was $2.20 -- and August/October was $1.90.
Gold finished the Friday session on its high of the day...$1,815.20 spot, up $21.30 from Thursday's close. Net volume was on the heavier side, but not overly so, at a bit over 194,500 contracts -- and there was 12,000 contracts worth of roll-over/switch volume on top of that.
|
|
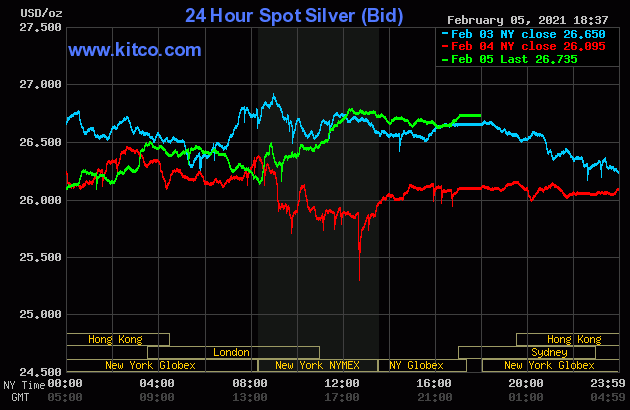
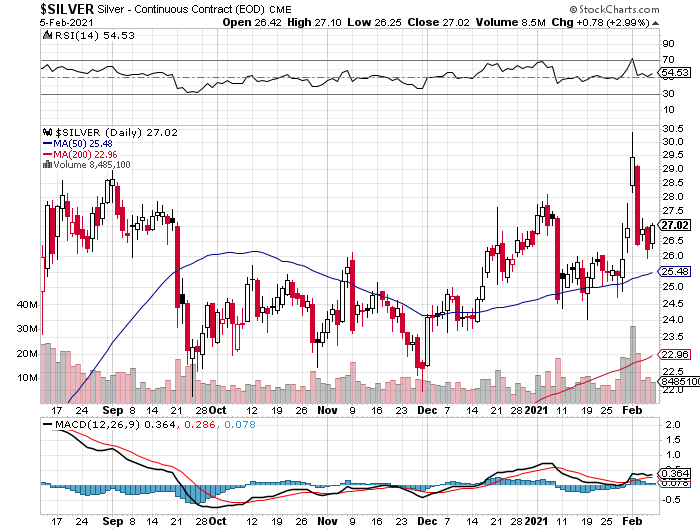
For all intents and purposes, silver's price path was identical to gold's, with the only real difference being that the high price tick in this precious metal was set around 12:15 p.m. in New York...rather than at the 5:00 p.m. EST close.
The low and high ticks in silver were recorded as $26.255 and $27.105 in the March contract. The March/May price spread differential in silver at the close yesterday was 3.9 cents...May/July was 0.9 cents -- and July/September was actually in backwardation by 0.5 cents!!! That's how bloody tight the silver market is -- and gold too...but nothing like silver.
The stresses are obviously enormous. Ted will certainly have something to say about this in his weekly review for his paying subscribers this afternoon.
Silver finished the Friday trading session in New York at $26.735 spot, up 64 cents on the day. Net volume was slightly elevated at a hair under 66,000 contracts, which is certainly good news considering the price action -- and there was a hair under 29,000 contracts worth of roll-over/switch volume out of March and into future months...mostly May.
|
|
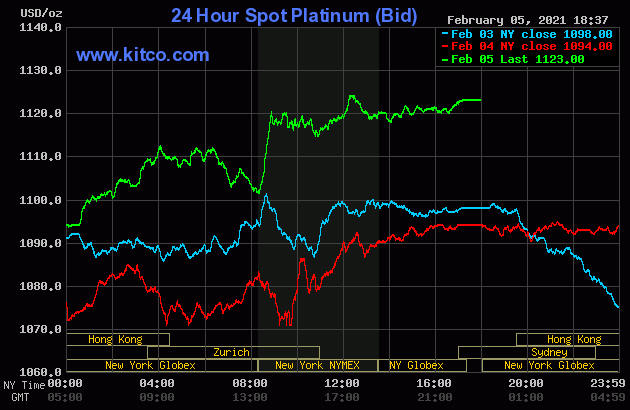
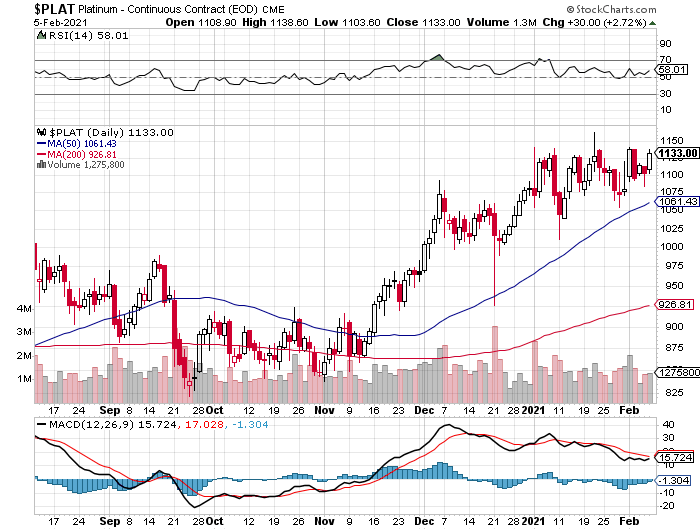
The platinum price traded flat until around 1:40 p.m. China Standard Time on their Friday afternoon -- and then began to head higher. It obviously ran into 'something' a minute or so after 10 a.m. in Zurich -- and after trading sideways for a couple of hours, was sold lower until 8:30 a.m. in New York. Away it went to the upside from there, but obviously ran into another 'something' about fifteen minutes later. Then, under obvious price resistance at 12:30 p.m. like in silver and gold, crept higher until trading ended at 5:30 p.m. EST. Platinum finished the day at $1,123 spot, up 29 bucks from Thursday's close.
|
|
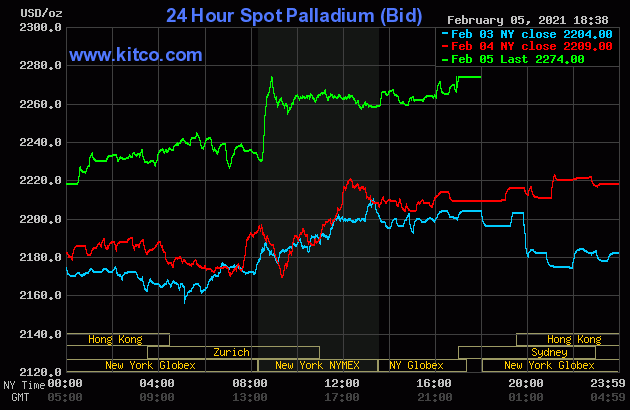
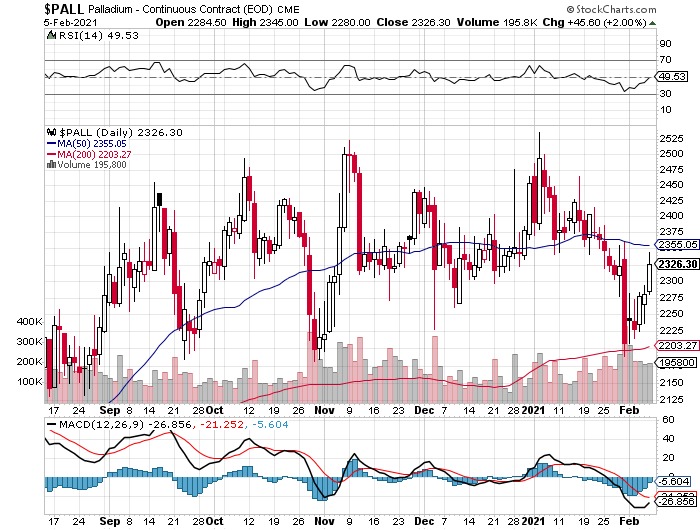
The palladium price stair-stepped its way quietly higher until around 11:40 a.m. in Zurich trading -- and then was sold lower until the 8:30 a.m. EST jobs report hit the wires. Its spike higher at that juncture obviously ran into the same 'something' as platinum -- and it was sold a bit lower before trading flat into the 1:30 p.m. COMEX close. From that point it crept a few dollars higher until trading ended at 5:00 p.m. EST in New York. Palladium finished the Friday session at $2,274 spot, up 65 dollars on the day.
|
|
There was a net 1,392 palladium contracts traded in March yesterday, plus there were 667 contracts rolled over into June.
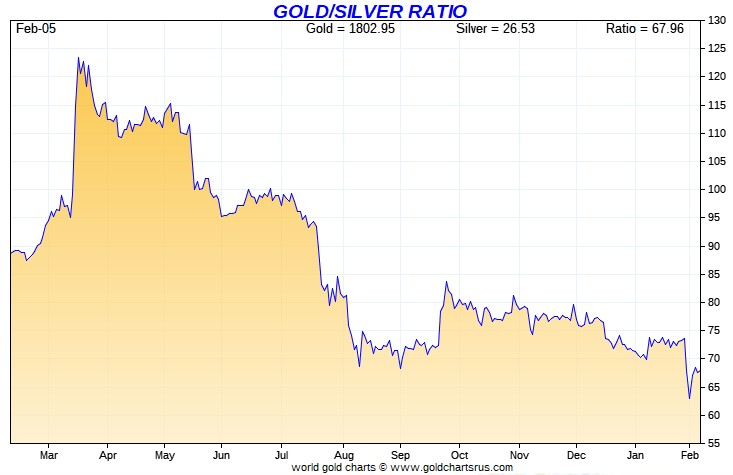
Based on the kitco.com closing spot prices posted above, the gold/silver ratio worked out to 67.9 to 1 on Friday...compared to 68.7 to 1 on Thursday.
Here's Nick's 1-year Gold/Silver Ratio chart, updated with this week's data. Click to enlarge.
|
|
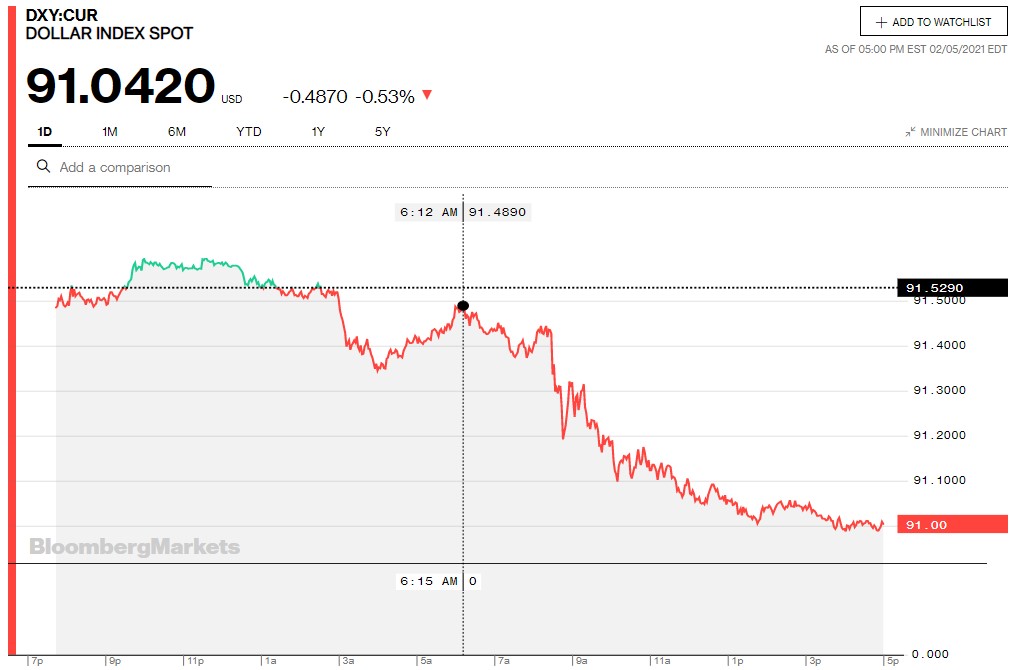
The dollar index closed very late on Thursday afternoon in New York at 91.529 -- and opened down about 4.5 basis points once trading commenced around 7:45 p.m. EST on Thursday evening, which was 8:45 a.m. China Standard Time on their Friday morning. It crawled a bit higher and into positive territory by 11 a.m. CST -- and then began edge very slowly lower until around 11:10 a.m. in London. Then the decline became far more precipitous -- and that decline lasted until about an hour or so before trading ended at 5:30 p.m. in New York.
The dollar index finished the Friday trading session at 91.042...down almost 49 basis points from its close on Thursday, but 4 basis points above its spot close on the DXY chart below.
Here's the DXY chart for Friday, courtesy of Bloomberg as always. Click to enlarge.
|
|
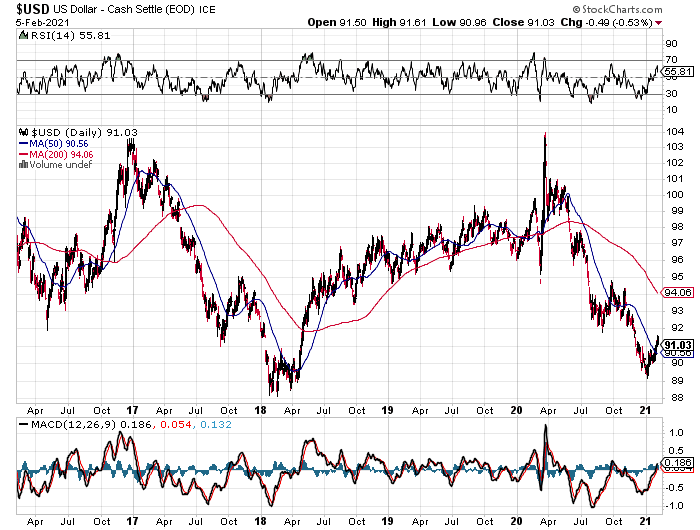
And here's the 5-year U.S. dollar index chart that appears in this spot in every Saturday column, courtesy of stockcharts.com as usual. The delta between its close...91.03...and the close on the DXY chart above, was about 1 basis point below its spot close on Friday. Click to enlarge as well.
|
|
Although yesterday's decline was a set-back for the budding rally in the U.S. dollar index, it's way too soon to say whether this rally...real or engineered...has more room to the upside, or will roll over at this point. But as you know, I've been watching out for this event for many months now.
And just as point of interest, Gregory Mannarino raised a tiny red flag on the 10-year Treasury yield, as it jumped up to 1.17 on Friday. He has much more to say about that in his rant in the Critical Reads section.
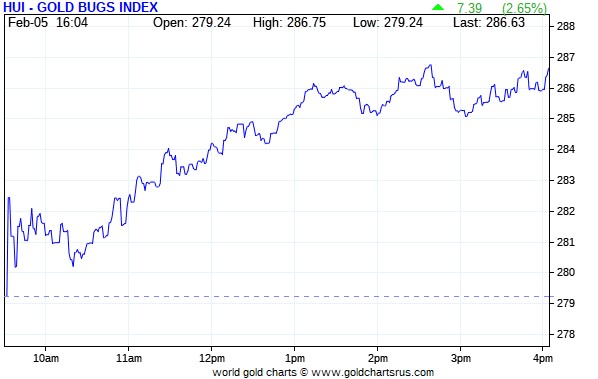
The gold shares began to rally right out of the gate at the 9:30 open in New York on Friday morning -- and all the gains that mattered were in by around 2:45 p.m. EST -- and they didn't do much of anything after that. The HUI closed higher by 2.65 percent.
|
|
Unfortunately, Nick's Intraday Silver Sentiment Index has gone M.I.A. once again, but computing it manually showed that it closed higher by 2.42 percent...not helped at all by the price performance of thinly-traded Peñoles.
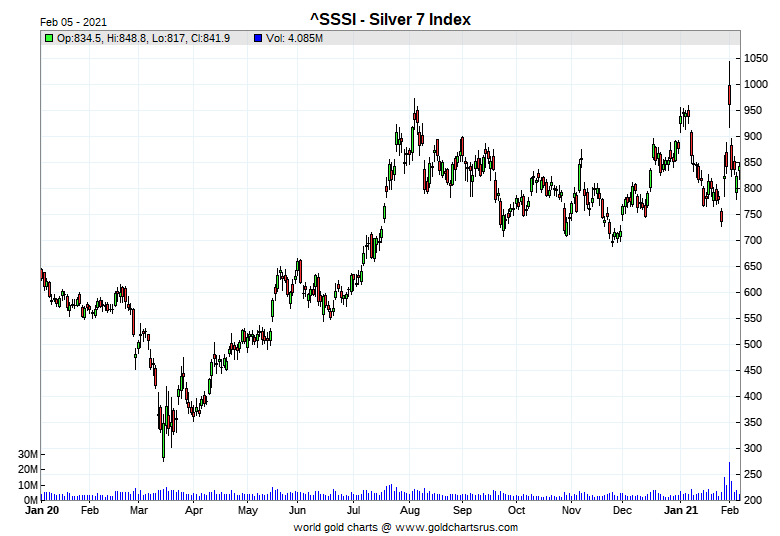
And here's Nick's 1-year Silver Sentiment/Silver 7 Index chart, updated with Friday's doji. Click to enlarge.
|
|
The two stars yesterday were Hecla and Coeur Mining, closing higher by 4.79 and 4.66 percent respectively -- and the dog was the aforesaid mentioned Peñoles, closing lower by 0.06 percent on only 300 shares traded.
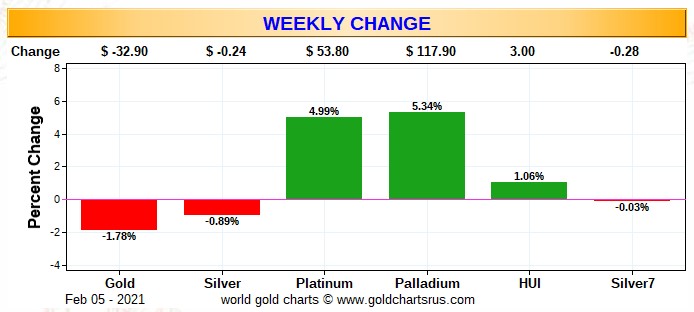
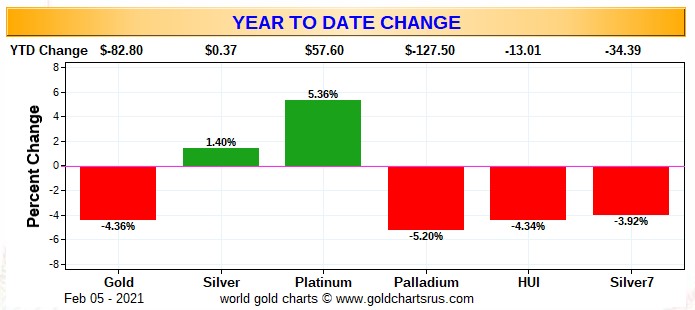
Here are two of the three usual charts that shows up in every Saturday missive. They show the changes in gold, silver, platinum and palladium in both percent and dollar and cents terms, as of their Friday closes in New York - along with the changes in the HUI and the Silver 7 Index.
Here's the weekly/month-to-date chart...since the new month exactly one week old -- and the standouts are platinum and palladium...because as you already know, the Big 8 shorts capped and crushed gold and silver on Tuesday -- and as result, their underlying equities didn't do much. Click to enlarge.
|
|
And here's the year-to-date chart, which is only five weeks old -- and the negative price pressure so far this year has taken its toll on everything...especially the silver equities vs. the underlying precious metal. There's no way to sugar-coat this. It's ugly. However, having said all that, it would only take one more very decent rally day in the precious metals themselves, to pop their associated equities back in the green year-to-date. Click to enlarge.
|
|
And as Ted Butler has pointed out on many occasions, the short positions of the Big 8 traders in general -- and the Big 4 shorts in particular, are the sole reason that prices aren't at the moon already, as virtually every other group of traders in the COMEX futures market are net long against them in all four precious metals.
In the COT discussion further down, the Big 4 traders of the Big 8 shorts increased their short position in silver by a monstrous amount during this past reporting week -- and decreased their short position in gold by an immaterial amount.
The CME Daily Delivery Report for Day 7 of February deliveries showed that 2,049 gold and 18 silver contracts were posted for delivery within the COMEX-approved depositories on Tuesday.
In gold, of the five short/issuers in total, the only two that mattered were Barclays and Goldman Sachs, as they issued 1,326 and 666 contracts from their respective client accounts. As always, JPMorgan was the largest long/stopper, picking up 867 contracts in total...319 for their house account -- and the other 548 for clients. Next was Morgan Stanley, stopping 287 contracts for their client account -- and right behind them was BofA Securities, as they picked up 283 contracts for their own account. In third and fourth spots were Standard Chartered and Barclays, stopping 230 and 212 contracts for their respective in-house/proprietary trading accounts -- and the list goes on and on...
In silver, the largest of the four short/issuers was Morgan Stanley, with 12 contracts out of their client account. They also stopped 4 contract for their client account as well. The other two long/stoppers of note were JPMorgan, as the picked up 9 contracts for clients -- and they were followed by Morgan Stanley, as they stopped 8 contracts in total...4 for their client account -- and the other 4 for their own account.
The link to yesterday's Issuers and Stoppers Report is here.
So far in February, there have been 25,248 gold contracts issued/reissued and stopped -- and that number in silver is 1,624 contracts.
The CME Preliminary Report for the Friday trading session showed that gold open interest in February fell by 678 contracts, leaving 10,265 still around, minus the 2,049 contracts mentioned a few paragraphs ago. Thursday's Daily Delivery Report showed that 708 gold contracts were posted for delivery on Monday, so that means that 708-678=30 more gold contracts just got added to the February delivery month. Silver o.i. in February dropped by 53 contracts, leaving 550 still open, minus the 18 contracts mentioned a few paragraphs ago. Thursday's Daily Delivery Report showed that 94 silver contracts were actually posted for delivery on Monday, so that means that 94-53=41 more silver contracts were added to February.
Total gold open interest at the close of trading yesterday dropped by 7,350 COMEX contracts, which was certainly unexpected -- and total silver o.i. rose by 1,301 contracts...not as much as one would have thought based on yesterday's rally. Both these numbers are subject to some minor revisions by the time the final numbers are posted on the CME's website mid-morning on Monday EST.
There were net withdrawals from both GLD and SLV on Friday. In GLD there was a net 107,024 troy ounces of gold removed/converted -- and in SLV, it was another big number...4,551,933 troy ounces was withdrawn or converted.
Whether or not these were plain vanilla redemptions, or conversion of GLD and SLV shares for physical, is impossible to know. But considering the price action in silver and gold yesterday and all of this week -- and the extreme tightness in the physical and COMEX markets in both...especially silver, the latter of the two scenarios is the most probable. Ted will certainly have something to say about this in his weekly review to his paying subscribers this afternoon.
In other gold and silver ETFs and mutual funds on Planet Earth on Friday, net of any changes in COMEX, GLD & SLV inventories, there was a net 103,132 troy ounces of gold withdrawn, but a net 895,933 troy ounces of silver was added...the largest amount [1,250,105 troy ounces] ended up at Sprott.
There was a sales report from the U.S. Mint yesterday, as they sold 22,500 troy ounces of gold eagles -- and that was all.
Month-to-date the mint has sold 64,500 troy ounces of gold eagles -- 9,000 one-ounce 24K gold buffaloes -- and only 1,621,000 silver eagles.
Those silver eagle sales in February were reported on Monday, February 1 -- and as I said at the time, I highly suspected that they were produced in January, but not reported until the new month because they didn't want to show silver eagle sales in January of 6.4 million coins.
In addition to the above comment, which appeared in my Tuesday column, I had this to say about silver eagle sales in Friday's missive -- and it's worth repeating...
"They've certainly been slow pushing out silver eagles over the last few weeks -- and one has to wonder whether that is due to 'production problems', or they can't get good delivery bars because they simply aren't available, or because the powers-that-be don't want to exacerbate an already very tight physical market."
I'll let you be the judge of which it is...because they're capable of producing many hundreds of thousands of these things every day -- and their reported sale on Monday was the first one in about three weeks.
There was some activity in gold over at the COMEX-approved depositories on the U.S. east coast on Thursday. They reported receiving 64,528 troy ounces -- and shipped out 9,645 troy ounces. The largest 'in' amount was the 64,237.698 troy ounces/1,998 kilobars [SGE kilobar weight] that was dropped off at Brink's, Inc. The remaining 290 troy ounces found a home over at Delaware. All of the 'out' activity...9,645.300 troy ounces/300 kilobars [SGE kilobar weight] departed Malca-Amit USA. There was a bit of paper activity, as 4,243.932 troy ounces/132 kilobars [SGE kilobar weight] was transferred from the Registered category and back into Eligible at Brink's, Inc. The link to this is here.
There was some activity in silver as well. There was only 27,011 troy ounces received -- and 692,823 troy ounces was shipped out.
In the 'in' category, most of it...22,039 troy ounces...ended up at CNT -- and the remaining 4,971 troy ounces/one COMEX contract, was dropped off at Delaware. In the 'out' department, virtually all of it, one truckload...611,617 troy ounces...was shipped out of CNT. Another 78,179 troy ounces left HSBC USA -- and the remaining 3,026 troy ounces departed Delaware. In the paper category, there was one truckload...600,300 troy ounces...that was transferred from the Registered category and back into Eligible over at Loomis International. The link to all this, is here.
It was pretty quiet over at the COMEX-approved gold kilobar depository in Hong Kong on their Thursday. They reported receiving 120 kilobars -- and shipped out 30 of them. Except for the 100 kilobars shipped out of Loomis International, the remaining in/out activity was at Brink's, Inc. as usual. The link to this, in troy ounces, is here.
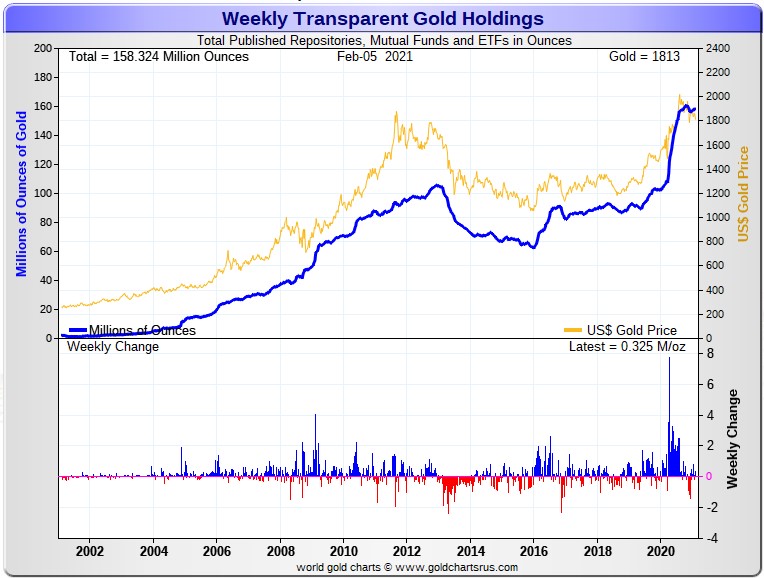
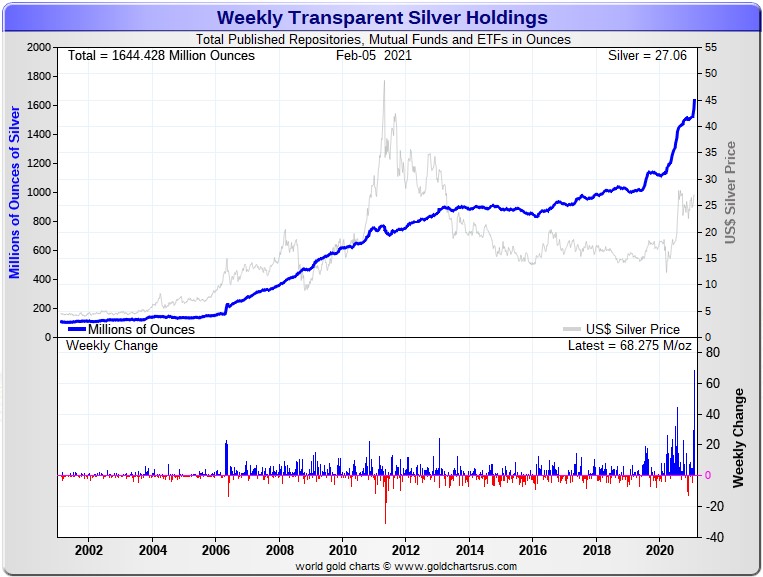
And, as is always the case in my Saturday column, here are Nick Laird's 20-year charts showing the physical gold and silver in all known depositories, ETFs and mutual funds as of the close of business on Friday.
For the week that was, there was a net 325,000 troy ounces of gold added -- and in silver there was an absolutely astronomical [net] 68,275,000 troy ounces deposited, the biggest 1-week add in history by an absolute country mile...mostly into SLV. Click to enlarge for both.
|
|
|
|
One could safely assume that just about every ounce added to most of these ETFs and mutual funds during this past reporting week came courtesy of JPMorgan's silver stash. The only thing now known, as Ted has been going on about since last March, is whether the silver is being leased to the authorized participants in question, or has it been sold to them outright?
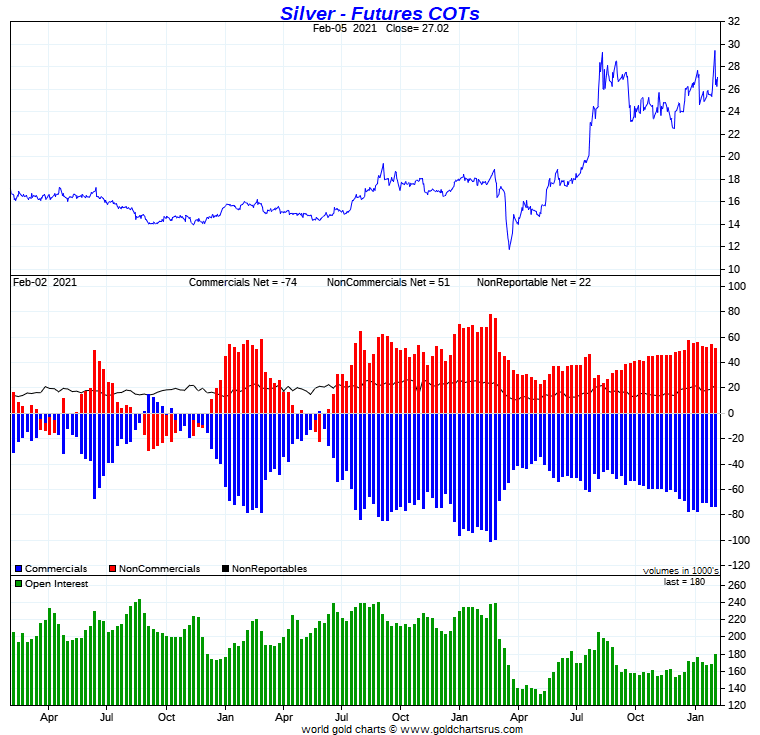
The Commitment of Traders Report, for positions held at the close of COMEX trading on Tuesday, February 2 was a surprise...and a very pleasant one. Yes, there was an increase in the Commercial net short position in silver, but it was barely a rounding error. And in gold, there was a decrease in the commercial net short position, but it was barely a rounding error as well. It was under the hood where the real changes were.
In silver, the Commercial net short position increased by an insignificant 442 contracts, or 2.2 million troy ounces...a big fat "nothingburger". Both Ted and I were bracing ourselves for a far, far bigger amount than that.
They arrived at that number by increasing their long position by 4,647 COMEX contracts, but also increased their short position by 5,089 contracts -- and it's the difference between those two numbers that represents their change for the reporting week.
It was under the hood where the big changes took place -- and the biggest surprise was that the Managed Money traders actually reduced their net long position by 4,360 contracts. Whereas the Other Reportables and Nonreportable/small traders increased their net long positions....the former group by 1,309 contracts -- and the latter by a fairly hefty 3,493 contracts.
Doing the math: 4,360 minus 1,309 minus 3,493 equals 442 COMEX contracts, the change in the Commercial net short position.
The Commercial net short position in silver now stands at 73,854 contracts, or 369.3 million troy ounces of the stuff...compared to the 367.1 million ounces last week. As you can see, very little change...just those 2.2 million ounces.
But the horror story was the Big 8 traders, as their short position this week increased to 422.5 million troy ounces, compared to the 387.8 million troy ounces they were short in last week's COT Report.
Ted said that it was the Big 4 traders that went short that amount, as the Big 5 through 8 traders didn't do a thing. I'll have all the details on this in the 'Days to Cover' commentary further down, which is definitely worth reading.
As of the Tuesday cut-off, the Big 8 traders were short a bit over 114 percent of the Commercial net short position...up 8 percentage points from last Friday's COT Report.
Looking at the Producer/Merchant category in yesterday's Disaggregated COT Report, Ted was of the opinion that JPMorgan went short a couple of thousand contracts during the reporting week, most likely on Friday and Monday. But he also pointed out that they most likely covered them during the engineered price decline on Thursday. So there's nothing to see here in the overall.
Here's the 3-year COT chart for silver from Nick Laird -- and although there's nothing to see on the chart, the changes out of sight were another matter. Click to enlarge.
|
|
As Ted pointed out on the phone yesterday -- and rightly so, the sole reason that silver isn't some rather large 3-digit number as I write this, is because the Big 4 banks went short whatever number of contracts necessary to cap the price spike in silver -- and then drive it lower. That's all there is, there ain't no more.
I will have lots more to say about the current state of the silver market in The Wrap section.
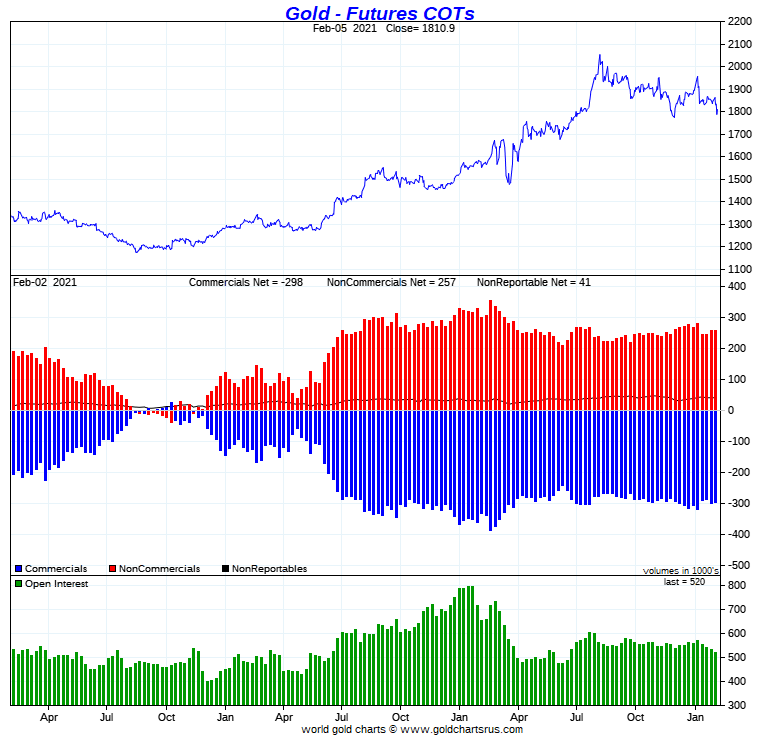
In gold, the commercial net short position decreased by paltry 991 contracts/991,000 troy ounces and, like in silver, barely a rounding error in the grand scheme of things.
They arrived at that number by reducing their long position by 4,758 contracts, but also decreased their short position by 5,749 contracts -- and it's the difference between those two numbers that represents their change for the reporting week.
Under the hood in the Disaggregated COT Report the Managed Money traders decreased their net long position as well, by 8,621 contracts...most likely due that big engineered price decline on Tuesday, the cut-off day. The traders in the Other Reportables category increased their net long position by a very hefty 8,201 contracts, while the Nonreportable/small traders reduced their net long position by a smallish 571 contracts.
Doing the math: 8,621 plus 571 minus 8,201 equals 991 COMEX contracts, the change in the commercial net short position...which it must do.
The commercial net short position in gold now sits at 29.80 million troy ounces, compared to 29.89 million troy ounces in last week's COT Report.
The Big 8 traders are short 25.22 million troy ounces in this week's COT Report, compared to the 25.77 million troy ounces they were short in last week's report...a rather insignificant decrease.
The Big 8 are short around 85.5 percent of the commercial net short position in gold. Not as obscene as the 114 percent they're short in silver, but still grotesque.
Ted and I didn't discuss what JPMorgan did in gold during the reporting week, but a glance at the Producer/Merchant category suggests they might have gone short maybe a thousand contracts at most. But, like in silver, they've most likely covered those since -- and may actually be net long the COMEX futures market in gold by an equally immaterial amount.
Here's Nick's 3-year COT chart for gold and, like for silver, there's not a lot to see. And also like silver, most of the changes that really mattered occurred out of sight in the Disaggregated COT Report. Click to enlarge as well.
|
|
Not much happened in the gold COT Report except to note that the Other Reportables increased their net long position by a very decent amount, while the Managed Money traders went in the opposite direction by an equally decent amount...the same as they did in silver.
But the standout features of yesterday's report were the very small positioning changes in the commercial categories, which were big positives...especially in silver. But head-and-shoulders above that was the monstrous jump in the short positions of the Big 4 traders in silver and, as I said further up, I'll have more in the 'Days to Cover' commentary a bit further down.
In the other metals, the Managed Money traders in palladium decreased their net long position by a very hefty 1,548 COMEX contracts during the last reporting week -- and are still net long the palladium market, but only by 1,135 COMEX contracts now...around 12 percent of the total open interest...down around 15 percentage points from last week. As you already know, the COMEX futures market in palladium continues to be a market in name only. In platinum, the Managed Money traders increased their net long position by a further 1,045 contracts during the reporting week -- and are now net long the platinum market by a very hefty 22,139 COMEX contracts...about 34 percent of total open interest -- unchanged for the last month now. In copper, the Managed Money traders decreased their net long position by a paltry 928 contracts -- and are net long copper to the tune of 77,208 COMEX contracts...about 1.93 billion pounds of the stuff -- and about 30 percent of total open interest...unchanged from last week.
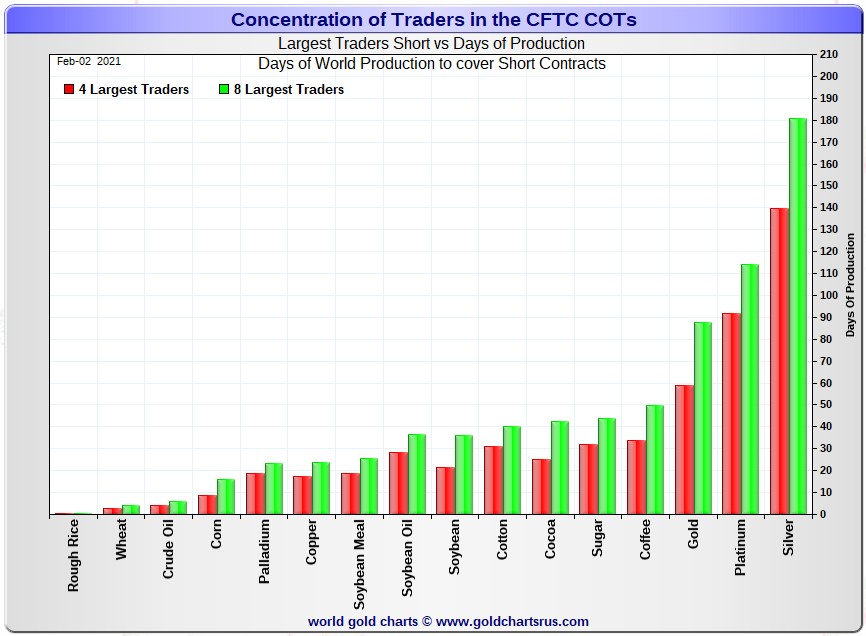
Here's Nick Laird's "Days to Cover" chart, updated with the COT data for positions held at the close of COMEX trading on Tuesday, February 2. It shows the days of world production that it would take to cover the short positions of the Big 4 - and Big '5 through 8' traders in each physically traded commodity on the COMEX. Click to enlarge.
|
|
The Big 4 traders are short about 140 days of world silver production, up about 15 days from the prior week's report. Wow! The '5 through 8' large traders are short an additional 41 days of world silver production...unchanged from the prior COT Report - for a total of about 181 days that the Big 8 are short...and obviously up about 15 days from the prior week's COT report! This represents six months of world silver production, or about 422 million troy ounces of paper silver held short by the Big 8. [In the prior reporting period -- the Big 8 were short 166 days of world silver production.]
Ted had it exactly right, it was the Big 4 shorts in silver that stopped the silver price explosion dead in its tracks.
In the COT Report above, the Commercial net short position in silver was reported by the CME Group at about 369 million troy ounces. As mentioned in the previous paragraph, the short position of the Big 8 traders is around 422 million troy ounces. So the short position of the Big 8 traders is larger than the total Commercial net short position by about 422-369=53 million troy ounces...up about 33 million troy ounces from the 20 million troy ounces in the prior week's report. That's a huge increase.
The reason for the difference in those numbers...as it always is...is that Ted's raptors, the 34-odd small commercial traders other than the Big 8, are net long that amount. In last week's report there were only 25 raptors on the long side, so a bunch more jumped in during this last reporting week and bought the long side of every contract that the Big 4 were selling.
Another way of stating this [as I say every week in this spot] is that if you remove the Big 8 shorts from the commercial category, the remaining traders in the commercial category are net long the COMEX silver market. It's the Big 8 against everyone else...a situation that has existed for almost five decades in both silver and gold -- and in platinum and palladium as well.
As per the first paragraph above, the Big 4 traders in silver are short around 140 days of world silver production in total. That's 35 days of world silver production each, on average...up 3.5 days from the January 26 COT Report. That's a lot. The four big traders in the '5 through 8' category are short 41 days of world silver production in total, which is 10 days and a bit of world silver production each, on average...which is unchanged from last week's report.
The Big 8 commercial traders are short 47.0 percent of the entire open interest in silver in the COMEX futures market, which is up a bit from the 46.2 percent they were short in last week's COT report. And once whatever market-neutral spread trades are subtracted out, that percentage would be a bit under the 55 percent mark. In gold, it's 48.5 percent of the total COMEX open interest that the Big 8 are short, which is up a bit from the 48.2 percent they were short in the prior week's COT Report -- and most likely a bit over 55 percent once their market-neutral spread trades are subtracted out.
In gold, the Big 4 are short 59 days of world gold production, up 2 days from last week's COT Report. The '5 through 8' are short another 29 days of world production, down 4 days from last week's report...for a total of 88 days of world gold production held short by the Big 8 -- and down 2 days from last Friday's COT Report. Based on these numbers, the Big 4 in gold hold about 67 percent of the total short position held by the Big 8...up about 4 percentage points from last week's report.
According to Ted, JPMorgan most likely added smallish short position in gold and silver during the reporting week, but have also covered them all since the Tuesday cut-off -- and are about market neutral in both from a COMEX perspective as of this writing.
The "concentrated short position within a concentrated short position" in silver, platinum and palladium held by the Big 4 commercial traders are about 77, 81 and 83 percent respectively of the short positions held by the Big 8...the red and green bars on the above chart. Silver is up about 2 percentage points from last week's COT Report...platinum also up about 2 percentage points from a week ago -- and palladium is up about 3 percentage points week-over-week.
What is glaringly obvious from the above increases -- and staring you right in the face is that the Big 4 traders were responsible for the capping of all four precious metals during the last reporting week.
The Big 8 shorts are still hugely exposed in all four precious metal in the COMEX futures market, particularly the Big 4...went further short silver in spectacular fashion during the reporting week -- and in the other three precious metals as well. The above chart tells you all you need to know about their plight.
This current situation regarding the Big 4/8 shorts continue to be beyond obscene and grotesque -- and as Ted correctly points out, its resolution will be the sole determinant of precious metal prices going forward.
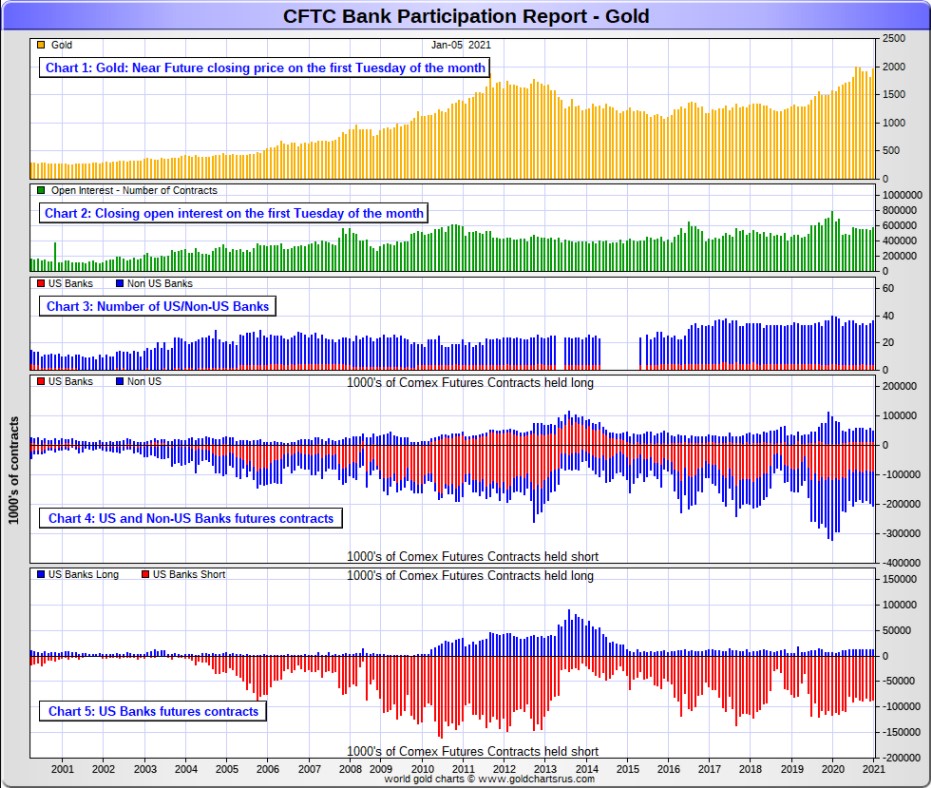
The February Bank Participation Report [BPR] data is extracted directly from yesterday's Commitment of Traders Report. It shows the number of futures contracts, both long and short, that are held by all the U.S. and non-U.S. banks as of Tuesday's cut-off in all COMEX-traded products. For this one day a month we get to see what the world's banks are up to in the precious metals -and they're usually up to quite a bit.
[The February Bank Participation Report covers the time period from January 6 to February 2 inclusive.]
In gold, 5 U.S. banks are net short 71,776 COMEX contracts in the February BPR. In January's Bank Participation Report [BPR] 4 U.S. banks were net short 75,790 contracts, so there was a smallish decrease of 4,000 COMEX contracts from four weeks ago, which is an immaterial change.
Citigroup, HSBC USA, Goldman Sachs and possibly Morgan Stanley would most likely be the U.S. banks that are short this amount of gold...however, one should presume that it's their clients that are short. I'm also starting to harbour some suspicions about the Exchange Stabilization Fund as well, although they are most likely just backstopping these banks -- and not actually short in the COMEX futures market themselves.
Also in gold, 30 non-U.S. banks are net short 75,092 COMEX gold contracts. In January's BPR, 32 non-U.S. banks were net short 81,732 COMEX contracts...so the month-over-month change shows a decrease of 6,640 COMEX contracts.
At the low back in the August 2018 BPR...these same non-U.S. banks held a net short position in gold of only 1,960 contacts -- and they've been back on the short side in a big way ever since.
I suspect that there's at least two large non-U.S. bank in this group, one of which would be Scotiabank/Scotia Capital...plus HSBC most likely. And I have my suspicions about Barclays, Dutch Bank ABN Amro, plus Australia's Macquarie as well. Other than that small handful, the short positions in gold held by the vast majority of non-U.S. banks are mostly immaterial and, like in silver, have always been so.
As of this Bank Participation Report, 35 banks [both U.S. and foreign] are net short 28.3 percent of the entire open interest in gold in the COMEX futures market, which is up a bit from the 27.7 percent that 36 banks were short in the January BPR.
Here's Nick's BPR chart for gold going back to 2000. Charts #4 and #5 are the key ones here. Note the blow-out in the short positions of the non-U.S. banks [the blue bars in chart #4] when Scotiabank's COMEX short position was outed by the CFTC in October of 2012. Click to enlarge.
|
|
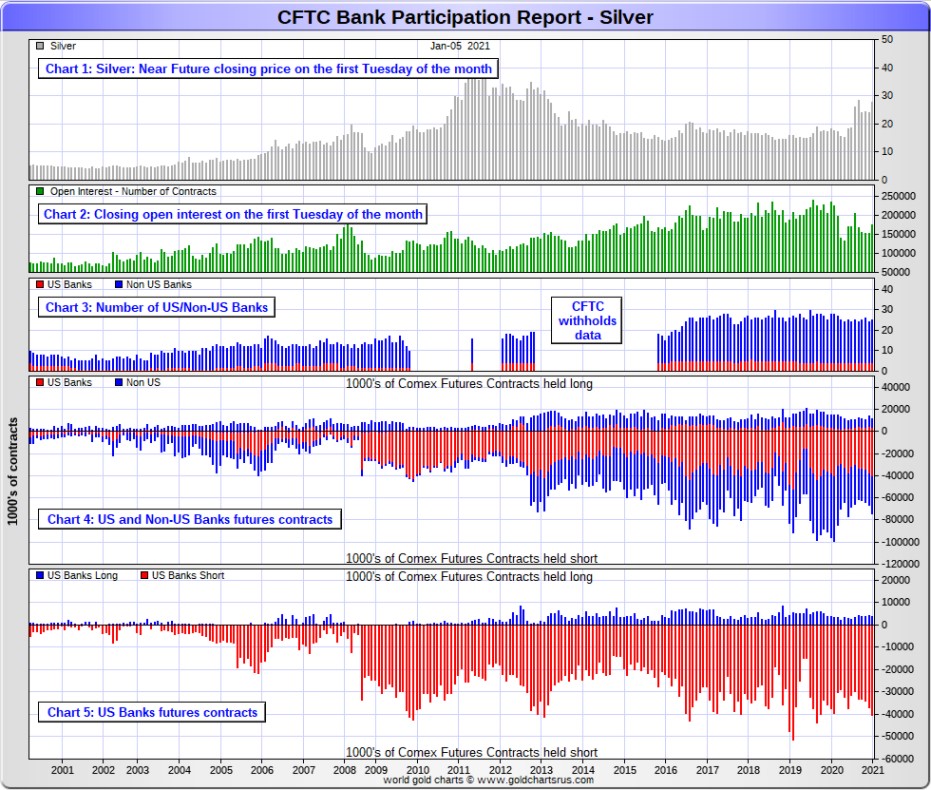
In silver, 4 U.S. banks are net short 38,722 COMEX contracts in February's BPR. In January's BPR, the net short position of these same 4 U.S. banks was 36,515 contracts, so the short position of the U.S. banks has increased by 2,207 contracts month-over-month. The short position of these U.S. banks in silver has been rising steadily since last August.
As in gold, the three biggest short holders in silver of the four U.S. banks in total, would be Citigroup, HSBC USA -- and Goldman or maybe Morgan Stanley in No. 3 and 4 spots. And, like in gold, I'm starting to have my suspicions about the Exchange Stabilization Fund's role in all this.
Also in silver, 22 non-U.S. banks are net short 24,548 COMEX contracts in the February BPR...which is down 2,460 contracts from the 27,008 contracts that 21 non-U.S. banks were short in the January BPR.
I would suspect that Canada's Scotiabank/Scotia Capital holds a goodly chunk of the short position of these non-U.S. banks. I also suspect that a number of the remaining 20 non-U.S. banks may actually be net long the COMEX futures market in silver. But even if they aren't, the remaining short positions divided up between these other 21 non-U.S. banks are immaterial - and have always been so.
As of February's Bank Participation Report, 26 banks [both U.S. and foreign] are net short 35.2 percent of the entire open interest in the COMEX futures market in silver-down a tiny bit from the 36.1 percent that 25 banks were net short in the January BPR. And much, much more than the lion's share of that is held by Citigroup, HSBC USA, Goldman, Scotiabank -- and maybe one other non-U.S. bank...all of which are members of the Big 8 shorts.
Here's the BPR chart for silver. Note in Chart #4 the blow-out in the non-U.S. bank short position [blue bars] in October of 2012 when Scotiabank was brought in from the cold. Also note August 2008 when JPMorgan took over the silver short position of Bear Stearns-the red bars. It's very noticeable in Chart #4-and really stands out like the proverbial sore thumb it is in chart #5. Click to enlarge.
|
|
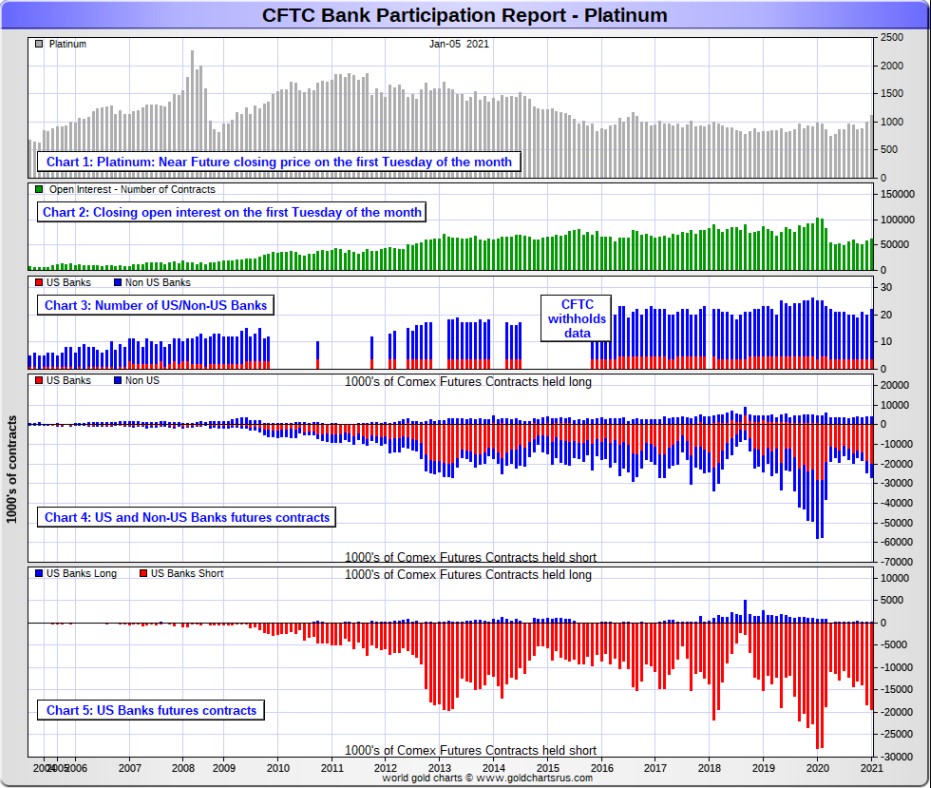
In platinum, 4 U.S. banks are net short 19,867 COMEX contracts in the February Bank Participation Report, which is virtually unchanged from the 19,204 COMEX contracts that these same banks were short in the January BPR.
[At the 'low' back in July of 2018, these U.S. banks were actually net long the platinum market by 2,573 contracts]
Also in platinum, 17 non-U.S. banks are net short 3,459 COMEX contracts in the January BPR, which is also unchanged from the 3,475 COMEX contracts that 18 non-U.S. banks were net short in the January BPR. Nothing to see here.
[Note: Back at the July 2018 low, these same non-U.S. banks were net short 1,192 COMEX contracts.]
And as of January's Bank Participation Report, 21 banks [both U.S. and foreign] are net short 36.1 percent of platinum's total open interest in the COMEX futures market, which is down a bit from the 37.1 percent that 22 banks were net short in January's BPR. But it's the U.S. banks, or most likely their clients, that are on the short hook big time. They have little chance of delivering into their short positions, although a very large number of platinum contracts have already been delivered during the last four or five months. But that fact, like in both silver and gold, has made no difference whatsoever to their short positions held. Their short position in the COMEX futures market in this precious metal is equally as dire as it is in silver and gold.
Here's the Bank Participation Report chart for platinum. Click to enlarge.
|
|
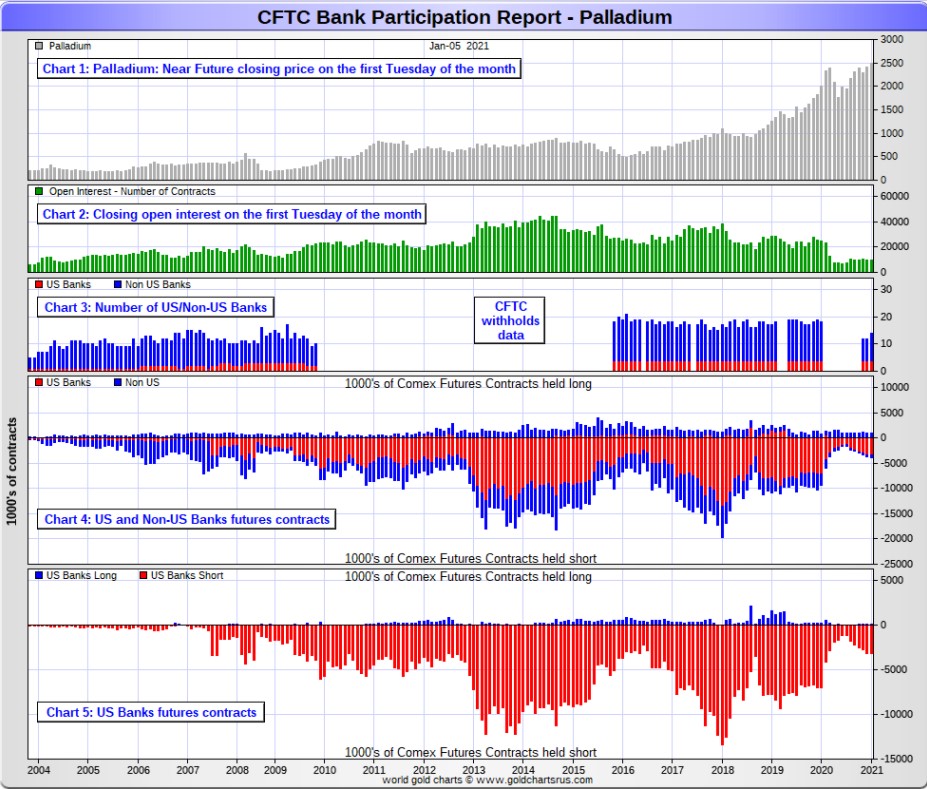
In palladium, 4 U.S. banks are net short 2,522 COMEX contracts in the February BPR, down a bit from the 3,153 contracts that these same U.S. banks were net short in the January BPR.
They were short only 1,194 COMEX contract in the July 2020 BPR.
Also in palladium, 10 non-U.S. banks are net long 688 COMEX contracts-up 489 contracts from the 199 COMEX contracts that these same 10 non-U.S. banks were net long in the January BPR.
And as I've been commenting for almost forever now, the COMEX futures market in palladium is a market in name only, because it's so illiquid and thinly-traded. Total open interest at Tuesday's cut-off was only 9,533 contracts...compared to 64,701 contracts of open interest in platinum...179,786 in silver -- and 520,011 contracts in gold.
As of this Bank Participation Report, 14 banks [both U.S. and foreign] are net short 19.2 percent of the entire COMEX open interest in palladium...down from the 30.5 percent of total open interest that these same 14 banks were net short in January.
And because of the small numbers of contracts involved, along with a tiny open interest, these numbers are pretty much meaningless. So, for the eleventh month in a row, the world's banks are no longer involved in the palladium market in a material way -- and if they are, I suspect that it's their clients that are on the hook, not the banks themselves. According to Ted, palladium is mostly a cash market now.
Here's the palladium BPR chart. And as I point out every month, you should note that the U.S. banks were almost nowhere to be seen in the COMEX futures market in this precious metal until the middle of 2007-and they became the predominant and controlling factor by the end of Q1 of 2013. They have imploded into insignificance over the last nine or so Bank Participation Reports, although their short position has been sneaking higher for five of the last six months. It remains to be seen if they return as big short sellers again at some point like they've done in the past. Click to enlarge.
|
|
Except for palladium, only a small handful of the world's banks continue to have meaningful short positions in the other three precious metals -- and in some cases, one would think that it's their clients that are on the short hook, not the banks themselves.
The short or long positions in silver and gold that JPMorgan may or may not hold, are immaterial -- and have been since last March. It's the next Big 8 shorts that are on the hook in everything precious metals-related -- and they've been sticking their respective heads further into the lion's mouth since the price tops of early August...especially silver -- and especially this past week.
But as has been the case for over a year now, the short positions held by the Big 8 traders/banks is the only thing that matters -- and how it is ultimately resolved [as I said earlier] will be the sole determinant of precious metal prices going forward.
I don't have all that many stories, articles or videos for you today...thankfully.
CRITICAL READS
U.S. trade deficit rises to 12-year high -- $679 billion
The U.S. trade deficit rose 17.7% last year to $679 billion, highest since 2008, as the coronavirus disrupted global commerce and confounded President Donald Trump's attempts to rebalance America's trade with the rest of the world.
The gap between the value of the goods and services the United States sells abroad and what it buys climbed from $577 billion in 2019, the Commerce Department said Friday. Exports skidded 15.7% to $2.1 trillion, and imports fell 9.5% to $2.8 trillion.
As president, Trump sought to narrow the gap by imposing taxes on imported goods on a scale unseen since the trade wars of the 1930s. The deficit narrowed slightly in 2019 but then ballooned last year as coronavirus restrictions hammered U.S. exports of services such as tourism and education. Services exports dropped 20.4% last year.
Still, the U.S. ran a $237 billion surplus last year in services. But that was overwhelmed by a $916 billion deficit in trade in goods such as aircraft and auto parts.
This AP story from 5:58 p.m. EST on Friday morning was picked up by the news.yahoo.com Internet site -- and another link to it is here.
January Payrolls Miss: Only 49,000 Jobs Added as Unemployment Rate Tumbles to 6.3%
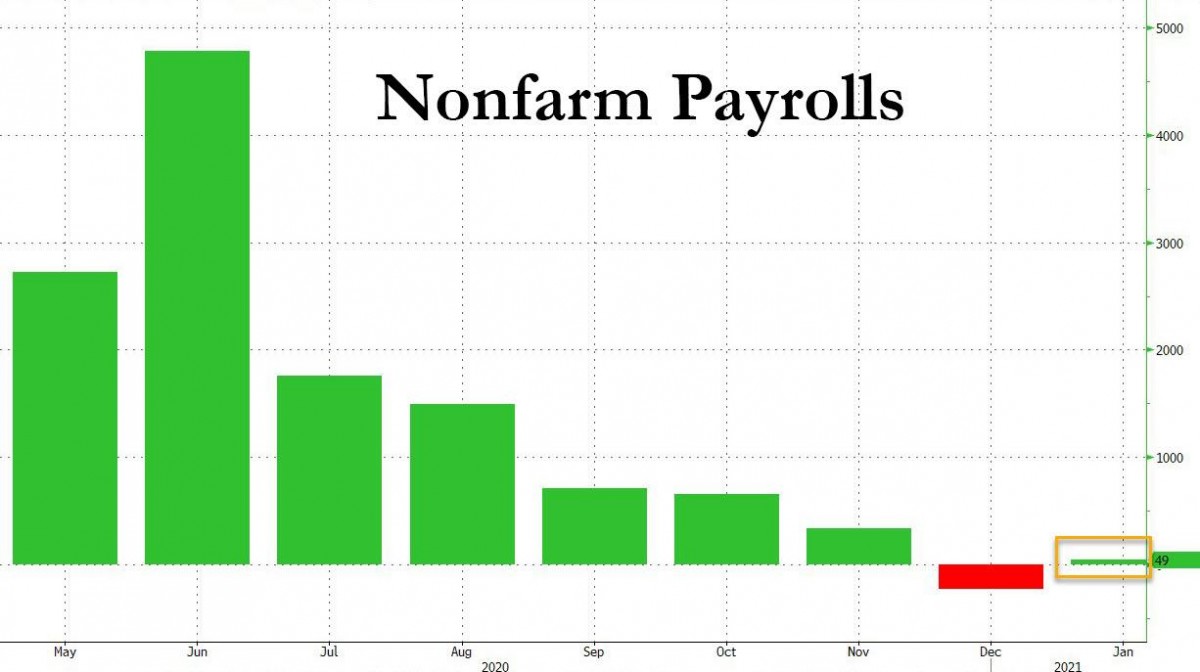
Following last month's dismal unemployment print, which saw the first contraction since April in December payrolls, expectations were high for a solid rebound in January - maybe too solid - and unfortunately while jobs did grow in January, the final number of +49,000 came in well below the 105K consensus estimate, if up solidly from December's downward revised -227K, with revisions subtracting a total of 159K jobs from the past two months. Click to enlarge.
|
|
The change in total non-farm payroll employment for November was revised down by 72,000, from +336,000 to +264,000, and the change for December was revised down by 87,000, from -140,000 to -227,000. With these revisions, employment in November and December combined was 159,000 lower than previously reported.
Looking below the surface, private payrolls, which exclude government jobs, rose by just 6,000 in January, a far cry from the 163K expected, while government jobs rose by 43,000 in the month, led by gains in state and local government education.
As expected, and as was the case in December, job losses were concentrated in leisure and hospitality and retail trade. Service jobs - including those in travel and at restaurants - are unlikely to see meaningful gains until more Americans are vaccinated and Covid-19 infections see a meaningful decline.
This somewhat longish and chart-filled commentary put in an appearance on the Zero Hedge website at 8:33 a.m. EST on Friday morning -- and I thank Brad Robertson for sending it along. Another link to it is here. Swedish reader Patrik Ekdahl sent me a CNBC story about this headlined "Payrolls barely grow to start 2021 even as the unemployment rate fell to 6.3%" -- and that's linked here.
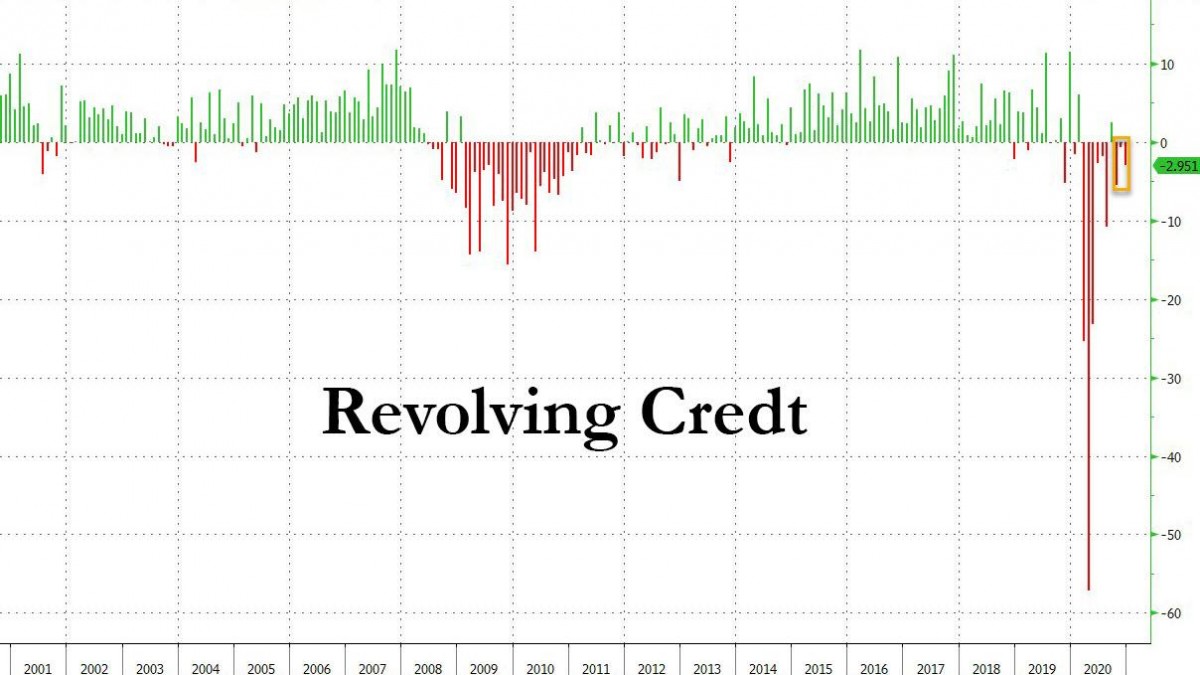
There appears to be a major discrepancy between BofA's in house debit/credit card data, which showed a remarkable increase in spending at the end of the year (despite covid) ... and the Fed's own consumer credit data aggregation, because according to the latest Consumer Credit (G.19) report, in December revolving debt, i.e., credit card debt, shrank for a third consecutive month declining by $3BM following a $653MM drop in November and a $5.5 billion drop in October. Click to enlarge.
|
|
This means that in 2020, U.S. consumers have paid down a record $118.3Bn in credit card debt, a staggering amount for an economy that runs on credit.
The flip side, however, is that as revolving credit dropped, non-revolving credit rose, and in November U.S. consumers increased their student and auto loans - the two largest component of this category - by $12.8 billion, bringing the total December change to $9.73 billion, which due to the sharp drop in credit card balances was far below the $12BN increase expected by economists.
Meanwhile, and there was no surprise here, the total dollar amount of both student and auto loans hit a new all time high in the 4th quarter of 2020, with the former rising by $2.5BN to a new all time high of $1.707TN and the latter rose $9BN to $1.228TN.
This means that even as Americans turned thrifty on their credit cards, they went to town on loans made where either the Federal Government has some implicit backstop, such as student loans which will likely be discharged in part or in whole by the Biden admin, or where they used the cash to buy cars, which is also understandable when one can take out a loan which maturity is well beyond the viable life of the actual (used) car being purchased. The implication in both is that nobody - neither the lender nor the borrower - expects that the loan will ever be repaid, something which can't be said about credit card debt (at least for now).
This 3-chart Zero Hedge news item showed up on their Internet site at 3:13 p.m. on Friday afternoon EST -- and another link to it is here. Gregory Mannarino's post market close rant for Friday is linked here. His commentary is rated 'General Admission' today -- and I thank Brad Robertson for sending it.
A massive infrastructure has evolved to ensure it is both easy and perfectly rational to throw "money" at inflating markets. Most of all, the Fed continues to devalue savings while backstopping the securities and derivatives markets, creating a deleterious incentive structure promoting speculation and market Bubbles. Especially after last year's unprecedented monetary inflation, this mechanism exacerbates inequality while placing tens of millions of unwitting market speculators at major risk.
"If they lose money, that's on them." That may be okay for a group of market players. It's fine for the professional speculator community. But it is definitely not okay when market speculation has grown to become a major societal issue, especially with our social fabric already frayed and frail.
I believed at the time it was immoral for Bernanke to have slashed savings rates to zero and forced savers into the securities markets. More than a decade of inflationism - along with the Fed monkeying with the markets - has so distorted incentives and risk perceptions that it is impossible for the public to accurately assess market risk. When they lose serious money, it will be on the Fed.
The thought of the anger, animosity and vengeance that will be unleashed when the Bubble bursts is deeply troubling. The backlash will be momentous. A sweeping regulatory crackdown is inevitable. It will take years - or, more likely, decades - for trust to return. Wall Street and the Fed will be the main villains, while already fragile confidence in our government will be badly shaken. Capitalism will be in jeopardy.
It remains a challenge to communicate the deleterious effects of inflationism and unsound money. We're in a period of monetary hyperinflation, yet there are no wheelbarrows or spiraling prices for bread and foodstuffs. Savings of lifetimes have not been wiped out.
The contemporary system of digitalized "money" and Credit, where central banks inject monetary inflation directly into the securities markets, has unique inflationary manifestations. It's virtually miraculous superficially, with surging prices for stocks, bonds, real estate, private businesses and asset prices more generally. Wealth seemingly expands by the week. Yet Monetary Disorder is taking an increasingly heavy toll on financial, economic, social and political stability. Insecurities, inequities, animosities, distrust and anger fester.
It has the feel of global markets having entered a period of acute instability. Equities have turned wildly volatile, while bonds are increasingly vulnerable. Currencies are unstable as well, as traders try to discern if there's more to go in the dollar squeeze or if the bear market rally is about to give way. And how crazy could things get in the physical commodities if squeeze dynamics really take hold?
This worthwhile commentary from Doug appeared on his website in the very early hours of Saturday morning EST -- and another link to it is here.
Biden withdraws Judy Shelton's nomination as Fed board member
U.S. President Joe Biden on Thursday withdrew from consideration Donald Trump's contentious nomination of Judy Shelton to fill a vacant seat at the Federal Reserve.
Trump had hoped to secure Shelton's confirmation before leaving office, but her nomination stalled after the Republican-controlled Senate failed to muster the required votes to move her nomination ahead in the confirmation process.
Trump had re-nominated Shelton and over 30 other individuals for key judgeships and other posts in early January.
Shelton's nomination ran into trouble in November after a couple of Republicans joined Democrats in opposing the former Trump economic adviser out of concern that her perceived partisanship could imperil the Fed's independence.
In addition, two other Republicans had to skip the vote because they were quarantining due to the coronavirus.
Shelton had come under fire for inconsistent, controversial views, including an embrace of the gold standard and a shifting stance on interest rates as control of the White House passed from Democrat Barack Obama to Trump.
I saw this story on Thursday -- and would have posted it in Friday's column, but it skipped my mind. Here's a Reuters article on this from Thursday afternoon EST -- and I found it in a GATA dispatch. Another link to it is here.
Silver Supply Crisis -- Willem Middelkoop
Interviewed today by Daniela Cambone of Stansberry Research, "The Big Reset" author and Dutch commodity fund manager Willem Middelkoop says that physical demand for palladium broke the suppression of the metal's price by derivatives and he expects the same to happen with silver.
Middelkoop speculates that gold will be incorporated into the Special Drawing Rights currency maintained by the International Monetary Fund and that the metal may become the bedrock of a new world financial system.
Well, dear reader, I've had the time to watch the first twelve minute of this -- and 99 percent of everything he has to say is right on the money. I know Willem personally -- and he's as straight as an arrow. The interview is 27 minutes long -- and was posted on the youtube.com Internet site on Friday sometime -- and it's definitely worth watching. I found it on the gata.org Internet site -- and another link to it is here.
The PHOTOS and the FUNNIES
The first photo is the last one that I took at the Osoyoos Desert Centre on May 24. The entire south Okanagan used to be covered in this sort of desert foliage until the land was cleared for and irrigated for fruit orchards -- and now vineyards. The area is home to rattlesnakes, scorpions and black widow spiders...although I have yet to see any of them. This small park was meant to preserve what little is left of this quickly-disappearing natural habitat. While in this park, I took these three shots of nesting western bluebirds -- and this is the male of the species. The first two photos are backlit...a shooting scenario I never like, unless doing it for special effects purposes. I normally wouldn't keep a shot like the fourth photo...but it was the only one of the three where it was lit properly. And since I have precious few pictures of this bird this close up, I kept it. Click to enlarge.
|
|
|
|
|
|
|
|
|
|
|
|
|
|
The WRAP
"There are decades where nothing happens; and then there are weeks where decades happen." -- Vladimir Ilyich Lenin
Today's pop 'blast from the past' dates from 5 October 1973...two days after my 25th birthday...almost 48 years ago. How is that possible? The artist and the ballad are instantly recognizable -- and the link is here.
And in tribute to a great Canadian screen actor that passed from our sight this week, I salute Christopher Plumber with this scene from the 1965 classic film...The Sound of Music -- and it's linked here.
Today's classical 'blast from the past' is a Mozart composition which I've never posted before...mainly because it's not my favourite -- and after fifty years of involvement in the classical music scene, I'm somewhat tired of it as well. But, having said that, it's a wonderful work.
It's his famous "Eine kleine Nachtmusik" for strings in G major, K. 525...which he composed in 1787. The work is written for an ensemble of 2 violins, viola, cello and double bass, but is often performed by string orchestras.
The work was not published until about 1827, long after Mozart's death. It was sold to a publisher in 1799 by Mozart's widow Constanze, as part of a large bundle of her husband's compositions.
This performance of the work was at the Concertgebouw in Amsterdam back in April 2013 -- and the link is here.
I was certainly happy to see precious metals close higher on Friday. They all took off when the jobs report was released at 8:30 a.m. in New York, despite the efforts of the Big 8 shorts to keep their respective prices under wraps before that, as they were fighting a declining U.S. dollar index as well.
Despite the decent rallies, the volumes in both silver and gold weren't particularly high...especially in silver -- and I'm of the opinion...based on the total changes in open interest in both on Friday...that there may have been some quiet short covering going on yesterday.
That won't be confirmed until next Friday's COT Report -- and there are still two more trading days left before Tuesday's cut-off, which is a lifetime away in these volatile markets.
Gold's gains yesterday took it nowhere near any moving average that matters -- and silver is still nicely above all its moving averages that matter...the 50, 100 and 200-day.
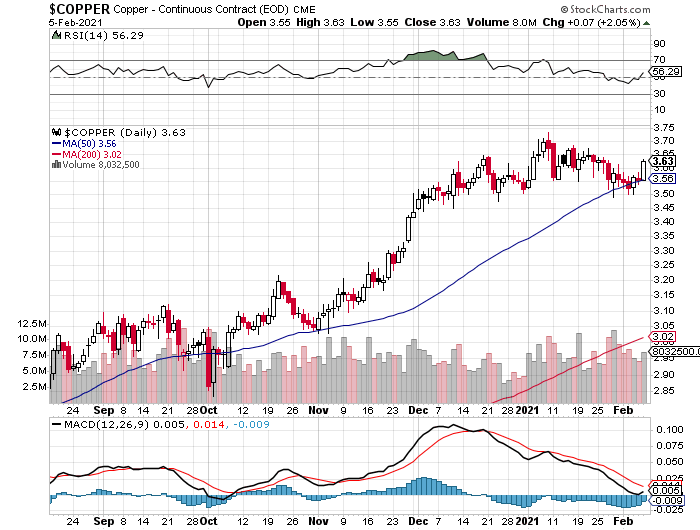
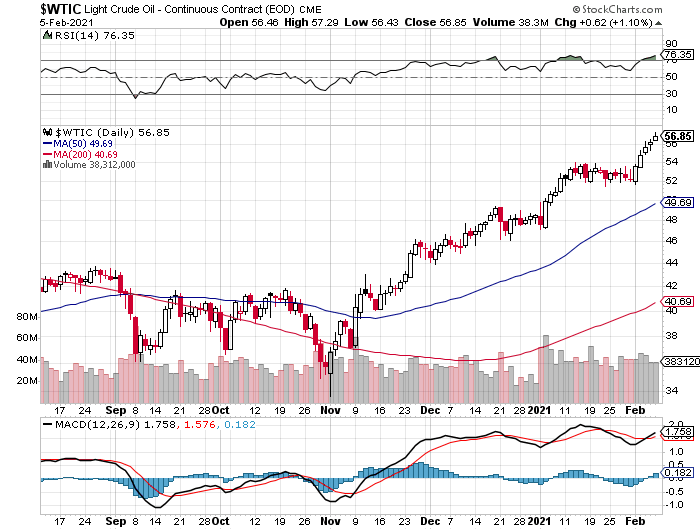
Platinum and palladium both had nice gains, but that also didn't undo the damage they suffered during the engineered price declines earlier this week. Copper certainly caught a bid, closing higher by 7 cents, which is a big one-day move for it. And outrageously overprice WTIC continued to tick higher, closing up another 62 cents a barrel on Friday.
Here are the 6-month charts for the Big 6 commodities, courtesy of stockcharts.com as always -- and you can see all these mentioned changes for yourself. Click to enlarge.
|
|
|
|
|
|
|
|
|
|
|
|
But the big story all this week continues to be the fact that all eyes are now focused firmly on the silver market. The Big 8 shorts et al., as I said in Tuesday's column, were caught totally flat-footed by this sudden attack by the Robinhood/Reddit horde -- and they were at battle stations for several days before they finally got the fire put out, at least put out in the public domain where most can see it.
But the fire still rages on below decks. As I said earlier this week, the silver Rubicon has been metaphorically crossed -- and the dire peril of the Big 8 shorts...the Big 4 in particular...is now exposed, as the Internet was alive with stories about it, the best of which was Ted Butler's interview earlier this week headlined "Crushing the Silver Short Position" -- and linked here in case you missed it.
Both in the physical market -- and in the COMEX futures market, is where the crisis is most acute -- and most obvious. The price spread differentials in silver are now paper-thin -- and as Ted pointed out on the phone yesterday, there is even slight backwardation in the July/September period by a tiny amount...a sure sign of mounting stress. There was backwardation in the earlier months at the beginning of the week, which 'da boyz' were able to neutralize, but it has now reappeared elsewhere.
As the quote in my Tuesday column stated..."Things are now in motion..." said Gandalf the White to Théoden, King and Lord of the Mark of Rohan..."that cannot be undone." That is certainly the case in the precious metals world in general -- and silver in particular.
Willem Middelkoop, in the interview posted in the Critical Reads section above, spells out the likely end-game scenario chapter and verse as well as anyone. A price explosion in silver will most certainly bring an end to the price management scheme not only in it, but also simultaneously in the other three precious metals as well.
As I stated in last Saturday's column..."the stakes are incalculable -- and that's an understatement if there ever was one."
The price management scheme in the precious metals in particular -- and all commodities in general, began about two years after Nixon ended "temporarily" the convertibility of the U.S. dollar for gold back in August of 1971...fifty years ago this year.
And as now Sir Peter Warburton stated in his classic essay headlined "The debasement of world currency: It's inflation, but not as we know it" back in April 2001...now 20 years ago.
"What we see at present is a battle between the central banks and the collapse of the financial system fought on two fronts. On one front, the central banks preside over the creation of additional liquidity for the financial system in order to hold back the tide of debt defaults that would otherwise occur. On the other, they incite investment banks and other willing parties to bet against a rise in the prices of gold, oil, base metals, soft commodities or anything else that might be deemed an indicator of inherent value. Their objective is to deprive the independent observer of any reliable benchmark against which to measure the eroding value, not only of the U.S. dollar, but of all fiat currencies. Equally, they seek to deny the investor the opportunity to hedge against the fragility of the financial system by switching into a freely traded market for non-financial assets.
It is important to recognize that the central banks have found the battle on the second front much easier to fight than the first. Last November I estimated the size of the gross stock of global debt instruments at $90 trillion for mid-2000. How much capital would it take to control the combined gold, oil, and commodity markets? Probably, no more than $200 billion, using derivatives. Moreover, it is not necessary for the central banks to fight the battle themselves, although central bank gold sales and gold leasing have certainly contributed to the cause. Most of the world's large investment banks have over-traded their capital [bases] so flagrantly that if the central banks were to lose the fight on the first front, then the stock of the investment banks would be worthless. Because their fate is intertwined with that of the central banks, investment banks are willing participants in the battle against rising gold, oil, and commodity prices."
Unknowingly -- and not only to them, but the rest of the world as well, the Robinhood/Reddit crowd has ripped the mask off this whole sordid affair outlined by Warburton above. But the international banking and financial syndicate is more than aware of it -- and they are at battle stations. And as Middelkoop pointed out so succinctly in the aforesaid mentioned interview..."it's very, very risky for the financial system as a whole...and a real crisis within the international monetary system, as the dollar system would be at risk..."
He doesn't know how right is about that, as the stakes could not be higher -- and at all costs the price of silver had to be brought under control earlier this week. The Big 4 shorts were there to do what was necessary.
It's this Gordian knot that the powers-that-be in the banking system and at the Treasury and the Fed are attempting to unravel now.
It took them fifty years to make this bed that they find themselves laying in this week -- and now they have to sleep in it.
All we can do is watch and wait as this silver noose gets ever tighter around their necks.
How did it come to this?
See on Tuesday.
Ed


