The U.S. silver supply will likely be in jeopardy in the future when the highly inflated paper markets finally crack. This is not a matter of if, but WHEN. If we consider the top two precious metals and copper, silver has the highest net import reliance as a percentage of domestic consumption.
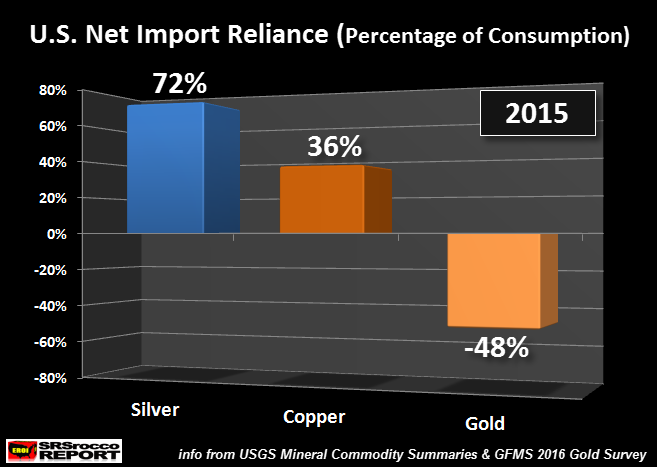
According to the data put out by the USGS – U.S. Geological Survey, and the GFMS team at Thomson Reuters, the United States silver net import reliance as a percentage of total consumption, was 72%, versus 36% for copper and a negative 48% for gold:

The USGS reported that of the apparent 8,100 metric tons (260 million oz) of total silver consumption in 2015, the United States relied on 6,156 metric tons (198 million oz) of foreign silver imports to meet total demand. As we can see this was nearly the opposite percentage for copper. The United States only relied upon 36% of copper imports to meet its total copper consumption in 2015.
Now, for gold… it’s a much different story. The USGS did not provide any net import reliance percentages of total consumption for gold due to the following footnote in their 2016 Gold Commodity Summary:
The United States has been a net exporter; however, large unreported investor stock changes preclude calculation of a meaningful net import reliance.
Taking this into consideration, I came up with my estimate of U.S. gold net import reliance as a percentage of consumption. While it is difficult to estimate “Investor gold flows” in and out of the United States, I focused on total demand versus total supply. I used the data from GFMS 2016 Gold Survey and the World Gold Council 2015 Full Year Demand Trends Report.
Yes, I realize these figures may be corrupted, manipulated or inaccurate, but it is the best we can go by to get a BALL PARK figure.
NOTE: Different official reporting sources post figures in metric tons and ounces. Here is the conversion for metric tons (1 metric ton = 32,150 troy ounces).
In 2015, the United States produced 216 metric tons (mt) of gold and had additional scrap supply of 70 mt to equal 286 mt. According to the World Gold Council, total U.S. gold demand in 2015 was 193 mt. Thus, the United States had an extra 93 mt of gold above and beyond its “supposed” consumption. If we divide the surplus 93 mt into total consumption of 193, it equals 48%.
This allowed the United States to export that extra gold to Eastern countries. Why? Because, most Americans believe gold is a “Barbarous Relic”, due to the brainwashing by the Einsteins at CNBC, Bloomberg and Fox Business.
The U.S. Silver Net Import Reliance Has Surged Since 1999
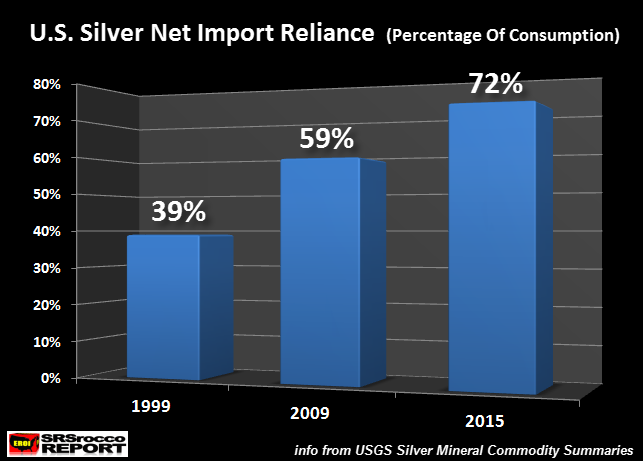
In 1999, the United States only relied upon 39% of its total silver demand from foreign import sources. According to the USGS figures, the U.S. relied upon 2,145 mt (69 million oz) of foreign silver imports to meet its total demand of 5,500 mt (177 million oz) in 1999.
However, as time went by, U.S. silver import reliance as a percentage of total consumption increased to a record high of 72% in 2015:

Since 1999, the United States silver net import reliance has increased from 2,145 mt (69 million oz) to 6,156 mt (198 million oz) in 2015. Now, a majority of that increase is due to AMERICANS BUYING lots of physical silver investment.
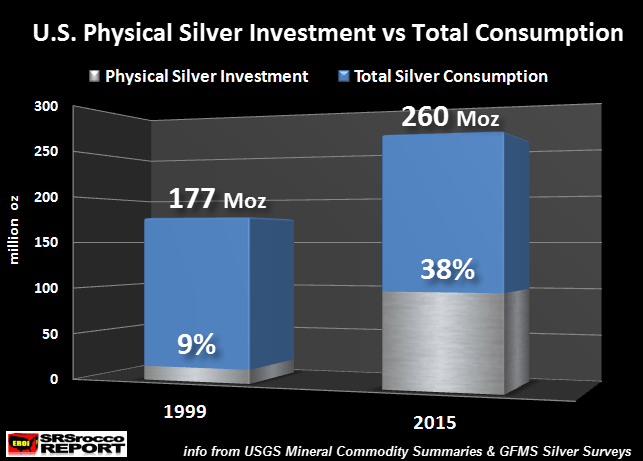
This chart below says it all. In 1999, total U.S. physical silver investment (my estimation including GFMS 10.7 Moz of Official Silver Coin sales) was 15 million oz (Moz) versus total demand of 177 Moz. However, Americans purchased a record 100 Moz of physical silver investment in 2015 versus 260 Moz of total demand (GFMS 2016 World Silver Survey):

Thus, U.S. physical silver investment surged from only 9% of total domestic demand in 1999 to 38% in 2015. As we can see, the BLUE area in the chart above stayed about the same, while the SILVER area increased significantly. Matter-a-fact, if we subtract physical silver investment from total demand during these two periods, this would be the result:
1999 Total Silver Demand – Physical Silver Investment = 162 Moz
2015 Total Silver Demand – Physical Silver Investment = 160 Moz
Basically, the big increase in total U.S. silver demand has come from the surge in American physical silver investment since 1999.
That being said, U.S. silver net import reliance surged even move than the increase in American physical silver investment demand in this sixteen year time period due to falling mine and scrap supply. For example, the U.S. produced 1,600 mt (51 Moz) of silver in 1999, versus 1,100 mt (35 Moz) in 2015.
One more very interesting data point. According to GFMS, Americans purchased 2.3 Moz of physical gold investment versus 100 Moz of physical silver investment in 2015. Thus, for every once of physical gold Americans invested in 2015, they purchased 43 oz of silver.
The data and figures shown above presents a serious situation for Americans who want to invest in silver when the highly inflated paper markets crack…. and crack they will. Today, we are watching the gold and silver price surge higher while the Dow Jones Index falls 150 points from its CLIFF upon the MOUNTAIN OF DEBT that it rests.
I have to tell you all, this will get very ugly when the markets finally succumb to the forces of gravity and the true fundamental financial laws… which we haven’t followed for quite some time. And yes, keep an eye on the ENERGY MARKETS.
Even though the DRILLING RIG GERBILS are running faster to produce more oil in the United States currenty, this is not sustainable over the long haul. Unfortunately, there is a lot of LOUSY ENERGY ANALYSIS in the media which is misleading investors to believe the earth has a CREAMY NOUGAT CENTER of oil…. for the taking. Thanks to James Howard Kunstler for that wonderful definition of abiotic oil.
I will be providing articles and reports in the future showing why DEEP ABIOTIC OIL is a RED HERRING and will not save us from the oil collapse heading our way.
Lastly, if you haven’t checked out my newest guest post, Dow Companies Report Worst Revenues since 2010, Dow Rises to 20,000 (LOL?), I highly recommend it.
Check back for new articles and updates at the SRSrocco Report.


