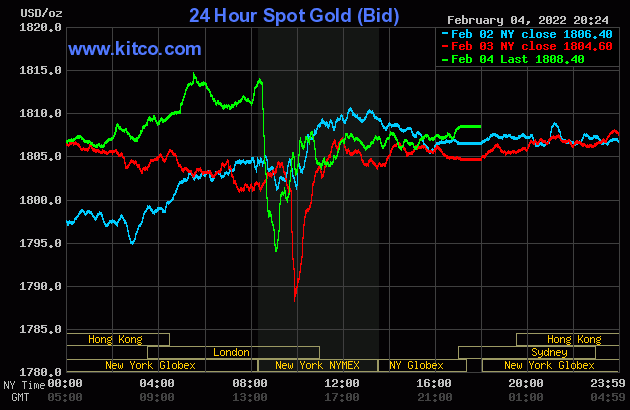
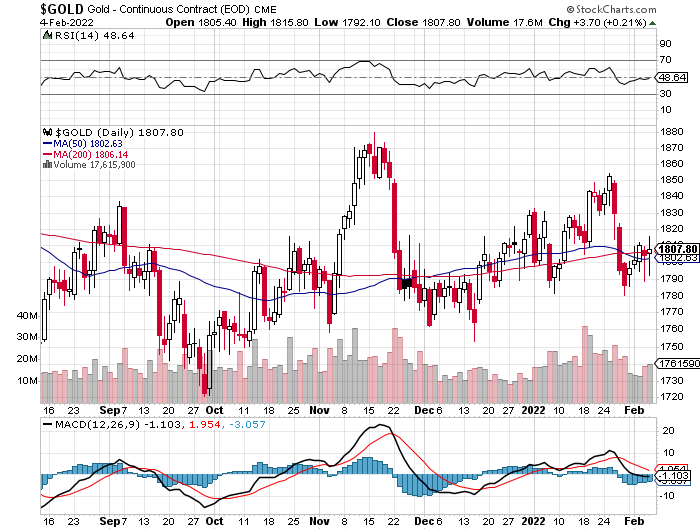
The gold price began to creep/wander very quietly higher once trading commenced at 6:00 p.m. EST on Thursday evening in New York -- and the rally developed more 'legs' once London opened. That all ended at the 10:30 a.m. GMT morning gold fix -- and from that juncture it had a quiet down/up move until the jobs report hit the tape at 8:30 a.m. in New York. The commercial traders of whatever stripe put in an appearance -- and the low tick was set a minute or so after 9 a.m. EST. It chopped quietly higher for the next thirty minutes, before getting capped -- and from the point it wandered quietly sideways until the market close at 5:00 p.m.
The high and low ticks in gold were recorded by the CME Group as $1,815.80 and $1,792.10 in the April contract. The April/June price spread differential in gold at the close yesterday was $3.00...June/August was $3.20 -- and August/October was $4.00 an ounce.
Gold was closed in New York on Friday afternoon at $1,808.40 spot, up $3.80 on the day. Net volume, which had been fumes & vapours until 8:30 a.m., was a bit on the heavier side at 163,000 contracts -- and there was a bit under 15,500 contracts worth of roll-over/switch volume on top of that.
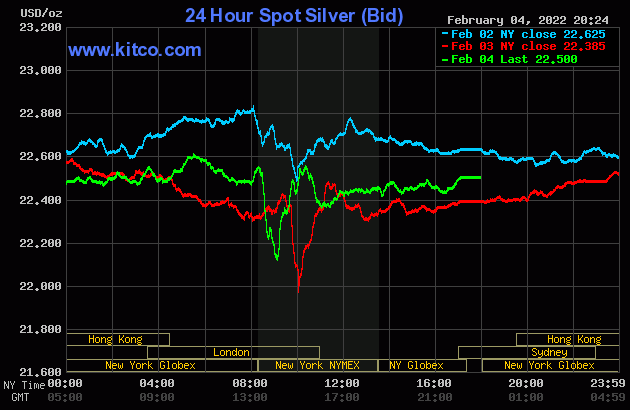
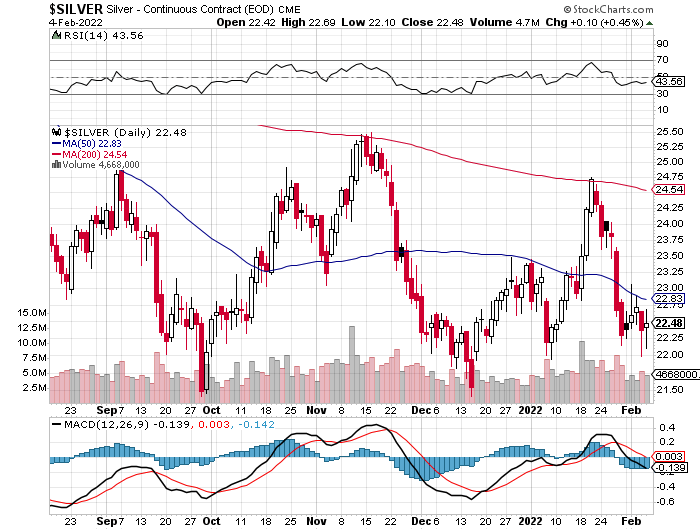
The silver price crept higher until the 10:30 a.m. morning gold fix in London -- and its price path from there was pretty the same as gold's up until its New York high tick, which came a few minutes after 10 a.m. EST. It was sold lower until the 11 a.m. EST London close -- and then crept very quietly higher until trading ended at 5:00 p.m.
The high and low ticks in silver were set at the same time as gold's -- and were recorded as $22.69 and $22.10 in the March contract. The March/May price spread differential in silver at the close yesterday was 4.2 cents...May/July was 4.7 -- and July/September was 5.7 cents an ounce.
Silver was closed on Friday afternoon in New York at $22.50 spot, up 11.5 cents from its close on Thursday. Net volume was on the lighter side at a bit under 40,000 contracts -- and there was around 9,100 contracts worth of roll-over/switch volume out of March and into future months...mostly May, July and September.
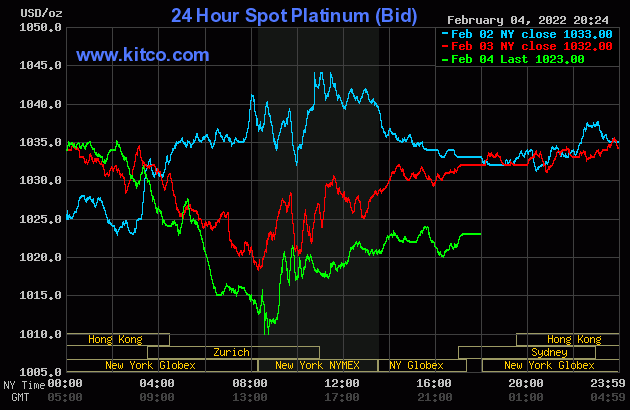
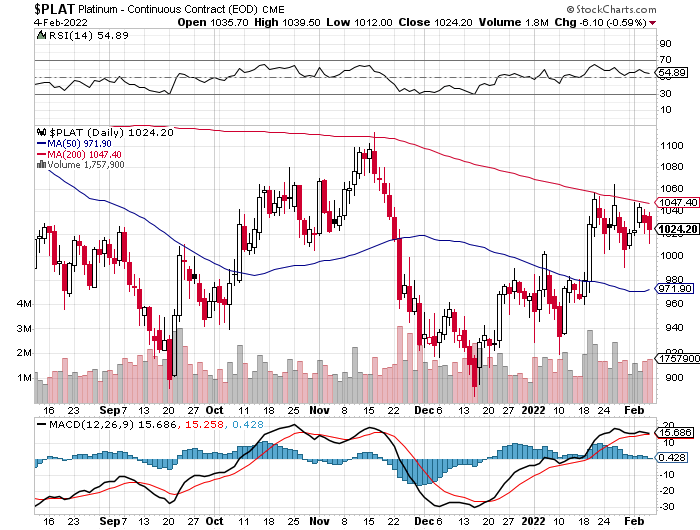
Platinum's tiny rally in morning trading topped out shortly before 1 p.m. China Standard Time on their Friday -- and then didn't do much until a few minutes after 3 p.m. CST in Far East trading. It was stair-stepped steeply lower until shortly after 8:30 a.m. in New York -- and then began to head higher starting about thirty minutes later. That wasn't allowed to last long -- and was summarily capped, but managed to chop a bit higher going into the 5:00 p.m. EST close. Platinum was closed at $1,023 spot, down 9 bucks on the day.
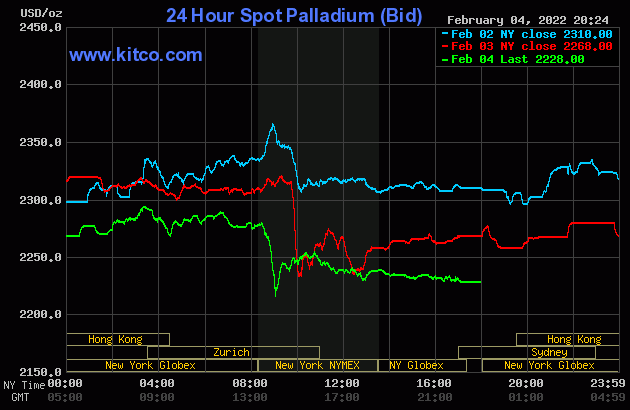
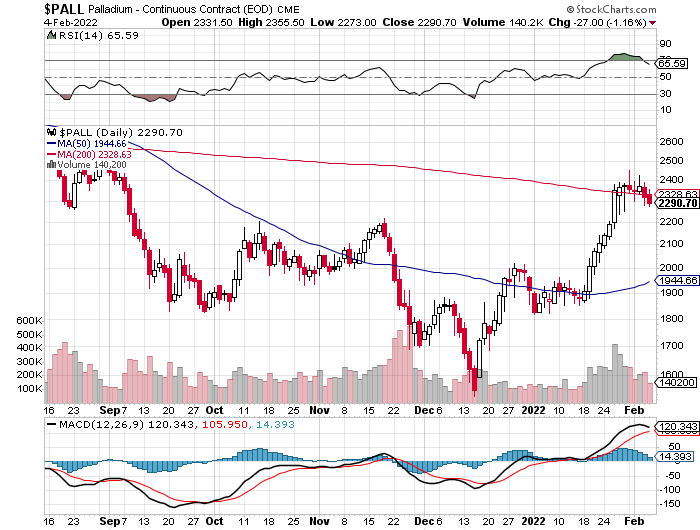
Palladium crept unevenly higher until around 9:30 a.m. in Zurich -- and then was sold lower until 8:30 a.m. in New York. 'Da boyz' appeared -- and its engineered price decline ended at the same time as the other three precious metals...a minute or so after 9 a.m. EST. It crawled a bit higher until around 10:15 a.m. -- and from that juncture it was sold quietly and evenly lower until trading ended at 5:00 p.m. in New York. Palladium was closed at $2,228 spot, down 40 bucks from Thursday -- and 70 dollars off its Kitco-recorded high tick of the day.
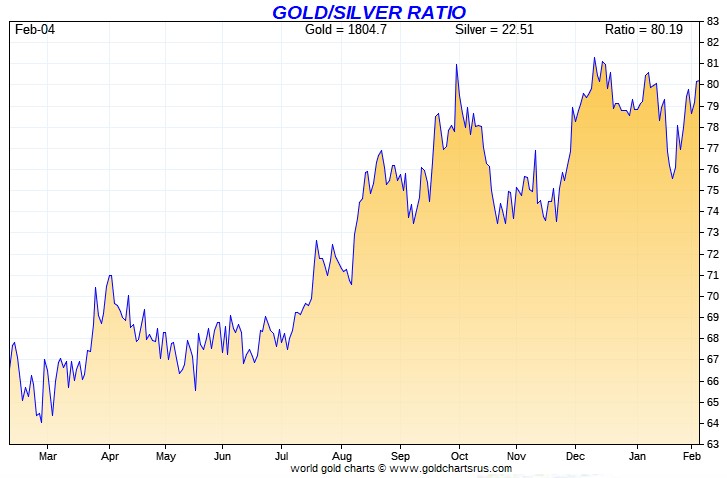
Based on the kitco.com spot closing prices in silver and gold posted above, the gold/silver ratio worked out to 80.4 to 1 on Friday...compared to 80.6 to 1 on Thursday.
Here's Nick Laird's 1-year Gold/Silver Ratio Chart, updated with this past week's data. Click to enlarge.
![]()
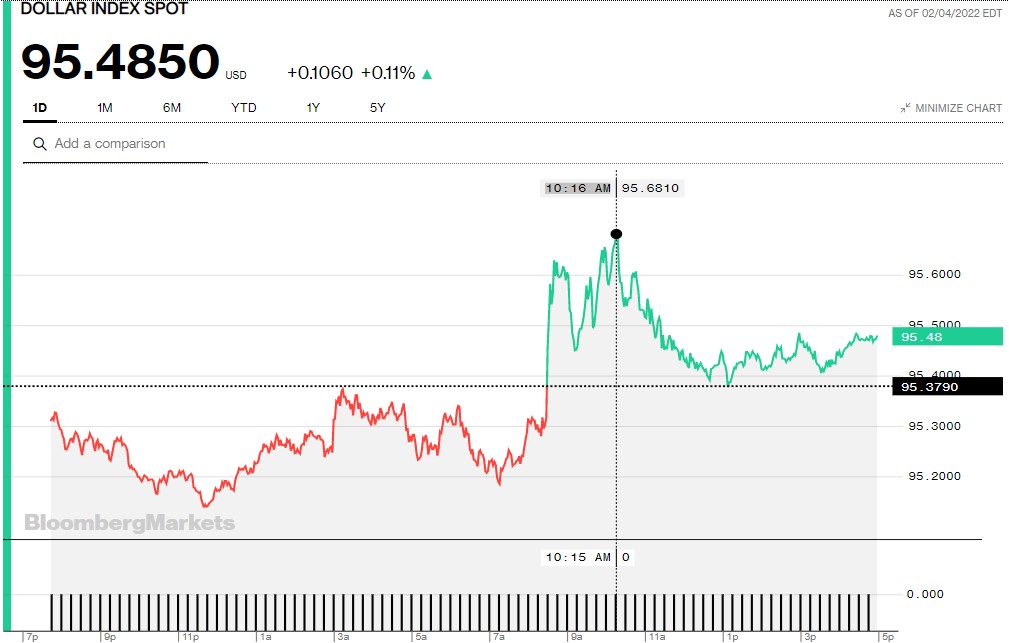
The dollar index closed very late on Thursday afternoon in New York at 95.379 -- and then opened down about 7 basis points once trading commenced around 7:45 p.m. EST on Thursday evening, which was 8:45 a.m. China Standard Time in Far East trading on their Friday morning. From that point it wandered quietly sideways until it jumped higher on the jobs report at 8:30 a.m. in New York. It then struggled to its high tick of the day, which came around 10:15 a.m. EST. A very few minutes later it was headed lower, touching the unchanged mark at 1:08 p.m. It then 'rallied' quietly and unevenly higher until the market closed at 5:00 p.m.
The dollar index finished the Friday trading session in New York at 95.485...up about 10.5 basis points from its close on Thursday.
Here's the DXY chart for Friday, thanks to Bloomberg as always. Click to enlarge.
And here's the 5-year U.S. dollar index chart that appears in this spot in almost all Saturday's columns, thanks to the folks over at the stockcharts.com Internet site. The delta between its close...95.48...and the close on the DXY chart above, was a tiny fraction of 1 basis point, if that, on Friday. Click to enlarge as well.
![]()
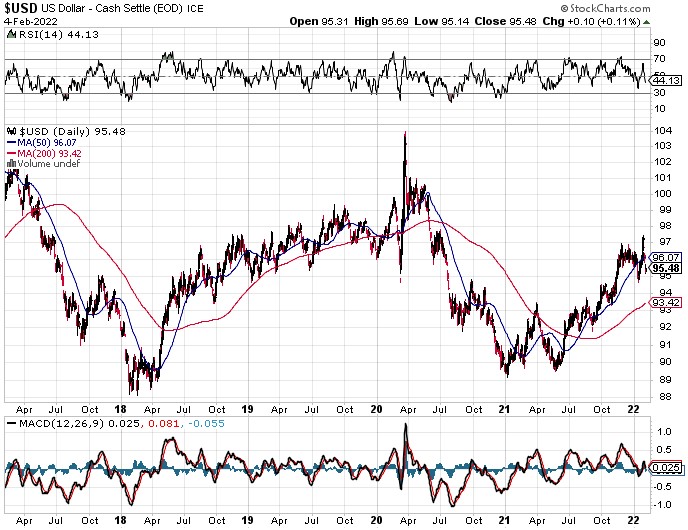
Hiding behind the skirts of yet another 'rally' in the dollar index, the commercial traders didn't waste any time going after the Managed Money traders in all four precious metals.
U.S. 10-Year Treasury: 1.9300%...up 0.1030 (+5.64%)...as of 02:59 p.m. EST
And here's the 5-year 10-year U.S. Treasury chart from the yahoo.com Internet site -- and it puts the current yield into a somewhat longer-term perspective. Click to enlarge.
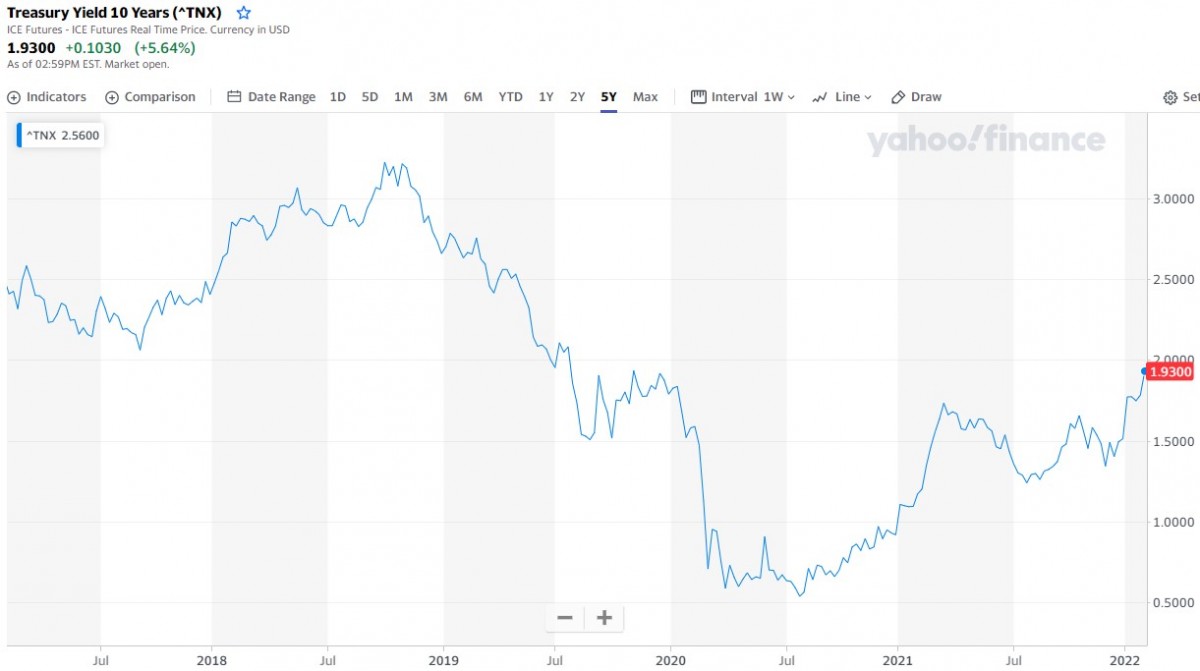
Of course the only reason that yields are where they are, is because the central banks of the world are buying almost all sovereign debt being issued. That isn't about to stop anytime soon, despite their preaching about higher interest rates.
![]()
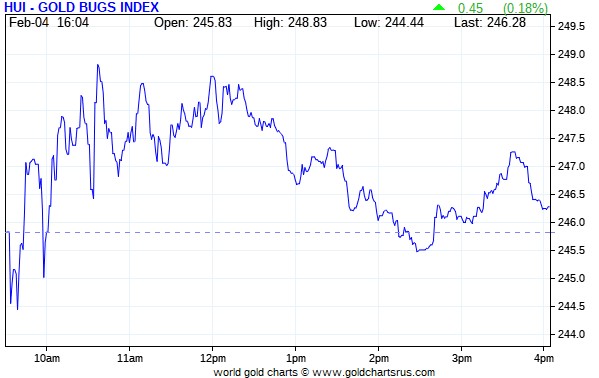
The gold stocks dipped a bit at the 9:30 a.m. open in New York on Friday evening, but began to head higher minutes later. Their respective highs were set around 10:40 a.m. in New York trading -- and they hung in there until around 12:20 p.m. They were then sold quietly lower -- and down on the day by a hair by 2:30 p.m...but managed to crawl back above the unchanged mark before trading ended at 4:00 p.m. EST. The HUI finished higher by only 0.18 percent.
Computed manually, Nick Laird's Intraday Silver Sentiment/Silver 7 Index closed up 0.94 percent.
And here's Nick's 3-year Silver Sentiment/Silver 7 Index chart, updated with Friday's candle. Click to enlarge if necessary.
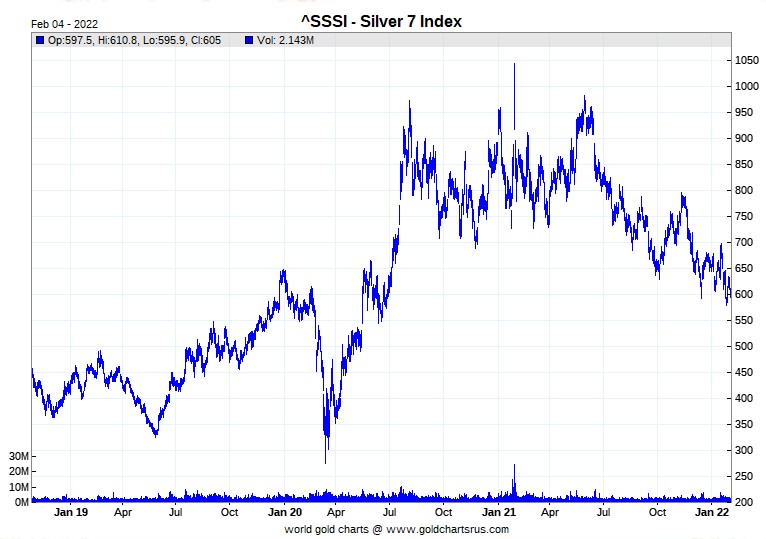
There were no real stars or dogs yesterday -- and all seven closed in the green.
The latest silver eye candy from the reddit.com/Wallstreetsilver crowd is linked here.
![]()
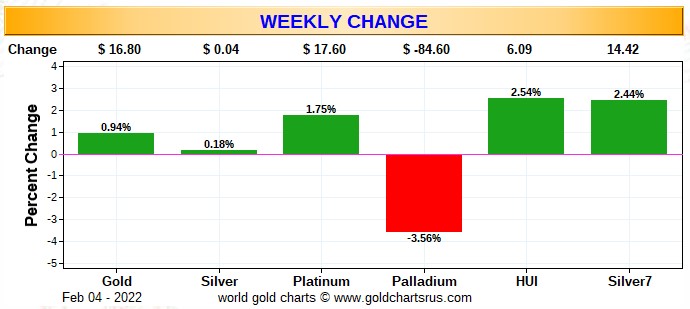
Here are two of the usual three charts that show up in every weekend missive. They show the changes in gold, silver, platinum and palladium in both percent and dollar and cents terms, as of their Friday closes in New York — along with the changes in the HUI and the Silver 7 Index.
Here's the weekly chart...and you can certainly see the efforts of the commercial traders to break palladium below its 200-day moving average, which they've now succeeded in doing. And as you are, I'm happy to see that everything silver and gold related are in the green. Click to enlarge.
There's no month-to-date chart, as Nick's program is not set up to do partial weeks -- and in this case the month is only four days long. It will return to its rightful place in next Saturday's missive.
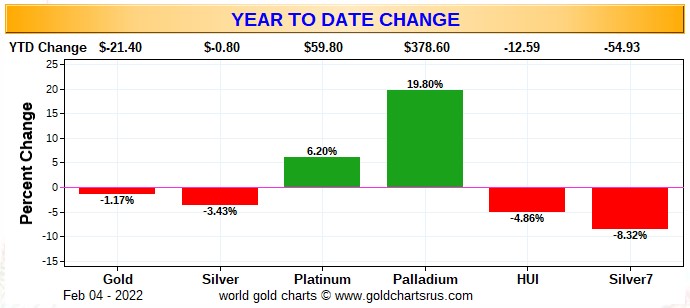
And here's the year-to-date chart, which is only five weeks old -- and the losses in everything gold and silver related comes to you courtesy of the commercial traders of whatever stripe. Click to enlarge.
As Ted has pointed out on more occasions than I can remember, the concentration data in the weekly COT Report is prima facie evidence that the Big 4/8 traders -- and mostly the Big 4, are the corks in the precious metal price bottle.
But his raptors, the small commercial traders other than the Big 8, are just as crooked, collusive -- and criminal. They've been running the price management show on their own for quite some time now, as the Big 8 watch from the sidelines.
Not surprisingly, the Commitment of Traders Report below shows that the commercial net short positions dropped a bunch during the reporting week.
But like in silver, Ted says that because the Managed Money short position in gold has become so large, one of the Big 8 shorts is not a commercial trader -- and has been shoved out by this outsider for the moment. So the improvements you see in the commercial net short position in gold is a bit larger than shown.
![]()
The CME Daily Delivery Report showed that 285 gold and 30 silver contracts were posted for delivery within the COMEX-approved depositories on Tuesday.
In gold, the only short/issuer that mattered was Morgan Stanley, with 250 contracts out of its client account. The largest long/stopper was BofA Securities, picking up 120 contracts for their house account. Right behind them was JPMorgan, stopping 116 contracts in total...64 for clients -- and other 52 for their own account. In third and fourth place were Australia's Macquarie Futures and British bank Barclays, as they picked up 26 and 9 contracts for their respective client accounts.
In silver, the sole short/issuer was JPMorgan out of its client account -- and they also picked up 23 contracts as a long/stopper...also for their client account. ADM stopped the other 7 contracts for their client account as well.
The link to yesterday's Issuers and Stoppers Report is here.
So far this month there have been 16,528 COMEX gold contracts issued/reissued and stopped -- and that number in silver is 1,238 contracts.
The CME Preliminary Report for the Friday trading session showed that gold open interest in February dropped by 723 contracts, leaving 2,650 still open, minus the 285 contracts mentioned a few paragraphs ago. Thursday's Daily Delivery Report showed that 545 gold contracts were actually posted for delivery within the COMEX-approved depositories on Monday, so that means that 723-545=178 more gold contracts vanished from the February delivery month. Silver o.i. in February declined by 35 contracts, leaving 55 still around, minus the 30 contracts mentioned a few paragraphs ago. Thursday's Daily Delivery Report showed that 69 silver contracts were actually posted for delivery on Monday, so that means that 69-35=34 more silver contracts were added to February.
Total gold open interest at the close on Friday fell by 1,432 COMEX contracts -- and total silver o.i. declined by 1,136 contracts. Both numbers are subject to some slight revision, usually downwards, once the final numbers appear on the CME's website late on Monday morning CST.
![]()
There was a fairly decent amount of gold removed from GLD yesterday, as an authorized participant took out 104,232 troy ounces. There were no reported changes in SLV.
In other gold and silver ETFs and mutual funds on Planet Earth on Friday, net of any changes in COMEX, GLD & SLV inventories, there was a net 88,494 troy ounces of gold added, but a fairly hefty 1,371,308 troy ounces of silver was withdrawn, with the biggest amount...919,474 troy ounces...coming out of Deutsche Bank.
For the fourth day in a row there was no sales report from the U.S. Mint -- and obviously haven't sold an ounce of anything so far in February.
![]()
Once again there was very little activity in gold over at the COMEX-approved depositories on the U.S. east coast on Thursday. Nothing was reported received -- and only 8,423.562 troy ounces/262 kilobars were shipped out.
In the 'out' category, there were 250 kilobars that left Brink's, Inc. -- and the remaining 12 departed Manfra, Tordella & Brookes, Inc.
There was a bit of paper activity. The largest amount was the 6,729 troy ounces that was transferred from the Registered category and back into Eligible over at JPMorgan -- and the 192.910/6 kilobars that was transferred from the Eligible category and into Registered over at Brink's, Inc. The link to 'all of the above' gold activity, is here.
There was some activity in silver, as 597,198 troy ounces was received -- and another 173,651 troy ounces was shipped out.
In the 'in' category, the largest amount was one truckload...587,246 troy ounces...that arrived at CNT -- and the remaining 9,933 troy ounces was dropped off at Delaware.
In the 'out' category, the largest amount was the 163,907 troy ounces that left Delaware, followed by the 8,656 troy ounces that was shipped out of Brink's, Inc. The remaining 1,087 troy ounces/one good delivery bar, left HSBC USA.
There was a lot of paper activity involving six different depositories -- and except for the 5,008 troy ounces/one COMEX contract that was transferred from the Eligible category and into Registered, the remaining 526,658 troy ounces was transferred from the Registered category and back into Eligible.
If you want to see that list, plus the rest of Thursday's COMEX silver activity, the link is here.
There was a bit of activity over at the COMEX-approved gold kilobar depositories in Hong Kong on their Thursday...despite the Lunar New Year holiday week. There was 500 kilobars received -- and the same amount was shipped out. All that activity was at Brink's, Inc. as usual -- and the link to that, in troy ounces, is here.
![]()
Here are the usual two 20-year charts that show up in this space every Saturday. They show the total amount of physical gold and silver held in all know depositories, ETFs and mutual funds as of the close of business on Friday.
For the week just past, there was a net 574,000 troy ounces of gold withdrawn. But a net 3,365,000 troy ounces of silver was added. -- and that's mostly due to two big deposits this past week...one into SLV -- and the other into SIVR. Click to enlarge.
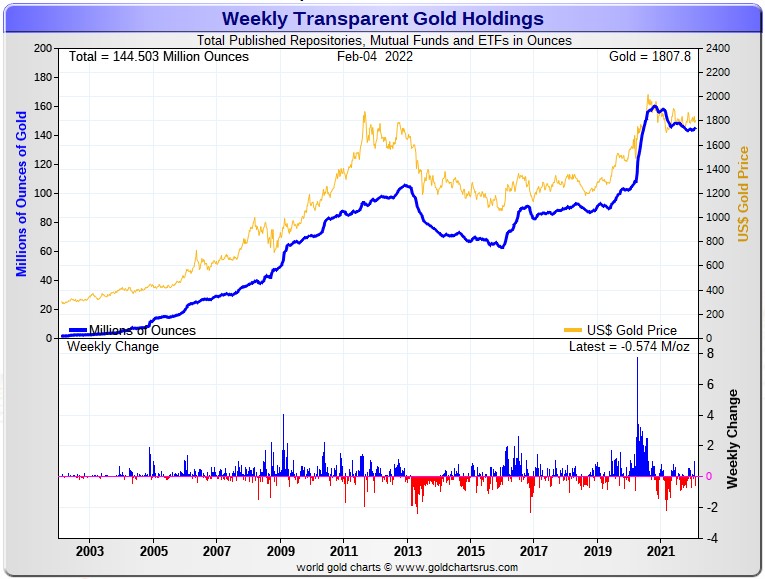
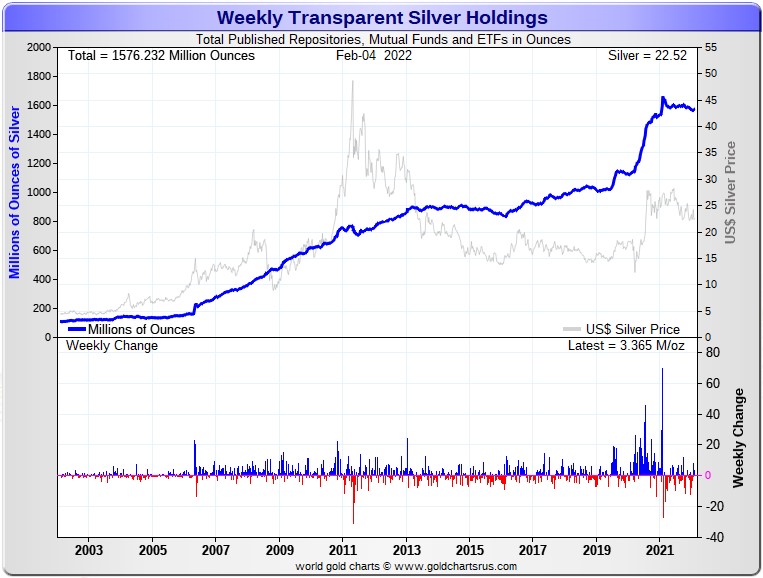
So despite the shenanigans in the paper market in silver, there has been about 12 million ounces of silver deposited into various and sundry ETFs and mutual funds in the last two weeks.
All of this silver is from the amount that BoA leased from 'Friends of JPMorgan' and then sold into the open market...because it sure as heck isn't coming out of daily mine production.
The physical shortage situation in silver has been creeping up for a while now. But the commercial traders of whatever stripe have not allowed it to manifest itself in its price yet...rightfully fearing what that will do to the demand side of the equation -- and they had a taste of it these past two weeks.
Heaven only knows how much demand will explode into once silver is allowed to break above its 200-day moving average...a moving average that they have been vigorously defending for the past many months.
But all they're doing is delaying the inevitable.
![]()
The Commitment of Traders Report, for positions held at the close of COMEX trading on Tuesday, February 1 showed far bigger improvement in the commercial net short positions than either Ted or I were expecting...but it was mostly on the back of Ted's raptors buying.
In silver, the Commercial net short position fell by 12,421 COMEX contracts, or 62.1 million troy ounces.
They arrived at that number by increasing their long position by 3,477 contracts -- and also reduced their short position by 8,306 COMEX contracts. It's the sum of those two numbers that represents their change for the reporting week.
Under the hood in the Disaggregated COT Report it was all Managed Money traders, plus a bit more, as the decreased their long position by 5,521 contracts -- and also added a hefty 9,939 short contracts, for a total of 15,460 COMEX contracts. The Nonreportable/small traders also reduced their net long position...them by 2,398 contracts. The Other Reportables went in the other direction by increasing their net long position by 5,437 COMEX contracts.
Doing the math: 15,460 plus 2,398 minus 5,437 equals 12,421 COMEX contracts, the change in the Commercial net short position.
The Commercial net short position in silver now sits at 176.3 million troy ounces...and obviously down 62.1 million troy ounces from the 238.4 million troy ounces that they were short in last Friday's COT Report.
The Big 8 are short 327.4 million troy ounces in this week's COT Report, down only 9.5 million troy ounces from the 336.9 million troy ounces they were short in last Friday's COT Report.
[But that still isn't a pure number, as Ted is of the opinion that there is at one, or maybe two Managed Money trader in the Big '5 through 8' category. I was of the opinion that there might be one in the Big 4 -- and one in the Big '5 through 8' category after this reporting week's price action, but he thought not. I know he's going to "sleep on it" -- and I'll be interested in his final take on this in his weekly review this afternoon.]
The headline change in the Commercial net short position above showed a decrease of 62.1 million troy ounces. So it was Ted's raptors, the small commercial traders other than the Big 8 shorts that made up the difference during the reporting week...to the tune of 62.1-9.5= 52.6 million troy ounces...around 10,520 COMEX contracts...as they increased their long position by that amount.
It was their buying of long positions that had the mathematical effect of decreasing the commercial net short position by that amount. However, since there is at least one Managed Money traders in the Big 8 category, this fact alone has the effect of artificially lowering the improvement in the short position of the Big 8 -- and artificially increasing how much Ted's raptors purchased.
Don't forget that despite their small size, Ted's raptors are still commercial traders in the commercial category -- are the ones that engineered the price decline that we experienced during the reporting week.
But, as stated above, that Big 8 'Commercial' short position of 327.4 million troy ounces is not entirely accurate once again, because Ted said that the short position of one or more Managed Money trader is in the Big '5 through 8' category. So the Big 8 are still not entirely made up of commercial traders...just 6 or 7 of the 8 -- and that distorts that number. Ted says it should certainly be lower than the 327.4 million troy ounces stated...as I mentioned in the previous paragraph.
The Big 8 are short 327.4/176.3 equals about 186 percent of the Commercial net short position in silver, up from the 141 percent they were short in last week's COT Report...the numerator muddied by the fact that the Big '5 through 8' shorts have one or two Managed Money trader in their ranks.
Here's the 3-year COT chart for silver, courtesy of Nick Laird as always. Click to enlarge.
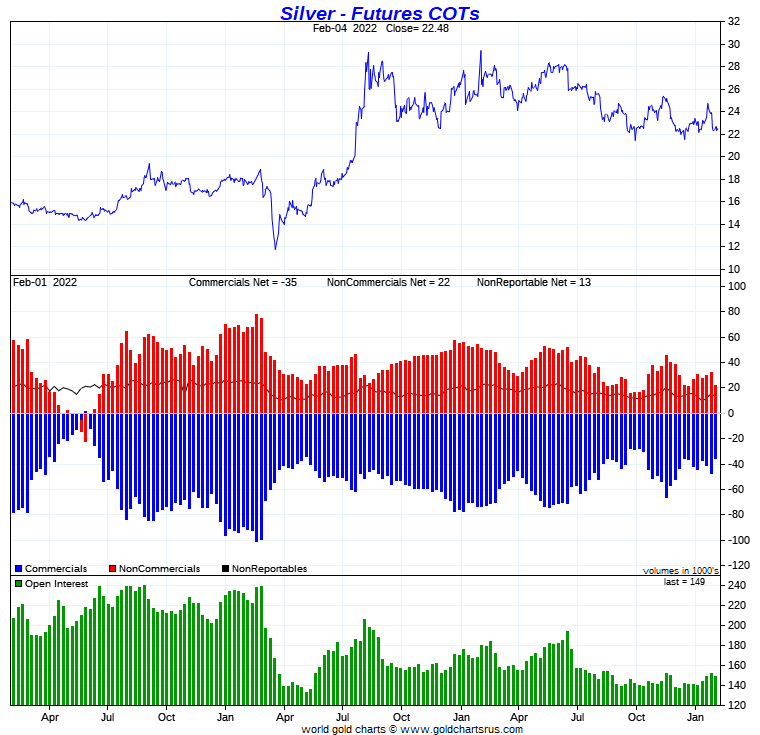
So it was a raptor/small commercial trader affair during the reporting week. The Big 8 shorts did improve their lot. It works out to 9.5 million troy ounces on paper, but is certainly a lot more than that if the Big 8 category wasn't contaminated by the one or two Managed Money Traders that are in it now.
Of course there's been even more improvement since the Tuesday cut-off, as the commercial traders of whatever stripe have kept silver on a very short leash since then. But exactly how much won't be known until next Friday...barring a big price rally during the final two reporting days of the week that ends at the COMEX close on Tuesday.
So the set-up for a monster rally is in place once more, as it's been on several occasions in the last few months. But as you already know, it ain't going to happen until the commercial traders or whatever stripe are either overrun, or are told to step aside.
![]()
In gold, the commercial net short position cratered by an eye-watering 48,404 COMEX contracts -- and even I was blown away by it.
They arrived at that number by reducing their long position by 2,575 contracts, but reduced their short position by a knee-wobbling 50,979 contracts -- and it's the difference between those two numbers that represents their change for the reporting week.
Under the hood in the Disaggregated COT Report -- and like in silver, it was all Managed Money traders and a bit more, as they decreased their net long position by a whopping 51,461 COMEX contracts. The Nonreportable/small traders also decreased their net long position, but only by 395 COMEX contracts -- and the Other Reportables were buyers, increasing their net long position by 3,452 contracts...mostly be reducing their gross short position, which Ted was expecting they might do, as they'd been building it up over the last few weeks.
Doing the math: 51,461 plus 395 minus 3,452 equals 48,404 COMEX contracts, the change in the commercial net short position.
The commercial net short position in gold now sits at 20.13 million troy ounces, obviously down 4.84 million troy ounces from the 24.97 million troy ounces they were short in last Friday's COT Report.
The short position of the Big 8 traders is now 23.04 million troy ounces, down only about 760,000 troy ounces from the 23.80 million troy ounces they were short in last week's COT Report.
The reason why the Big 8 didn't improve their short position more on a net basis, is because Ted figures that there's now one Managed Money trader with a large enough short position in gold to put it in the Big '5 through 8' short category, so this is not a pure number either...only 7 out of 8 are commercial traders. Like in silver, that Managed Money short has the mathematical effect of decreasing the actual short covering done by the Big 8 commercial traders during the reporting week. Ted pointed out on the phone that the Big 4 shorts in gold actually reduced their short position by 980,000 troy ounces...so you can see how much that Managed Money traders skews the Big 8 short position on a net basis.
The headline change in the commercial net short position showed an decrease of 4.84 million troy ounces, so that means that Ted's raptors, the small commercial traders other than the Big 8, had to have purchased 4.84-0.76=4.08 million troy ounces/40,800 COMEX long contracts to make up the difference -- and that's what they did...but also distorted by the fact that one Managed Money trader in the Big 8 short category.
Like in silver, their buying of long positions had the mathematical effect of decreasing the commercial net short position by that amount.
And don't forget that despite their small size, Ted's raptors are still commercial traders in the commercial category.
From the above numbers, the Big 8 traders are short 23.04/20.13 equals about 114 percent of the commercial net short position in gold...up about 19 percentage points from the approximately 95 percent they were short in last Friday's COT Report. This means that Ted's raptors are back to being long the COMEX futures market in gold by that 14 percentage points...distorted by that one Managed Money trader now in the Big 8 short category.
Here's Nick Laird's 3-year COT chart for gold, updated with Friday's data. Click to enlarge.
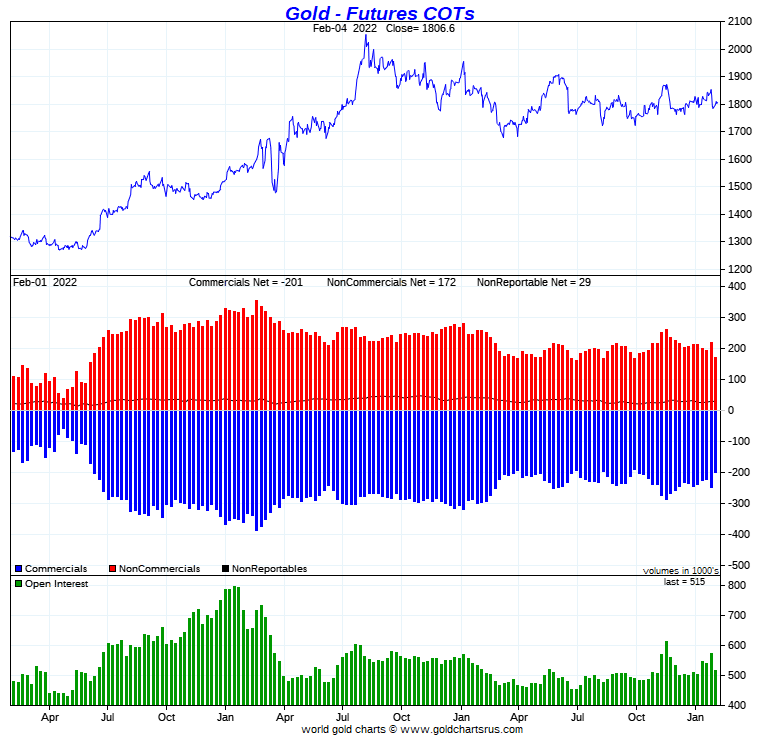
So, it was even more of a raptor/small commercial trader affair in gold than it was in silver, with the Big 8 short picking up the scraps.
And because there was a 5,090 contract drop in the Other Reportables long position during the reporting week, Ted is leaning in the direction that John Paulson might have either lightened up on his 40,000 contract long position by that amount, or got stopped out of that amount. He's sleeping on that too.
And whether its 35 or 40,000 contracts John is long in gold, that number can safely be subtracted from the commercial net short position, taking that number down to around the 16.5 million troy ounces, a very low number.
There's certainly been no deterioration in gold since the Tuesday cut-off for next week's COT Report, so the set up in gold, like in silver, is off-the-charts bullish for a monster rally but, as always, only if the commercial traders of whatever stripe allow it.
![]()
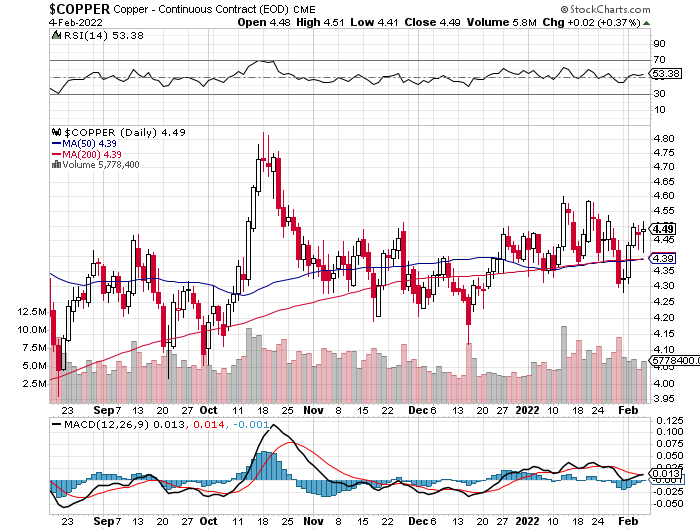
In the other metals, the Managed Money traders in palladium, not surprisingly, decreased their net short position by a further 1,345 COMEX contracts during the last reporting week -- but are still net short the palladium market by 101 COMEX contracts. In platinum, the Managed Money traders increased their net short position by a further 1,750 contracts during the reporting week -- and are now net long the COMEX futures market by 7,654 COMEX contracts...14 percent of total open interest, up 3 percentage points from last week. The Producer/Merchant category is net short platinum big time at the moment, the only category that is. In copper, the Managed Money traders decreased their net long position by 9,397 COMEX contracts -- and are net long copper by 18,767 COMEX contracts at the moment...about 469 million pounds of the stuff -- and about 9 percent of total open interest...down about 5 percentage points from what they were net long in last Friday's COT Report.
![]()
Here’s Nick Laird’s “Days to Cover” chart, updated with the COT data for positions held at the close of COMEX trading on Tuesday, February 1. It shows the days of world production that it would take to cover the short positions of the Big 4 — and Big '5 through 8' traders in each physically traded commodity on the COMEX.
I consider this to be the most important chart that shows up in the COT series -- and it always deserves a minute of your time. Click to enlarge.
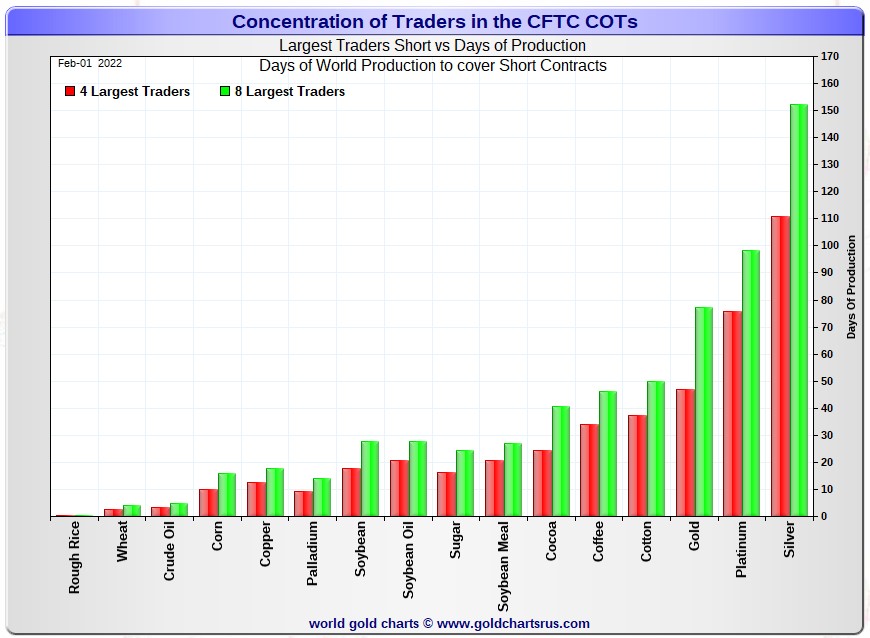
[NOTE: As mentioned in the COT Report above -- and for the sixth week in a row, the Big 8 shorts are no longer all commercial traders -- and that's because the short position of at least one, if not two of the biggest Managed Money traders is so large, that they're in the Big 8 commercial short category. For that reason, the numbers shown below aren't entirely accurate, but close enough for our purposes -- and will remain that way until they cover enough of their short positions to disappear from that category. - Ed]
In this week's 'Days to Cover' chart, the Big 4 traders are short about 111 days of world silver production, down 5 days from last week's COT Report. The ‘5 through 8’ large traders are short an additional 41 days of world silver production, unchanged from last Friday's report, for a total of about 152 days that the Big 8 are short -- obviously down 5 days from last week's report. [In last Friday's COT Report, they were short 157 days of world production.]
That 152 days that the Big 8 are short, represents five months of world silver production, or 327.4 million troy ounces of paper silver held short by the Big 8.
In the COT Report above, the Commercial net short position in silver was reported by the CME Group at 176.3 million troy ounces. As mentioned in the previous paragraph, the short position of the Big 4/8 traders is 327.4 million troy ounces. So the short position of the Big 4/8 traders is larger than the Commercial net short position by 327.4-176.3=151.1 million troy ounces...up 52.6 million troy ounces from last week's COT Report...10,520 COMEX contracts.
The reason for the difference in those numbers is that these raptors, the small commercial traders other than the Big 8, are net long silver by that amount.
And because of the one or more Managed Money traders in the Big 8, this number is overstated by a certain amount...however it's not overly material. It also distorts the rest of the silver numbers that follow by a bit as well.
As per the first paragraph above, the Big 4 traders in silver are short around 111 days of world silver production in total. That's a bit under 28 days of world silver production each, on average...down a bit over one day from last Friday's report. The traders in the '5 through 8' category are short 41 days of world silver production in total...10 days and a bit of world silver production each on average -- and about unchanged from last week's COT Report.
The Big 8 traders are short 43.9 percent of the entire open interest in silver in the COMEX futures market, which is down a tiny amount from the 44.4 percent they were short in the last COT report. And once whatever market-neutral spread trades are subtracted out, that percentage would certainly be very close to the 50 percent mark. In gold, it's 44.7 percent of the total COMEX open interest that the Big 8 are short, up a decent amount from the 41.6 percent they were short in last Friday's COT Report -- and a bit over the 50 percent mark once their market-neutral spread trades are subtracted out.
In gold, the Big 4 are short 47 days of world gold production, down about four days from last Friday's COT Report. The '5 through 8' are short 30 days of world production, up about one day from last week...for a total of 77 days of world gold production held short by the Big 8 -- down about three days from last Friday's COT Report. Based on these numbers, the Big 4 in gold hold about 61 percent of the total short position held by the Big 8...down about three percentage points from last Friday's COT Report. [And don't forget that one of the traders in the Big '5 through 8' category is a Managed Money trader -- and certainly affects two of the three numbers in this week's gold COT Report]
The "concentrated short position within a concentrated short position" in silver, platinum and palladium held by the Big 4 commercial traders are about 73, 78 and 64 percent respectively of the short positions held by the Big 8...the red and green bars on the above chart. Silver is down about 1 percentage point from last week...platinum is down about 2 percentage point from a week ago -- and palladium is down about six percentage points week-over-week.
The Big 4/8 traders are still very firmly stuck on the short side in both gold and silver -- and decreased their net short positions in both by a bit during the reporting week. As Ted has been saying, it's his raptors, the small commercial traders other than the Big 8, that are running the price management show. That was the case during this last reporting week as well -- and in the many weeks preceding that...but the Big 8 were obviously active in capping their respective prices when necessary -- and also covering shorts when they were able.
As I've pointed out before -- and will mention again, it's my firm belief that the Big 4/8 shorts will never be able to extricate themselves fully from the short side, if that was ever their intention. At some point they're going to have eat the lion's share of the short positions that they currently hold. The only way that can do that is to go into the market and buy longs...or deliver physical metal, but only if the long holders are in a position to accept delivery. A lot of them aren't.
And the moment the rest of the traders in the COMEX futures market sees that, the 'ask' will disappear -- and prices will explode...unless the powers-that-be at the CFTC and CME Group have something nefarious up their sleeves, or they're bailed out by the likes of the Exchange Stabilization Fund. I have more on this in The Wrap.
However, the circumstance in silver has also been altered by an unimaginable [and monstrously bullish] amount by Ted's discovery of the approximately 800 million troy ounce physical short position in silver that Bank of America now holds as of the last OCC Report.
He has come to the conclusion that BofA is also short about 30 million ounces of gold in the OTC market as well.
The situation regarding the Big 4/8 shorts in silver, gold [and platinum] continues to be far beyond obscene, twisted and grotesque -- and as Ted correctly points out ad nauseam, its resolution will be the sole determinant of precious metal prices going forward.
As always, nothing else matters.
![]()
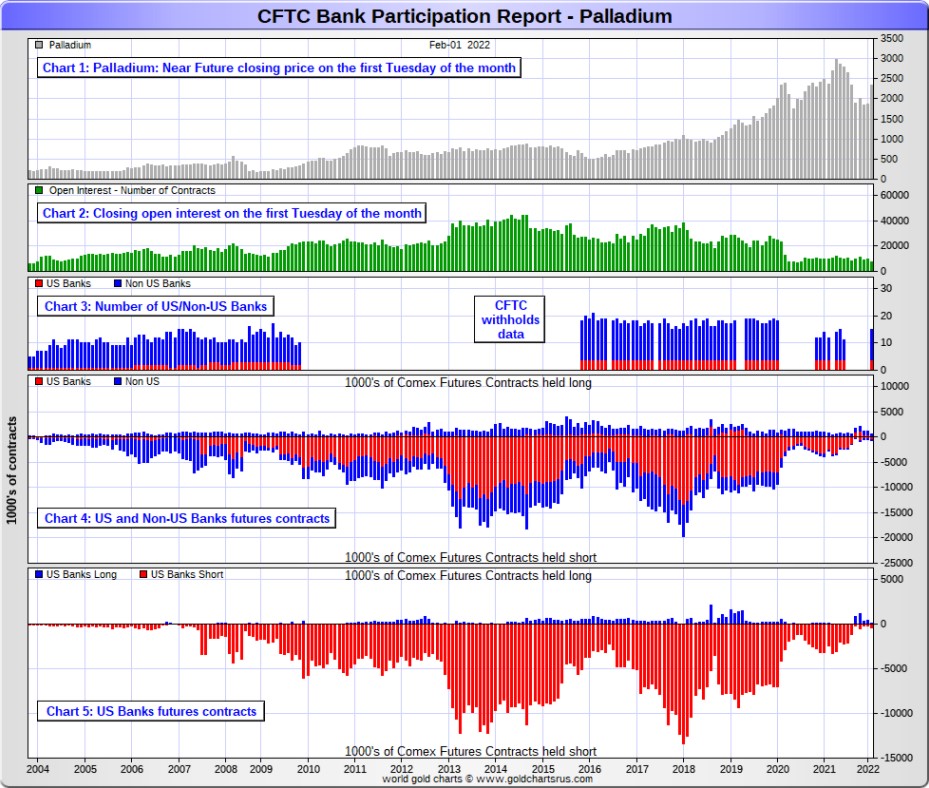
The February Bank Participation Report [BPR] data is extracted directly from yesterday's Commitment of Traders Report. It shows the number of futures contracts, both long and short, that are held by all the U.S. and non-U.S. banks as of Tuesday’s cut-off in all COMEX-traded products. For this one day a month we get to see what the world’s banks are up to in the precious metals. They’re usually up to quite a bit, but didn't do much in January, except for the non-U.S. banks once again.
[The February Bank Participation Report covers the time period from January 4 to February 1 inclusive.]
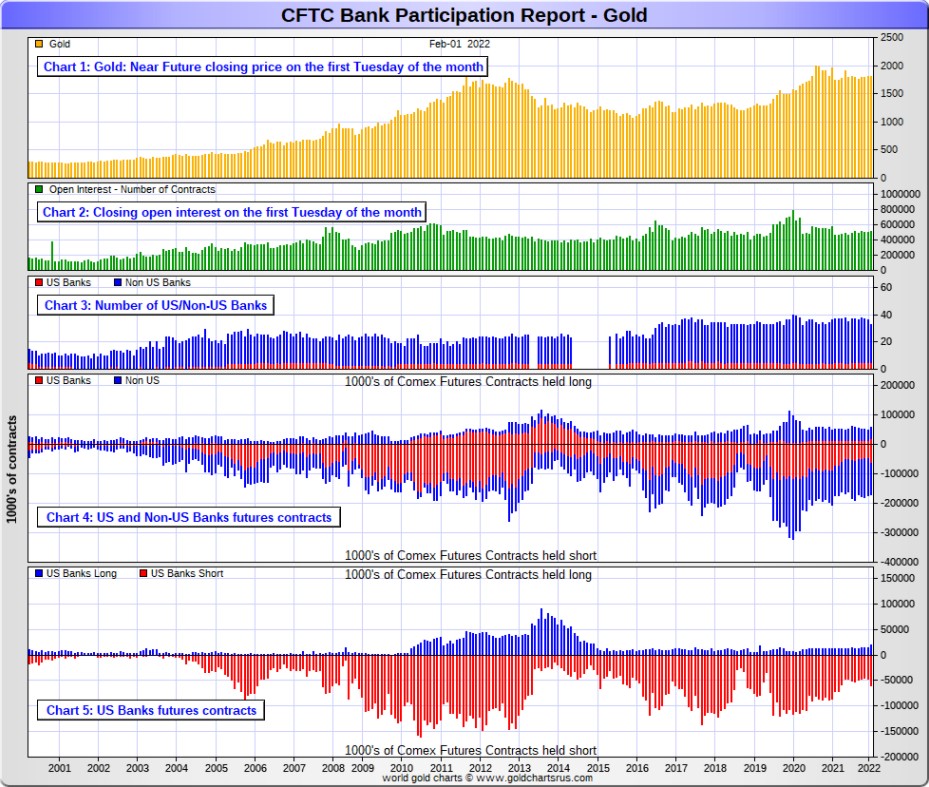
In gold, 5 U.S. banks are net short 39,518 COMEX contracts in the February BPR. In January’s Bank Participation Report [BPR] these same 5 U.S. banks were net short 33,055 contracts, so there was a smallish increase of about 6,500 COMEX contracts month over month. That's the second month in a row that the U.S. banks have increased their short position in gold by a bit.
Citigroup, HSBC USA, Bank of America and Morgan Stanley would most likely be the U.S. banks that are short this amount of gold. I still have my usual suspicions about the Exchange Stabilization Fund, although if they're involved, they are most likely just backstopping these banks.
Also in gold, 28 non-U.S. banks are net short 72,945 COMEX gold contracts. In January's BPR, 31 non-U.S. banks were net short 89,751 contracts...so the month-over-month change shows a decrease of 16,806 COMEX contracts...the only really big change in this month's Bank Participation Report -- and the second month in a row they've reduced their net short position in this precious metal.
At the low back in the August 2018 BPR...these same non-U.S. banks held a net short position in gold of only 1,960 contacts -- and they've been back on the short side in an enormous way ever since.
I suspect that there's at least three large banks in this group, HSBC, Barclays and Deutsche Bank. I also have my suspicions about Scotiabank/Scotia Capital, Dutch Bank ABN Amro, French bank BNP Paribas, plus Australia's Macquarie Futures as well. Other than that small handful, the short positions in gold held by the vast majority of non-U.S. banks are immaterial and, like in silver, have always been so.
As of this Bank Participation Report, 33 banks [both U.S. and foreign] are net short 21.9 percent of the entire open interest in gold in the COMEX futures market, which is down a bit from the 24.4 percent that 36 banks were net short in the January BPR.
Here’s Nick’s BPR chart for gold going back to 2000. Charts #4 and #5 are the key ones here. Note the blow-out in the short positions of the non-U.S. banks [the blue bars in chart #4] when Scotiabank’s COMEX short position was outed by the CFTC in October of 2012. Click to enlarge.
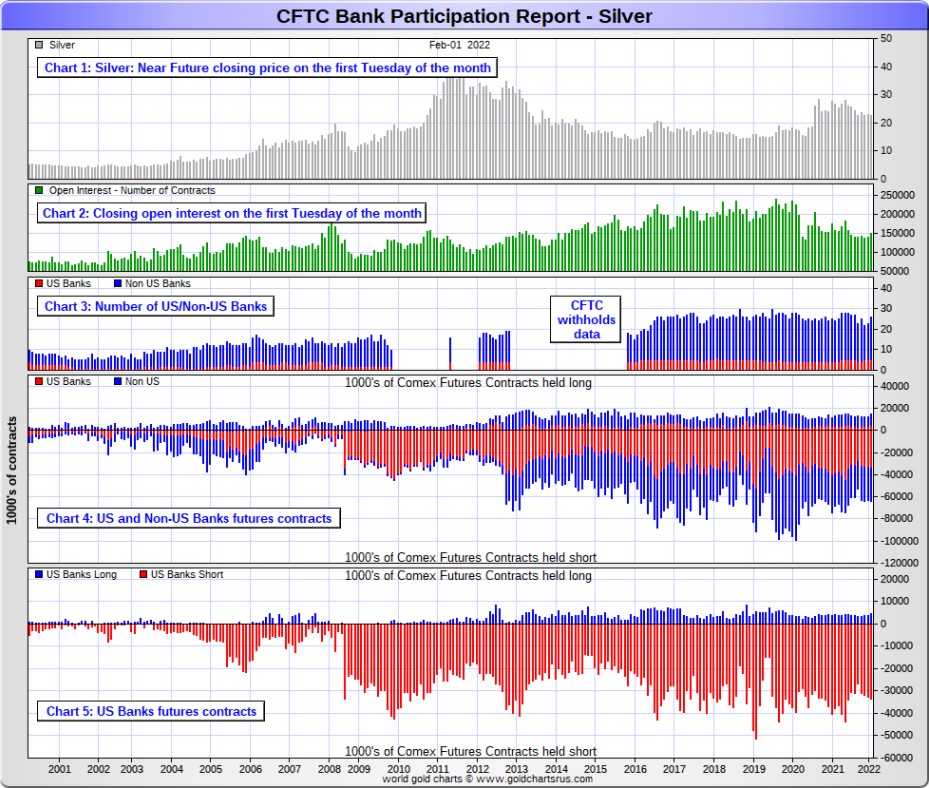
In silver, 5 U.S. banks are net short 28,830 COMEX contracts in February's BPR. In January's BPR, the net short position of these same 5 U.S. banks was 28,828 contracts, which is unchanged month-over-month. This is the fourth month a row where there has been no material change in short positions in silver held by these 5 U.S. banks.
The biggest short holders in silver of the five U.S. banks in total, would be Citigroup, HSBC USA, Bank of America, Morgan Stanley...and now Goldman Sachs...but not JPMorgan according to Ted. And, like in gold, I have my suspicions about the Exchange Stabilization Fund's role in all this...although, also like in silver, not directly.
Also in silver, 21 non-U.S. banks are net short 19,974 COMEX contracts in the February BPR...which is down a decent amount from the 22,750 contracts that 18 non-U.S. banks were short in the January BPR.
I would suspect that HSBC and Barclays holds a goodly chunk of the short position of these non-U.S. banks...plus some by Canada's Scotiabank/Scotia Capital still. I'm not sure about Deutsche Bank... but now suspect Australia's Macquarie Futures. I'm also of the opinion that a number of the remaining non-U.S. banks may actually be net long the COMEX futures market in silver. But even if they aren’t, the remaining short positions divided up between these other 16 or so non-U.S. banks are immaterial — and have always been so.
As of February's Bank Participation Report, 26 banks [both U.S. and foreign] are net short 32.7 percent of the entire open interest in the COMEX futures market in silver—down from the 37.0 percent that 23 banks were net short in the January BPR. And much, much more than the lion’s share of that is held by Citigroup, HSBC, Bank of America, Barclays -- and Scotiabank -- and possibly one other non-U.S. bank...all of which are card-carrying members of the Big 8 shorts.
I'll point out here that Goldman Sachs, up until late last year, had no derivatives in the COMEX futures market in any of the four precious metals, but did show up in the last OCC Report as being short a bit...most likely in silver.
Here’s the BPR chart for silver. Note in Chart #4 the blow-out in the non-U.S. bank short position [blue bars] in October of 2012 when Scotiabank was brought in from the cold. Also note August 2008 when JPMorgan took over the silver short position of Bear Stearns—the red bars. It’s very noticeable in Chart #4—and really stands out like the proverbial sore thumb it is in chart #5. But as of March of 2020...they're out of their short positions, not only in silver, but the other three precious metals as well. Click to enlarge.
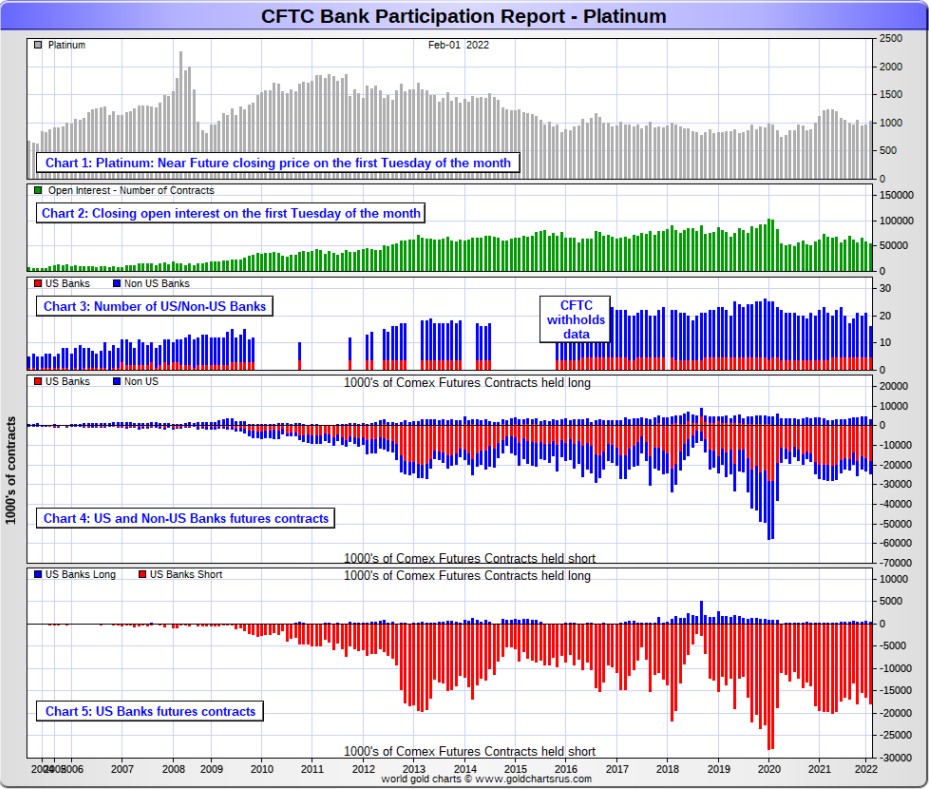
In platinum, 5 U.S. banks are net short 17,363 COMEX contracts in the February Bank Participation Report, which is up about 1,600 or so contracts from the 15,719 COMEX contracts that these same 5 U.S. banks were short in the January BPR.
At the 'low' back in July of 2018, these U.S. banks were actually net long the platinum market by 2,573 contracts. So they have a very long way to go to get back to just market neutral in platinum...if they ever intend to, that is.
Also in platinum, 11 non-U.S. banks are net short 4,048 COMEX contracts in the February BPR, which is up a decent amount from the 2,627 COMEX contracts that 16 non-U.S. banks were net short in the January BPR.
[Note: Back at the July 2018 low, these same non-U.S. banks were net short only 1,192 COMEX contracts in platinum.]
But I will point out here that this is the second month in a row that all the world's banks have increased their collective short position in platinum...the Big 8 shorts No. 2 problem child.
And as of February's Bank Participation Report, 16 banks [both U.S. and foreign] are net short 39.7 percent of platinum's total open interest in the COMEX futures market, which is up a very decent amount from the 31.4 percent that 21 banks were net short in January's BPR.
But it's the U.S. banks that are on the short hook big time -- and the real price managers. They have little chance of delivering into their short positions, although a very large number of platinum contracts have already been delivered during the last year or so. But that fact, like in both silver and gold, has made no difference whatsoever to their short positions held. The situation for them in this precious metal is as equally dire in the COMEX futures market as it is with the other two precious metals...silver and gold...particularly the former.
The reason that they'll never improve their short positions in a big way is the same reason as in gold and silver...the Managed Money traders flatly refuse to go short big time like they used to in the past -- and they're actually net long about 7,700 COMEX contracts at the moment.
Here's the Bank Participation Report chart for platinum. Click to enlarge.
In palladium, 4 U.S. banks are net long 306 COMEX contracts in the February BPR, which is up an inconsequential amount from the 280 contracts that '3 or less' U.S. banks were net long in the January BPR.
Also in palladium, 11 non-U.S. banks are now back to being net short 86 COMEX contracts—down from the 467 contracts that '11 or more' non-U.S. banks were net long in the January BPR. This is the first time in two years that these non-U.S. banks have been short palladium by any amount.
And as I've been commenting for almost forever now, the COMEX futures market in palladium is a market in name only, because it's so illiquid and thinly-traded. Its total open interest at Tuesday's cut-off was only 7,853 contracts...compared to 53,898 contracts of total open interest in platinum...149,136 in silver -- and 515,331 COMEX contracts in gold.
The only reason that there's a futures market at all in palladium, is so that the Big 8 traders can control its price.
As of this Bank Participation Report, 15 banks [both U.S. and foreign] are net long 2.8 percent of the entire COMEX open interest in palladium...compared to the 7.9 percent of total open interest that 12 banks were net long in January's BPR.
And because of the small numbers of contracts involved, along with a tiny open interest, these numbers are pretty much meaningless.
But, having said that, for the last two years in a row, the world's banks have not been involved in the palladium market in a material way.
Here’s the palladium BPR chart. Although the world's banks continue to be net long, it remains to be seen if they return as big short sellers again at some point like they've done in the past. Click to enlarge.
Excluding palladium for obvious reasons, only a small handful of the world's banks, most likely four or so in total -- and mostly U.S-based, except for HSBC, Barclays and maybe Deutsche Bank...continue to have meaningful short positions in the other three precious metals. It's a near certainty that they run this price management scheme from within their own in-house/proprietary trading desks...although it's a given that some of their their clients are short these metals as well.
The futures positions in silver and gold that JPMorgan holds are immaterial -- and have been since March of 2020...according to Ted Butler. And what positions they do hold, would certainly be on the long side of the market. It's the new 7+1 shorts et al. that are on the hook in everything precious metals-related.
And as has been the case for over a year now, the short positions held by the Big 4/8 traders/banks is the only thing that matters -- and how it is ultimately resolved [as Ted said earlier] will be the sole determinant of precious metal prices going forward.
The Big 8 shorts, along with Ted's raptors...the small commercial traders other than the Big 8 commercial shorts...continue to have an iron grip on their respective prices -- and nothing has changed in that regard over the last month. They are the corks in the price bottle.
That situation will persist until they either voluntarily give it up...or are told to step aside, as it now appears that there's no chance that they will ever get overrun. If that possibility had ever existed in reality, it would have happened already. However, considering the current state of the financial system -- and the looming physical shortage in silver, I suppose one shouldn't rule it out entirely.
I have a decent number of stories, articles and videos for you today, including a couple I've been saving for today's column for length and/or content reason.
![]()
CRITICAL READS
Payrolls show surprisingly powerful gain of 467,000 in January despite omicron surge
Job growth rose far more than expected in January despite surging omicron cases that seemingly sent millions of workers to the sidelines, the Labor Department reported Friday.
Nonfarm payrolls surged by 467,000 for the month, while the unemployment rate edged higher to 4%, according to the Bureau of Labor Statistics. The Dow Jones estimate was for payroll growth of 150,000 and a 3.9% unemployment rate.
The stunning gain came a week after the White House warned that the numbers could be low due to the pandemic.
Covid cases, however, have plunged nationally in recent weeks, with the seven-day moving average down more than 50% since peaking in mid-January, according to the CDC. Most economists had expected January’s number to be tepid due to the virus, though they were looking for stronger gains ahead.
Along with the big upside surprise for January, massive revisions sent previous months considerably higher.
December, which initially was reported as a gain of 199,000, went up to 510,000. November surged to 647,000 from the previously reported 249,000. For the two months alone, the initial counts were revised up by 709,000. The revisions came as part of the annual adjustments from the BLS that saw sizeable changes for many of the months in 2021.
Those changes brought the 2021 total to 6.665 million, easily the biggest single-year gain in U.S. history.
“The benchmark revisions helped the numbers a bit just because it moved out some of the seasonal factors that have been at work. But overall the job market is strong, particularly in the face of omicron,” said Kathy Jones, chief fixed income strategist at Charles Schwab. “It’s hard to find a weak spot in this report.”
This fantastic fairy tale was posted on the cnbc.com Internet site at 8:31 a.m. EST on Friday morning -- and updated four hours later. I thank Swedish reader Patrik Ekdahl for sending it along -- and another link to it is here. The chart-filled Zero Hedge spin on this is headlined "Here is What's Behind Today's Stunning Payrolls Beat" -- and comes to us courtesy of Richard Saler.
![]()
From 401(k) plans to mutual funds to the federal government workers’ pension plan to foreign central bank stock portfolios – everyone is feeling Facebook’s pain today. The parent company’s stock (Meta Platforms, Inc.) lost 26.39 percent of its value yesterday – in one trading session.
That’s what happens when the Fed is allowed, with no restraints from Congress, to fuel a bubble market that allows one company — that pays no dividend and has no barriers for upstarts like TikTok to steal its user base — to gain a market cap of over $1 trillion.
On June 28 of last year, Facebook’s stock closed above a $1 trillion market cap for the first time. It has been on a price decline since last September and when the stock market’s closing bell rang yesterday, it was a $647 billion stock. Its market cap decline yesterday was the largest decline for any one stock in one day in the history of the stock market.
The pain is going to be widely felt. According to Yahoo! Finance, large mutual fund and ETF families are the largest owners of Facebook shares with Vanguard Group holding $62 billion as of September 29, 2021. The next top three holders, as of the same date, were Blackrock with $52.9 billion; FMR (parent of Fidelity) with $43.2 billion and T. Rowe Price with $32.9 billion. (The funds may have lightened their positions since their last reporting date.)
We checked two foreign central banks that file their stock holdings with the SEC. As of September 30, 2021, Norway’s central bank, Norges Bank, reported owning 27.7 million shares of Facebook with a market value of $7.27 billion. The Swiss National Bank reported owning $3.2 billion of Facebook.
Just wait until the powers-that-be stop managing the equity markets ever higher. As Gregory Mannarino correctly points out all the time, "we ain't seen nothin' yet". This very worthwhile article from Pam and Russ Martens appeared on the wallstreetonparade.com Internet site on Friday morning sometime -- and the first person through the door with it was Dennis Miller. Another link to it is here.
![]()
Calling a Super Bubble: Front Row With Jeremy Grantham
For almost a half-century, value-investing icon Jeremy Grantham has been calling market bubbles. Now, he says U.S. stocks are in a “super bubble,” only the fourth in history, and poised to collapse. In this interview, Grantham, co-founder of Boston’s GMO, goes further, explaining his bubble analysis and discussing what he sees as multiple threats to the economy and the planet, including persistent inflation and climate change. He spoke exclusively with Erik Schatzker on Bloomberg’s “Front Row.”
This 37-minute video is definitely worth your time -- and I thank Mike Coombs for pointing it out last weekend. It was too long for my weekly column -- and for that reason it had to wait for today's column. Another link to this very worthwhile video interview is here.
![]()
The World is Changing -- Doug Noland
The global central bank community has been wrong on inflation. Their analysis lacked objectivity and analytical vigor. Groupthink. Flatfooted. That policymakers would so misjudge on something fundamental to monetary management is a major blow to credibility. And not to be on guard after unleashing trillions of new “money” is inexcusable. The inevitable serious fallout seemed to begin this week.
The global inflation problem has been obvious for months, though central bankers were loath to upset the markets. They were hoping it would resolve itself. In the pinnacle of “asymmetric” monetary policy, central bankers have been eager to move immediately with previously unimaginable monetary stimulus. Yet fear of market disruption compelled the most gradual approach to the unwinding of stimulus measures (i.e. the Fed and ECB continue today with QE programs).
Monetary inflation went much too far – then ran amuck. Over the past two years, unprecedented monetary stimulus pushed speculative asset Bubbles into historic manias. It also stoked inflationary dynamics that had already attained significant momentum from years of loose finance. Focused on market fragilities, central bankers were willing to dismiss inflation risk and stick with their newfound gradualist doctrine. And gradualism played an integral role in promoting only greater market excess, while ensuring dangerously deep-rooted inflation.
Following the ECB’s December 16th meeting, Christine Lagarde stated that “monetary accommodation is still needed for inflation to stabilize at our 2% inflation target over the medium term,” adding that it was “highly unlikely” the ECB would begin raising rates until at least 2023.
It's worth noting that German inflation was a stronger-than-expected 5.1% annualized during January. Spain reported CPI of 6.1%, Italy 5.3%, Austria 5.1%, and France 3.3%. They were left with no alternative. Christine Lagarde and the ECB had to pivot from an embarrassingly indefensible position.
February 3 – Financial Times (Martin Arnold and Tommy Stubbington): “Christine Lagarde refused to rule out raising interest rates this year in response to the European Central Bank’s ‘unanimous concern’ about soaring prices, fuelling increased investor bets that it will raise borrowing costs several times in 2022. The ECB president said inflation risks were ‘tilted to the upside’… She backed away from earlier comments playing down the chances of the bank raising rates in 2022 because of ‘the situation having changed’ and said it was ‘getting much closer’ to hitting its target on inflation."
In our age of levered global speculative finance, there are outsize costs associated with policy mistakes: too much excess-fueling leverage leads eventually to destabilizing de-risking/deleveraging dynamics. For a while now, periphery European debt markets have been at the epicenter of epic policy-induced market distortions. It was a bloody week.
Italian 10-year yields surged 46 bps this week to 1.75%, the high since May 2020. Greek yields jumped 40 bps to 2.25%, the highest level since April 2020, with yields already up 94 bps y-t-d. Yields surged 35 bps in Portugal (0.97%) and 34 bps in Spain (1.04%). French yields jumped 28 bps to 0.64% - the highest yield since January 2019. German yields rose 25 bps to a positive 0.21%, also the high since January 2019.
“Periphery” European debt (Italian and Greek in particular) have arguably been among the most mispriced sovereign bonds in the world. With Italy’s debt-to-GDP above 155% and Greece’s surpassing 200%, market repricing risk is extreme.
The significantly tighter financial conditions necessary to contain inflationary dynamics places the aged “tech” Bubble in peril. And the rapidly rising risk of faltering market and industry Bubbles will pressure a vulnerable corporate debt market. High-yield bond funds suffered outflows of $4.0 billion this past week. At $6.5 billion, January was a record month for high-yield fund outflows. Resilient throughout 2021, the junk bond market appears increasingly susceptible. We’ve witnessed the first crack in the equities Bubble. Things will turn more serious when the next leg of instability includes the interplay of a faltering corporate debt market.
Doug's weekly commentary is always a must read for me -- and today's version was posted on his website in the very early hours of Saturday morning PST. Another link to it is here. Gregory Mannarino's post market close rant for Friday is linked here -- and the usual "ADULT" rated sticker is appended.
![]()
"This is Alex Jones Territory!" Watch Reporter Shred Admin Spox Over 'Russian False Flag' Claims
Earlier on Thursday the Biden administration and US intelligence came out with some explosive and outlandish claims, saying Russia is planning to release a video depicting graphic scenes of a "staged false explosion with corpses, actors depicting mourners, and images of destroyed locations and military equipment," as CNN described it. This in order to justify a military invasion of Ukraine, given the false flag operation would feature Russian-backed separatists under attack by Ukrainian forces.
Given such a narrative has been advanced in public, grabbing global headlines, but without so much as a shred of evidence - even mainstream media pundits are scratching their heads. Watch Associated Press writer Matt Lee demolish the State Department's Ned Price, who refuses to provide any level of proof backing the bizarre and surprising claims. "This is like Alex Jones territory you're getting into now!" Lee points out...
Throughout the past month, both sides of the Ukraine crisis have accused the other of waging "information wars" - however, these new claims, complete with details of crisis actors and war scenes and corpses being "staged", have reached new levels of the absurd. U.S. Secretary of Defense spokesman John Kirby had told reporters earlier Thursday afternoon that "We do have information that the Russians likely to want to fabricate a pretext for an invasion - which again, is right out of their playbook."
The AP's Lee incredulously points this out to an increasingly agitated Ned Price, who doubles down during the testy exchange, even suggesting that anyone questioning the Biden admin narrative is merely being fed 'Russian disinformation'...
Lee challenged Price, saying the State Department had presented “no evidence” that Russia has actually created a “crisis actor” video and insisting that he wouldn’t be satisfied with the administration’s claims alone.
“If you doubt the credibility of the U.S. government, of the British government, of other governments and want to, you know, find solace in information that the Russians are putting out, that is for you to do,” Price responded.
Lee then pointed that given the extraordinary claims, some level of evidence is demanded given the mounting numbers of whopping government lies over the past two decades, including 'Iraq WMDs'.
This absolutely incredulous story was posted on the Zero Hedge website at 6:40 a.m. on Friday morning EST -- and I thank Brad Robertson for sharing it with us. Another link to it is here. I'm still laughing...!
![]()
Russia Mocks U.S. False Flag Video Accusation as "Delusional"
Russia has responded to the United States' elaborate and bizarre accusations that it will produce a propaganda false flag video to use a pretext to invade Ukraine, calling the U.S. narrative "delusional" and "nonsense". "The delusional nature of such fabrications — and there are more and more of them every day — is obvious to any more or less experienced political scientist," Foreign Minister Sergey Lavrov said in televised remarks Friday.
"It’s not my call to guess why our Western colleagues can be surprised now," Lavrov added. "They are surprised with or without reason, mostly for no reason, or at some reasons that they make up themselves."
Referring to a U.S. State Department explanation on Thursday, which was met with considerable push-back even from U.S. mainstream reporters, Lavrov described, "I saw on the Internet some statements by the Department of State that Russia was plotting to film some fake videos of an alleged Ukrainian attack on the Donbass. The craziness of such ideas... is obvious to any more or less experienced political scientist," the Russian top diplomat said.
When pressed for evidence by AP journalist Matt Lee, the State Department's Ned Price tried to shut down the line of inquiry by suggesting Lee and other skeptics "find solace in information that the Russians are putting out" - to which Lee audibly laughed, given he was the most veteran American journalist in the room.
Earlier on Thursday the Biden administration and U.S. intelligence came out with some explosive and outlandish claims, saying Russia is planning to release a video depicting graphic scenes of a "staged false explosion with corpses, actors depicting mourners, and images of destroyed locations and military equipment," as CNN described it. The story was featured initially in The Washington Post and New York Times - and as usual was anonymously sourced to "officials say...".
Separately on Friday, Putin spokesman Dmitry Peskov told reporters, "I’d recommend not to take anyone’s word for it, especially the State Department, when it comes to these issues."
That's good advice, dear reader. This Zero Hedge news item showed up on their Internet site at 9:40 a.m. EST on Friday morning -- and I thank Brad Robertson for sharing it with us. Another link to it is here. If you want to read what started this whole charade...here's an article about this posted on theguardian.com website on Thursday evening GMT and headlined "Russia plans ‘very graphic’ fake video as pretext for Ukraine invasion, U.S. claims". I thank Patricia Caulfield for that one.
![]()
America’s Putin Psychosis -- Scott Ritter
The war of words between Russia and the United States over Ukraine escalated further on Tuesday as Russian President Vladimir Putin responded for the first time to the U.S. written reply to Russia’s demands for security guarantees that were expressed in the form of a pair of draft treaties submitted by Moscow to the U.S. and NATO in December.
“It is already clear…that the fundamental Russian concerns were ignored. We did not see an adequate consideration of our three key requirements,” Putin said at a press conference that followed his meeting with Hungarian Prime Minister Viktor Orban in Moscow.
Putin said the U.S. had failed to give “adequate consideration of our three key demands regarding NATO expansion, the renunciation of the deployment of strike weapons systems near Russian borders, and the return of the [NATO] bloc’s military infrastructure in Europe to the state of 1997, when the Russia-NATO founding act was signed.”
He detailed what he alleged was NATO’s long history of deception, re-emphasizing the 1990 verbal commitment by former U.S. Secretary of State James Baker that NATO would not expand “an inch” eastward. “They said one thing, they did another,” Putin said. “As people say, they screwed us over, well they simply deceived us.”
With some 130,000 Russian troops deployed in the western and southern military districts bordering Ukraine, and another 30,000 assembling in neighboring Belarus, U.S. policy makers are scrambling to figure out what Russia’s next move might be, a choice most U.S. policy makers believe boils down to diplomacy or war.
Rather than examine the situation from the perspective of Russian national security interests, however, these officials have placed the fate of European peace and security in the hands of a single individual: Vladimir Vladimirovich Putin.
This very interesting and very worthwhile, but somewhat longish commentary from Scott put in an appearance on the consortiumnews.com Internet site on Wednesday -- and I thank Michael Riedel for bringing it to my attention -- and now to yours. Another link to it is here.
![]()
January silver imports into Gujarat India surge six fold
Ahmedabad: Anticipating higher returns on silver, investors increasingly turned to procuring silver in January. As silver prices plunged to a low of Rs 61,000 per kilogram, the precious metal has once again caught the investor's eye. In January 2022, 141 metric tonnes/4.53 million troy ounces was imported into Gujarat, according to data by Ahmedabad Air Cargo Complex...up six fold compared to 20 metric tonnes in December of 2021.
Higher procurement for industrial use in addition to procurement by jewellers and bullion traders has pushed the demand up, suggest analysts. Silver price stood at Rs 62,500 per kilogram on Thursday.
"Investors anticipate silver prices to touch Rs 70,000 mark per kg in the days to come and therefore, as the prices plunged, investments into silver increased.
Investors are anticipating the better returns in days to come as the prices firm up further on," said Haresh Acharya, director, India Bullion and Jewellers' Association.
This brief, but very worthwhile silver-related news item, filed from Ahmedabad at 7:41 a.m. IST on their Friday morning, is definitely worth skimming. It's not the whole Indian silver market of course, but is encouraging nonetheless. This Economic Times of India news item is also linked here.
![]()
The Photos and the Funnies
Here are the next four hummingbird photos from right outside our room at the somewhat rustic Canyon Alpine Motel in Boston Bar on May 1 of last year. It was cloudy, but just enough sunlight got through to brighten up the gorgets on malerufous hummingbirds, without blowing out the sensor in my camera when the ambient light caught them just right. There were hummingbird feeders everywhere -- and multiple hummingbirds at each one at all times. The last one is a cropped photo, so you can see more detail. I'll have more and even better ones in my Tuesday column. They're such itty bitty things...almost like large insects. Click to enlarge.


![]()
The WRAP
“We are not afraid to entrust the American people with unpleasant facts, foreign ideas, alien philosophies, and competitive values. For a nation that is afraid to let its people judge the truth and falsehood in an open market, is a nation that is afraid of its people.” – John Fitzgerald Kennedy 2/26/62
![]()
I'm hours behind, so today's pop 'blast from the past' is one I've posted before a couple of times over the years -- as I just don't have the time to go searching for something different. I consider this greatest rock song to come out of Canada...ever -- and Mike Reno and the boys are still belting it out all over North America 42 years later. The link is here -- and the bass cover for it is here. I also stumbled across a stunning lead guitar cover of it as well -- and it just rocks...pardon the pun. The link to that is here. This song is far more structurally complex than I once thought.
Today's classical 'blast from the past dates from 1880...but had been in the works, mostly on paper, for the prior eleven years before it manifested itself in the final form that we know today. It's Pyotr Ilyich Tchaikovsky's "Romeo and Juliet" based on the Shakespearean play of the same name. Although styled an 'Overture-Fantasy' by the composer, the overall design is a symphonic poem in sonata form with an introduction and an epilogue.
Here's the Netherlands Radio Philharmonic Orchestra, led by conductor Slobodeniouk in a live performance on Friday the 16th of November 2018. It's a first class audio and video recording -- and the link is here.
![]()
One again the commercial traders of whatever stripe were at the ready when the phony baloney jobs report hit the tape at 8:30 a.m. in New York on Friday morning. Hiding behind another engineered dollar index rally, they bashed the snot out of the Managed Money traders et al. once more with feeling going into the weekend.
Except in palladium, they didn't really change things from a future market perspective in silver or gold, as both are pretty much washed out to the downside already.
Gold and silver were allowed to close higher on the day, with gold now sitting on its 200-day moving average -- and silver still a meaningful distance below its 50-day.
It's for good reason that the Big 8 commercial shorts want to keep the silver price under wraps for as long as possible, because a major blow-out in its price would instantly expose the physical shortage at both the wholesale and retail level. But they can't keep it up forever.
Platinum was closed a bit further below its 200-day moving average for the second day in a row. It's a very bifurcated market in the commercial category of the COT Report, as the Producer/Merchants are mega short -- and the Swap Dealers are net long the platinum market by a bit. Why that's the case, I don't know...however, platinum is still the Big 8 shorts No. 2 problem child behind silver from a COMEX futures market perspective. Check the 'Days to Cover' chart further up if you doubt me.
The commercial traders have now closed palladium below its 200-day moving average for the second consecutive trading session. It definitely wants to rally, but 'da boyz' are having none of it.
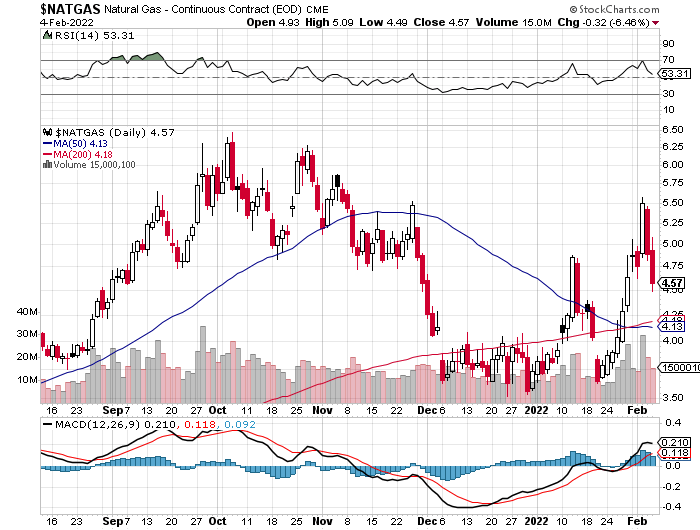
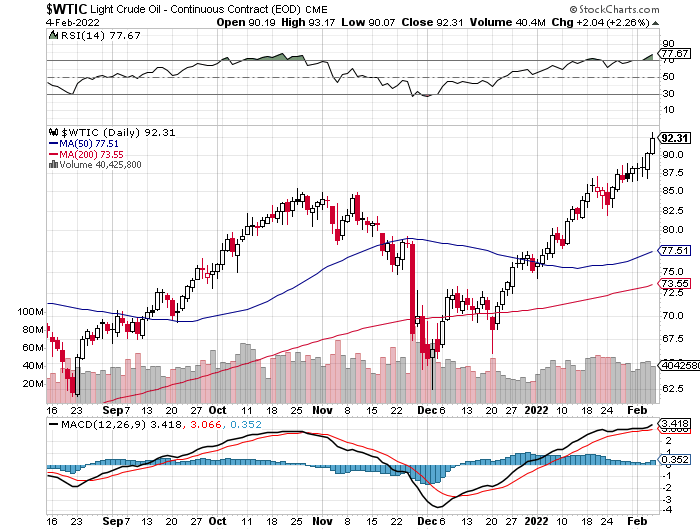
Copper closed up 2 cents -- and natural gas, chart included, got hammered for a second day in a row...down 32 cent/1,000 cubic feet...down almost a dollar/per since Wednesday. But WTIC, now in very overbought territory, closed up another $2.04/barrel -- and is now at $92.31/per in its current front month.
Here are the 6-month charts for the Big 6+1 commodities, thanks to the fine folks over at the stockcharts.com Internet site. And if you have the interest, their Friday price action should be noted. Click to enlarge.
The 'everything bubble' looked to be on the verge of collapse this past week.
The stock market is now totally dysfunctional, thanks to the PPT...as is the managed interest rate in the U.S. 10-Year Treasury yield...courtesy of the Fed -- and one can toss in the the current ''value" of the U.S. dollar index as well. Of course that's been the case for a long time, so I'm telling you anything that don't already know. But the powers of the printing press at the Federal Reserve and other of the world's central banks appear to have reached their limits, although it's been equally obvious that the Plunge Protection Team has been at battle stations almost 24/7 for years now.
From an economic, financial and monetary standpoint, the entire planet has become one gigantic Potemkin village -- and with a 'best before use' date that has long since passed.
How long they can keep this whole charade going is anyone's guess, but it's priced to perfection for a collapse of Biblical proportions, either by design, or circumstance...with the former precipitating the latter...a statement I've made quite often over the last few years.
But from a precious metals price perspective, the 800 lb. gorilla in the living room is the short position held by the Big 8 commercial shorts, plus other -- and although they were able to help their cause in this week's COT Report -- and maybe a bit since the Tuesday cut-off, the door is shut from a COMEX futures market perspective.
Yes, I suppose they could continue their bear raids of a kind that have come ever more frequently lately. But the fact of the matter is, as Ted has mentioned countless times over the years -- and that is there comes a point when the Managed Money traders et al. in the Non-Commercial category will no longer be prepared to sell longs or go short -- and once that point is reached, the commercial traders can do no more. The price bottoms are in -- and the Big shorts are stuck with what they have left.
There is a partial way out that Ted has spoken of several times over the years -- and that is if the Big shorts can convince their smaller counterparts...his raptors, the small commercial traders other than the Big 8 shorts...principally the Big 4...to sell their long positions to them.
As you know, these smaller traders are mega long both silver and gold. However, arranging such a transaction would be an act of collusion. But since the commercial traders as a whole are a group of thieves, I'd put nothing past them...all aided and abetted by the equally corrupt CME Group and the CFTC if it does come to pass.
That would get them mostly off the hook -- and the rest of the shorts, including most of the commercial traders in the Big '5 through 8' category, would be thrown to the wolves.
That eventuality, as Ted has pointed out in the past, has not occurred yet. But this price management scheme is something that has long outlived its usefulness -- and the Big 8 shorts, some of which are 'too big to fail' banks, have to get out whole just to save their own hides.
What we are witness to now is the death throes of this 50-year price suppression scheme -- and the miners and us investors, are just collateral damage.
But what it has spawned in the process, has written a new law in the book of unintended consequences -- and that's the arrival of the reddit.com/WallStreetSilver crowd. Not in my wildest imaginations could I have thought something like that was possible -- and they ain't going away.
They are now an ever-accelerating force to be reckoned with in the silver world -- and are now buying these dips with abandon, as they've lost all fear. It's a sure bet that the Big 8 commercial shorts, the CME Group and the CFTC are more than aware of their presence now.
This, along with growing industrial demand, is yet another reason why the powers-that-be want out of this short position trap of their own making -- and before it becomes their undoing.
It's yet another reason why I'm still "all in" -- and will remain that way to whatever end.
I'm done for the day -- and the week -- and I'll see you here on Tuesday.
About the author

SUBSCRIBE: https://edsteergoldsilver.com/

Ed Steer’s Daily Analysis of the Gold and Silver Markets
After eight years of writing about the precious metals for Casey Research, the folks at Stansberry & Associates—who just recently purchased controlling interest in the company—decided that my ‘niche market’ column didn’t fit into their plans.
Since the time that Casey Research was kind enough to offer me a stand-alone column, it became their most highly-rated blog almost from the outset—and has remained that way up to this date...