There was a definite trend change in precious metal sentiment and investment demand in June as the market senses financial turmoil on the horizon. Each day we see another announcement from Main Stream financial sources warning of upcoming systemic risk in the markets.
For example, Goldcore published the article “Hold “Physical Cash,” “Including Gold and Silver” To Protect Against “Systemic Risk” – Fidelity”, stating:
A fund manager for one of the largest mutual fund and investment groups in the world, Fidelity, has warned investors and savers to have an allocation to “physical cash,” “including precious metals” to protect against “systemic risk”.
Then we had this from Zerohedge the very same day, “$140 Billion Bond Fund Goes To Cash As It “Braces For Bond-Market Collapse”:
Recently, it’s become readily apparent that some of the world’s top money managers are getting concerned about what might happen when a mass exodus from bond funds collides head on with a completely illiquid secondary market for corporate credit.
Furthermore, we have the continued threat of a Greek exit of the European Union. With the tremendous amount of volatility in the movement of bond yields over the past month, the Mother of all Black Swans may finally take place in the latter part of the year.
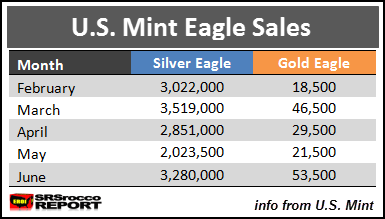
It seems as if precious metals investors can sense this as sales of Gold and Silver Eagles spiked in June. Gold and Silver Eagle sales jumped considerably higher from May:
Silver Eagle sales up until June 23rd are already 3.28 million oz (Moz), surpassing the total 2 Moz sold for May. Gold Eagle monthly sales are the second highest this year at 53,500, compared to 21,500 sold last month. The trend change looks even more clear when we look at sales of Gold and Silver Eagles since February:
With a week of sales remaining, Silver Eagle purchases in June will likely be the highest month (excluding high January sales) surpassing March’s record of 3.5 Moz. Also, we can see that Gold Eagle sales in June are the highest compared to the previous four months.
THE SILVER CHART REPORT Rolls Out Next Week
 Lastly, I wanted to mention the release of THE SILVER CHART REPORT next week. The report has 48 silver charts from some of my work over the past six years (all updated), including many new ones never seen before.
The report includes a silver price chart that I believe no one (or very few) in the precious metal community has ever seen before. Even though my readers have seen a few of my silver price charts in previous articles, this one is brand new. One look at this chart, and the investor will clearly see why silver traded a certain way over the past 100+ years.
THE SILVER CHART REPORT is made up of five sections that cover the silver market and industry like no other single publication on the internet.
Please check back for new articles and updates at the SRSrocco Report. You can also follow us at Twitter below:


