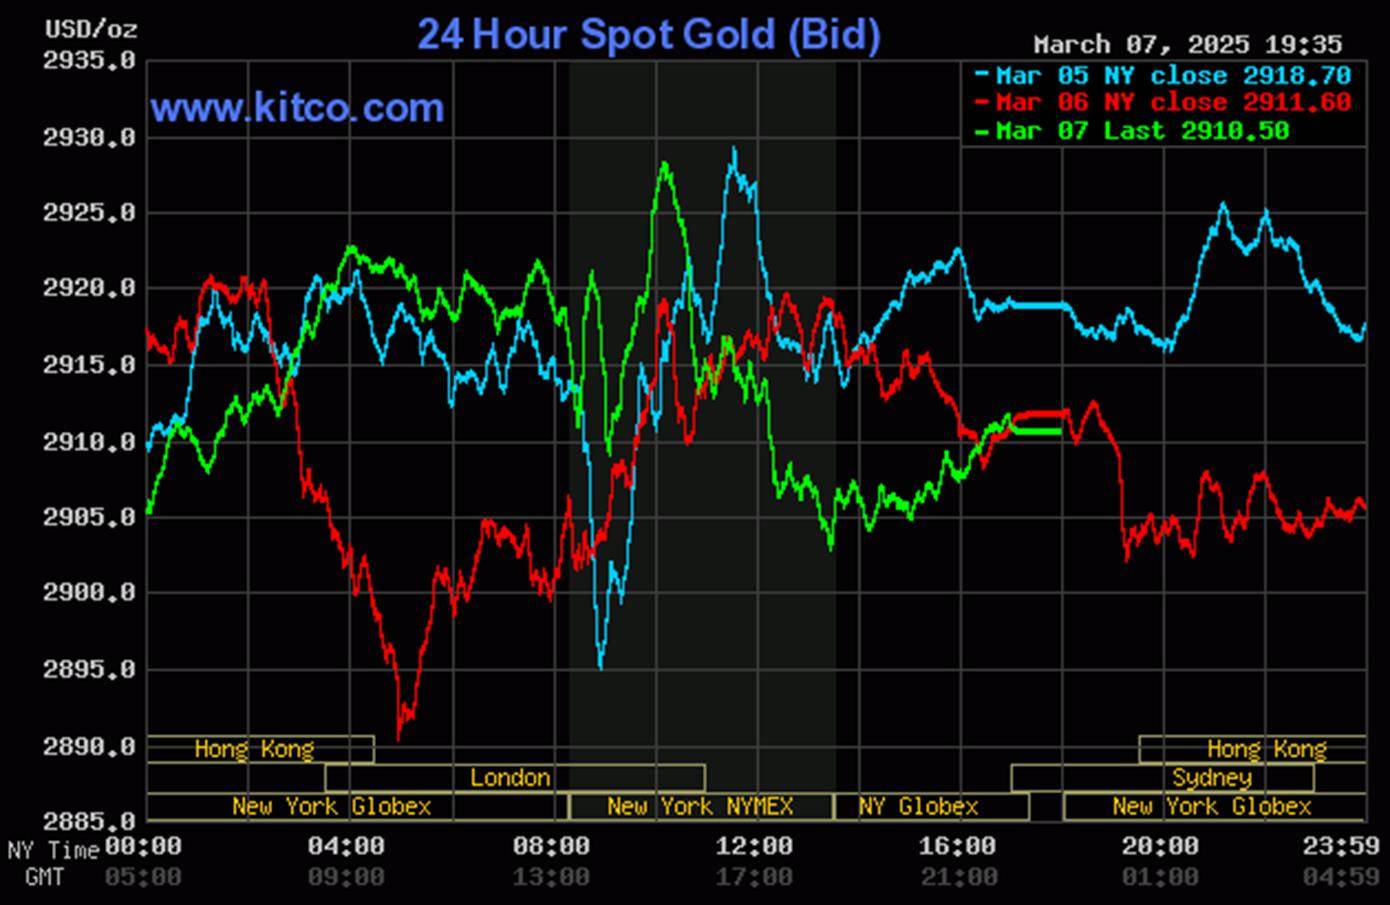
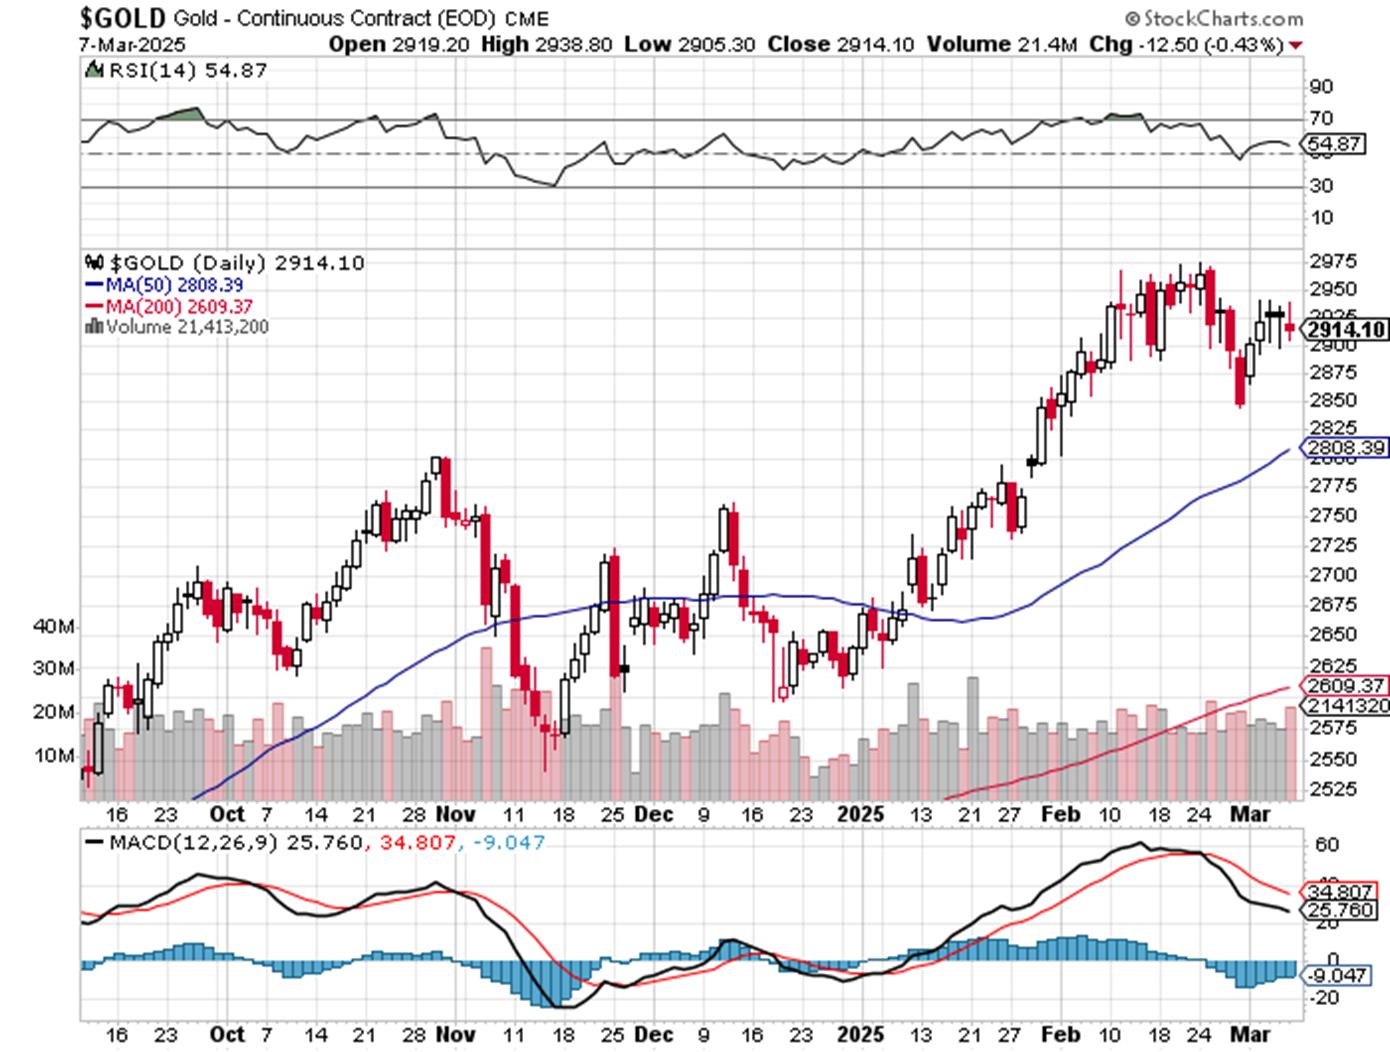
The gold price was smacked lower at 7 p.m. EST in Globex trading in New York on Thursday evening -- and from that point it struggled higher at an ever-increasing rate until the commercial traders of whatever stripe showed up at 9 a.m. in London. It was engineered/sold unevenly lower from there until the non-farm payroll report hit the street at 8:30 a.m. in Washington. It was a wild ride from that point until 'da boyz' capped its high tick of the day at the 10 a.m. EST afternoon gold fix in London -- and once that was done, 'da boyz' went work anew...engineering it lower until a minute before the 1:30 p.m. COMEX close. It then crept quietly higher from there until trading ended at 5:00 p.m. EST.
The high and low ticks in gold, both of which were set in New York, were recorded as $2,938.80 and $2,905.30 in the April contract...an intraday move of $33.50 an ounce. The April/June price spread differential in gold at the close in New York yesterday was $28.80...June/August was $25.40...August/October was $24.20 -- and October/December was $23.30 an ounce.
Gold was closed on Friday afternoon in New York at $2,910.50 spot...down $1.10 from Thursday -- and 20 bucks off its Kitco-recorded high tick. Net volume was only a bit on the heavier side at a bit over 166,000 contracts -- and there were a bit under 72,000 contracts worth of roll-over/ switch volume out of April and into future months in this precious metal...mostly into June and August.
I saw that 531 gold, plus 926 silver contracts were traded in March yesterday -- and it will be interesting to see just how much of those amounts show up in tonight's Daily Delivery and Preliminary Reports.
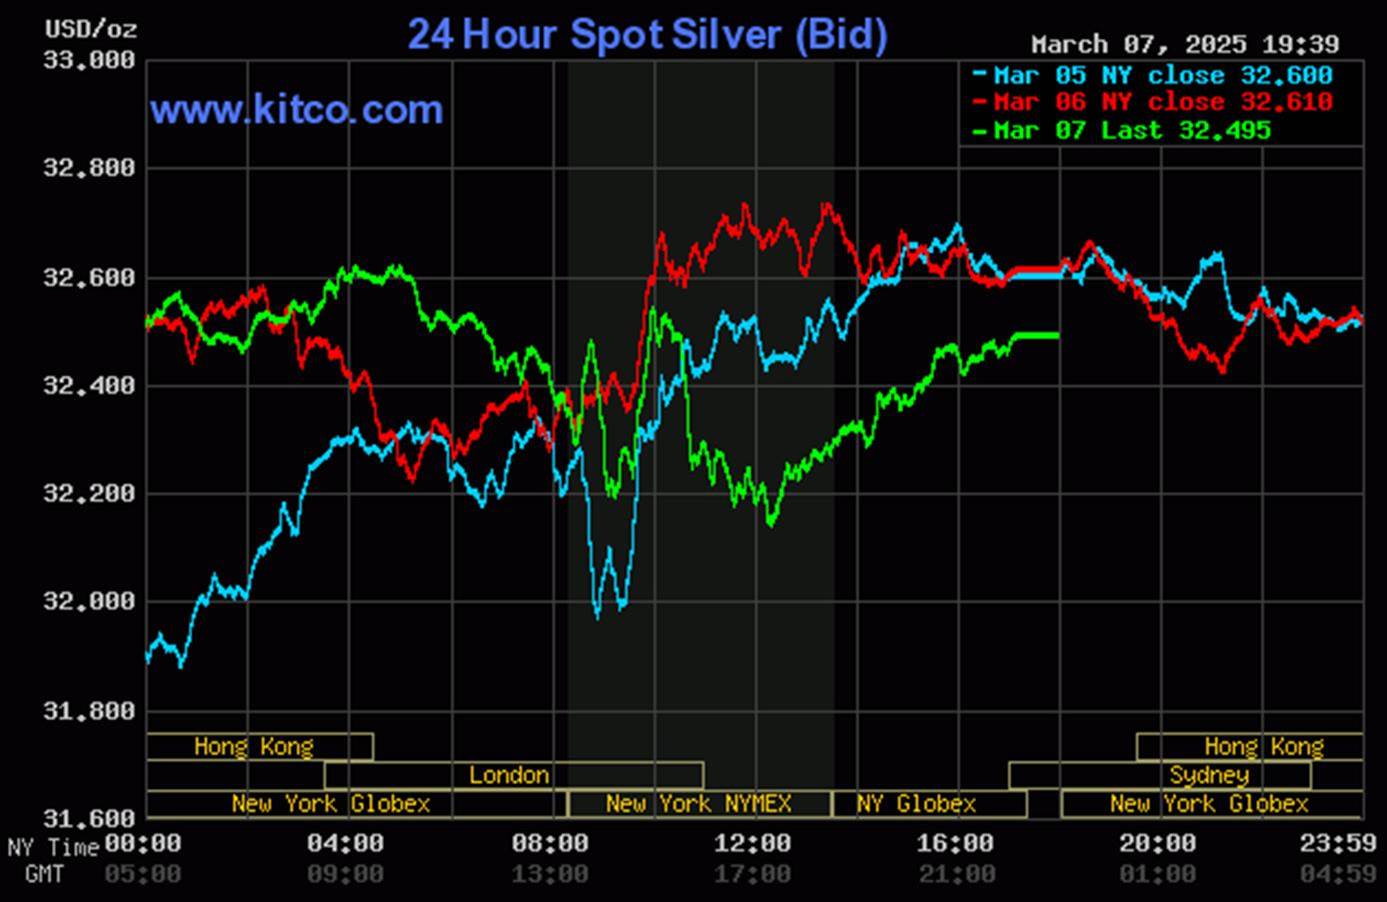
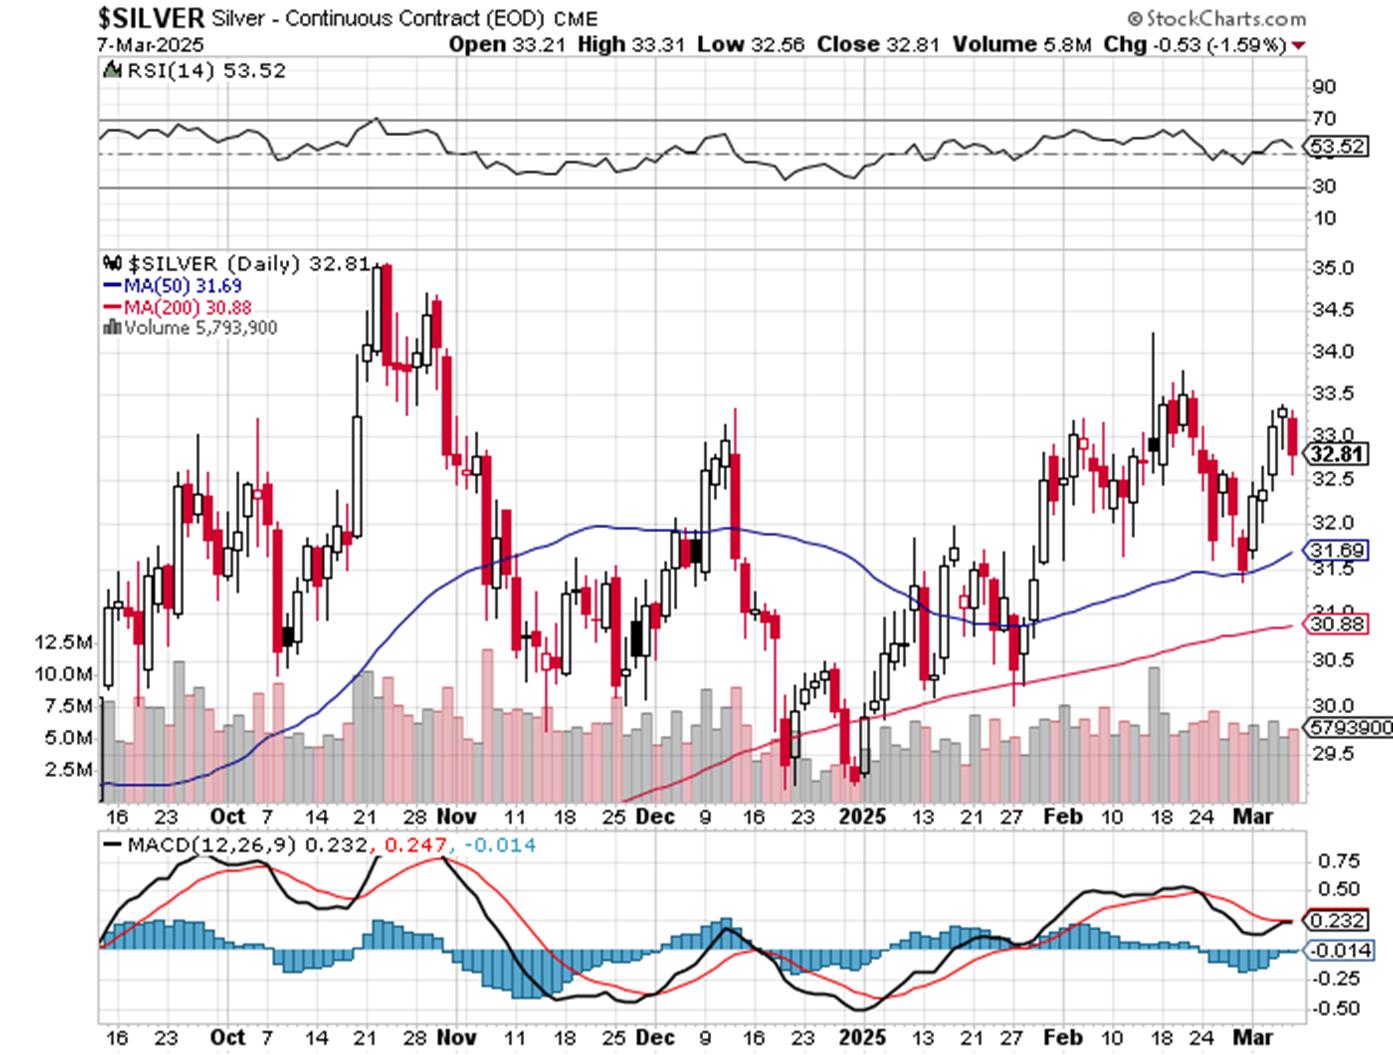
Silver was sold quietly lower until minutes after 10 a.m. China Standard Time in Globex trading on their Friday morning -- and it then struggled higher until it hit the unchanged mark minutes before 9 a.m. in London. It was turned sideways at that juncture -- and around 10:15 a.m. GMT it was turned lower -- and then went through the same price gyrations as gold once the jobs report appeared at 8:30 a.m. in COMEX trading in New York. Its New York high was also at the 10 a.m. EST afternoon gold fix in London -- and it was engineered lower in price from that point until 12:15 p.m. EST. From that point it crawled quietly and steadily higher until the market closed at 5:00 p.m. EST.
The high and low ticks in silver were reported as $33.31 and $32.56 in the May contract...an intraday move of 75 cents. The March/May price spread differential in silver at the close in New York yesterday was 26.1 cents...May/ July was 30.1 cents...July/September was 29.0 cents -- and September/ December was 39.5 cents an ounce.
Silver was closed in New York on Friday afternoon at $32.495 spot...down 11.5 cents on the day -- and 17.5 cents off its Kitco-recorded high tick. Net volume was a touch on the lighter side at around 52,500 contracts -- and there were around 7,100 contracts worth of roll-over/switch volume on top of that.
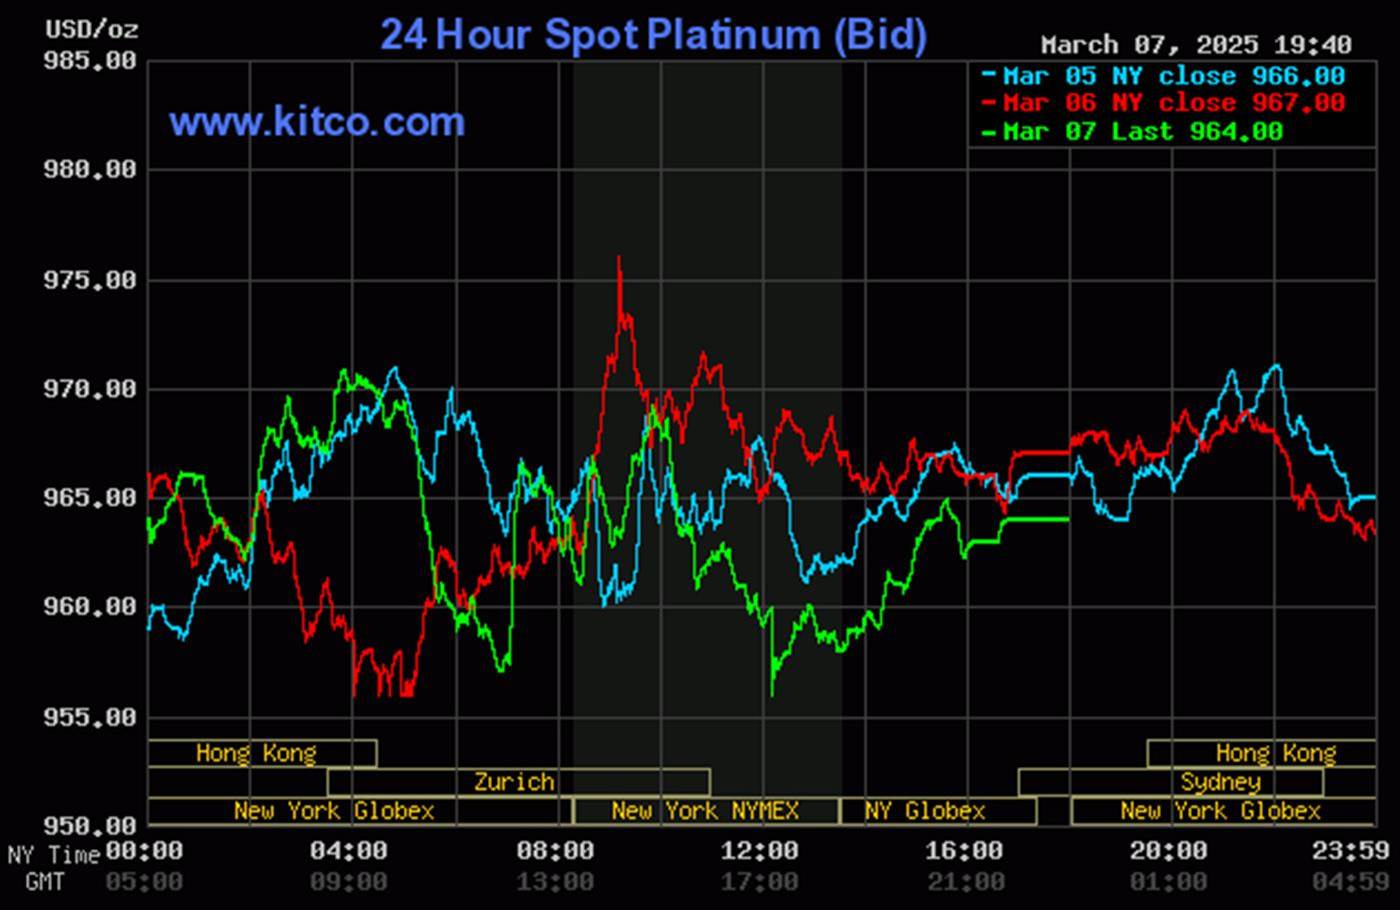
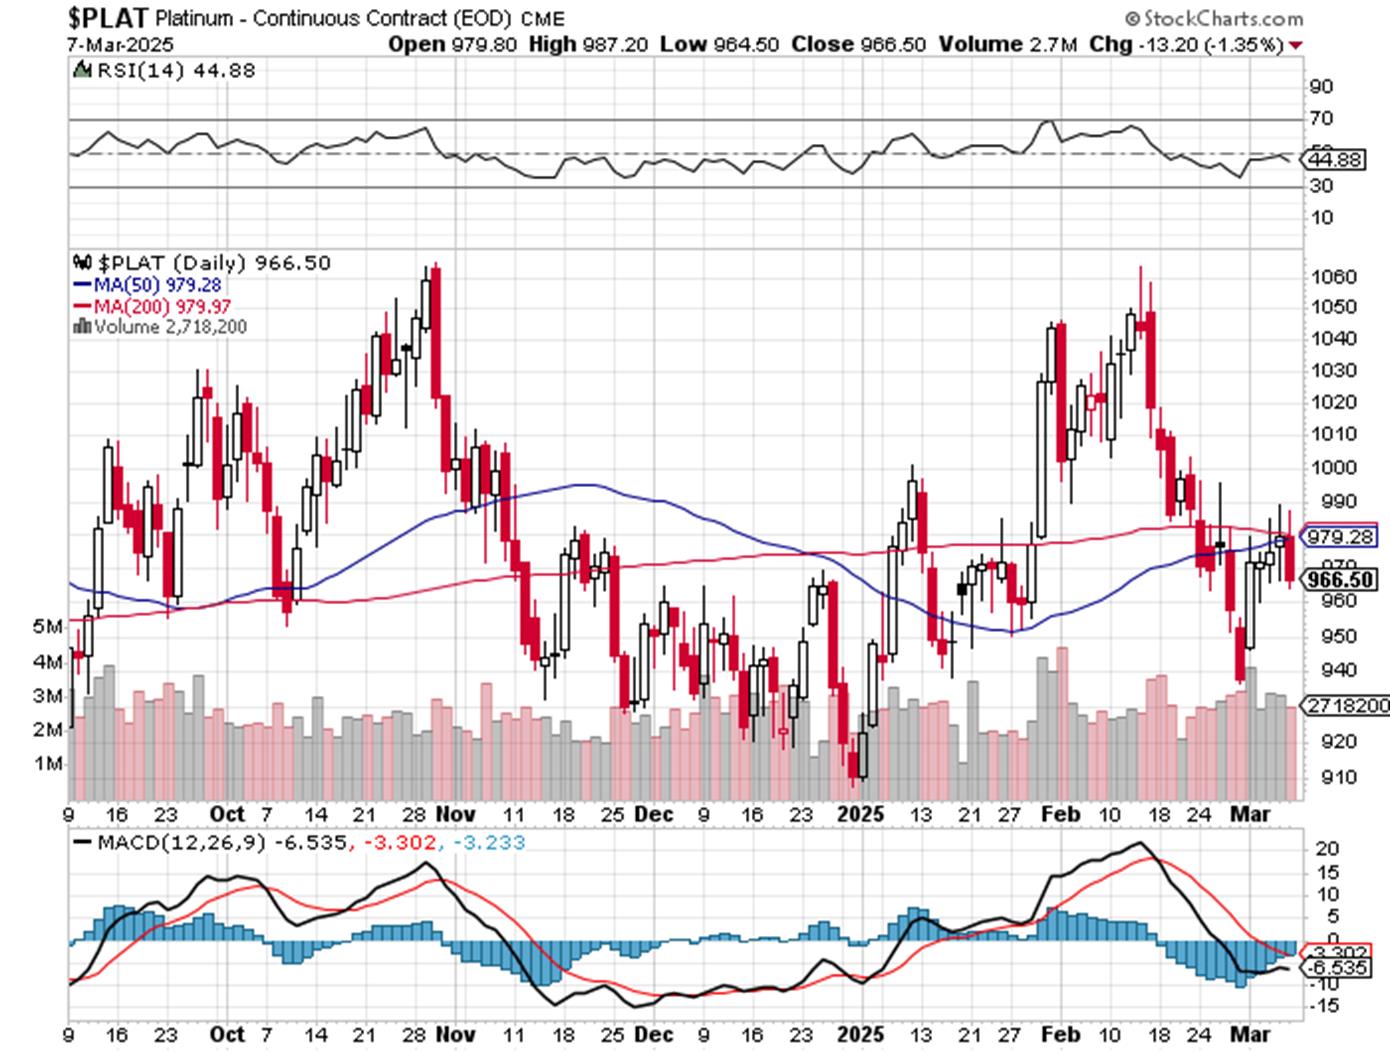
Platinum had an uneven and descending up/down move in early Globex trading that ended minutes before 2 p.m. China Standard Time on their Friday afternoon...followed by another uneven and descending up/down move that ended at 1 p.m. CET in Zurich. It chopped unevenly higher from that juncture until its rally was also capped at the 10 a.m. EST afternoon gold fix in London. It was sold/engineered lower from that point until around 12:10 p.m. -- and chopped quietly higher from there until the market closed at 5:00 p.m. EST. Platinum was closed at $964 spot...down 3 dollars from Thursday.
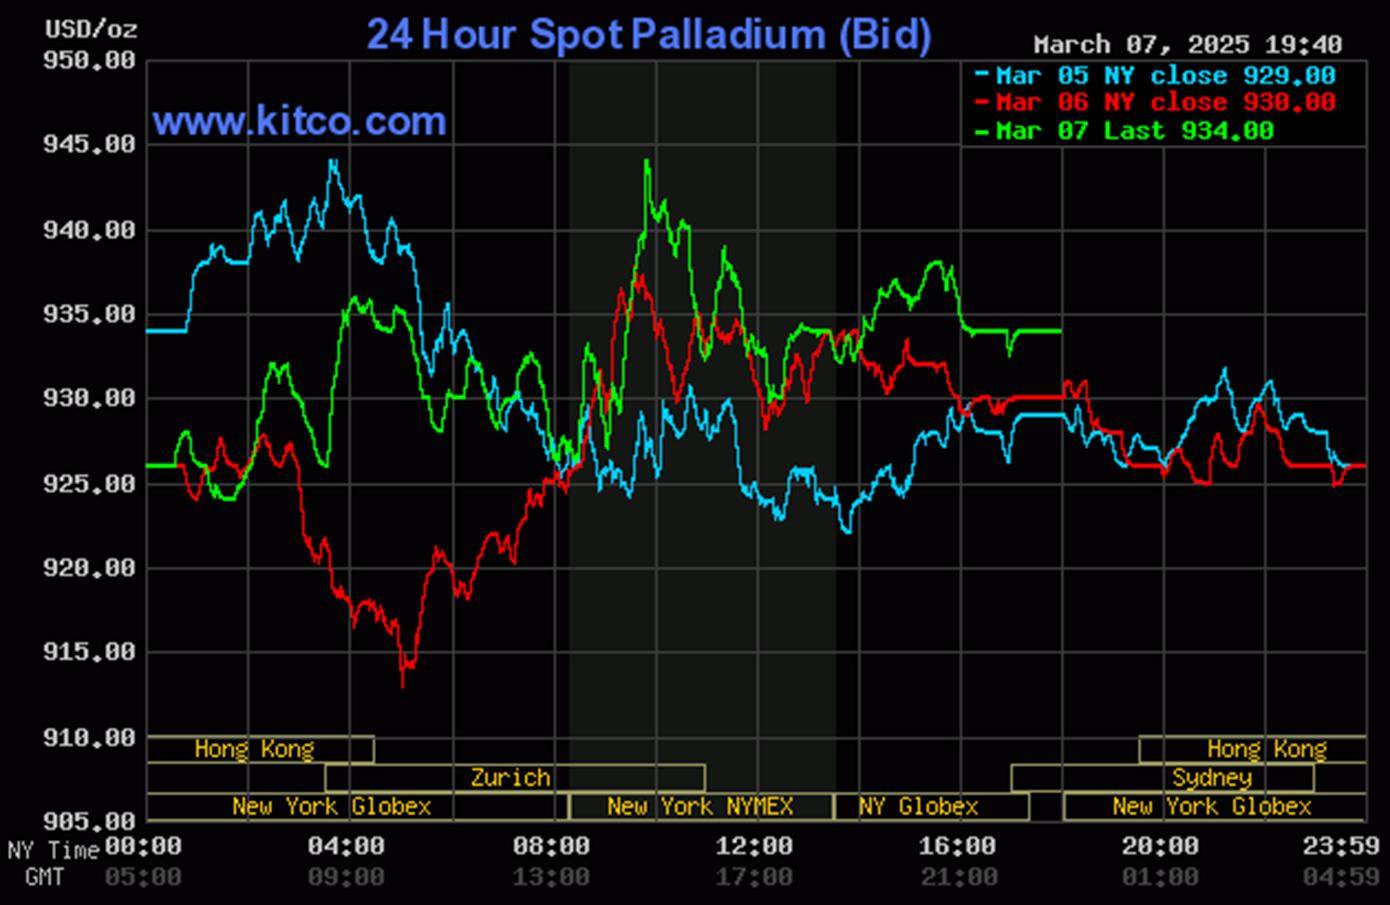
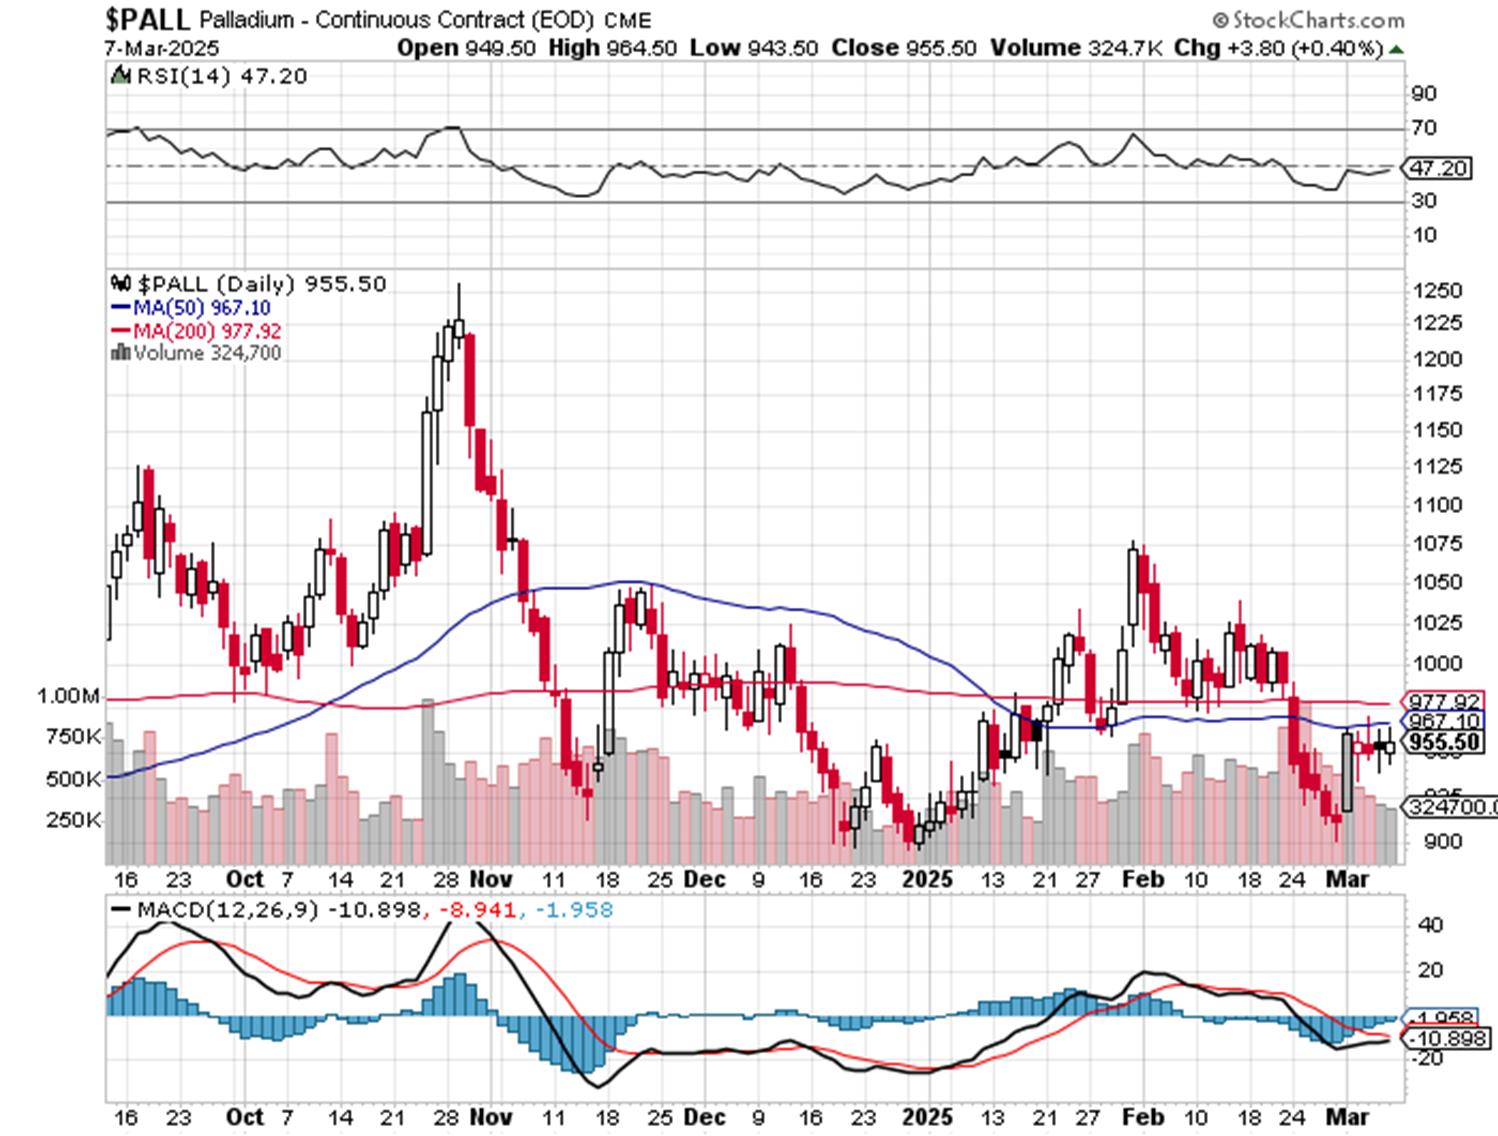
Palladium was sold quietly, broadly and unevenly lower until, like palladium, began to rally starting a few minutes before 2 p.m. China Standard Time on their Friday afternoon. Its up/down move from there ended at 8:30 a.m. in New York -- and its ensuing rally also ran into 'grief' at the 10 a.m. EST afternoon gold fix in. It was engineered/sold lower, also like platinum, until 12:10 p.m. It then had a quiet and ascending up/down move that ended at 5:00 p.m. EST. Palladium was allowed to close up 4 bucks on the day at $934 spot.
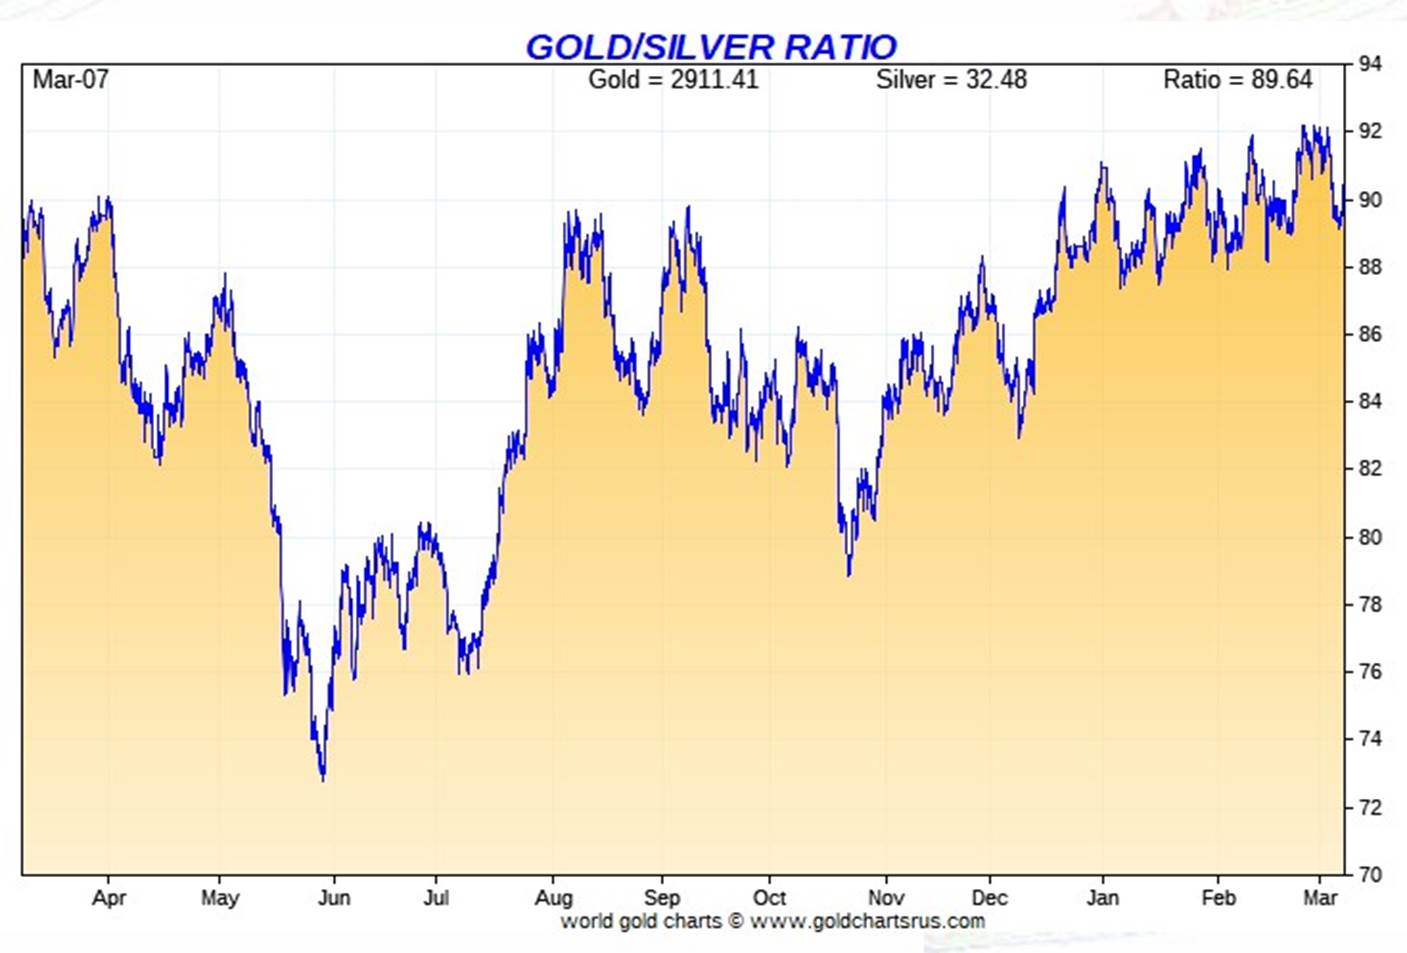
Based on the kitco.com spot closing prices in silver and gold posted above, the gold/silver ratio worked out to 89.6 to 1 on Friday...compared to 89.3 to 1 on Thursday.
Here's the 1-year Gold/Silver Ratio Chart...courtesy of Nick Laird. Click to enlarge.
![]()
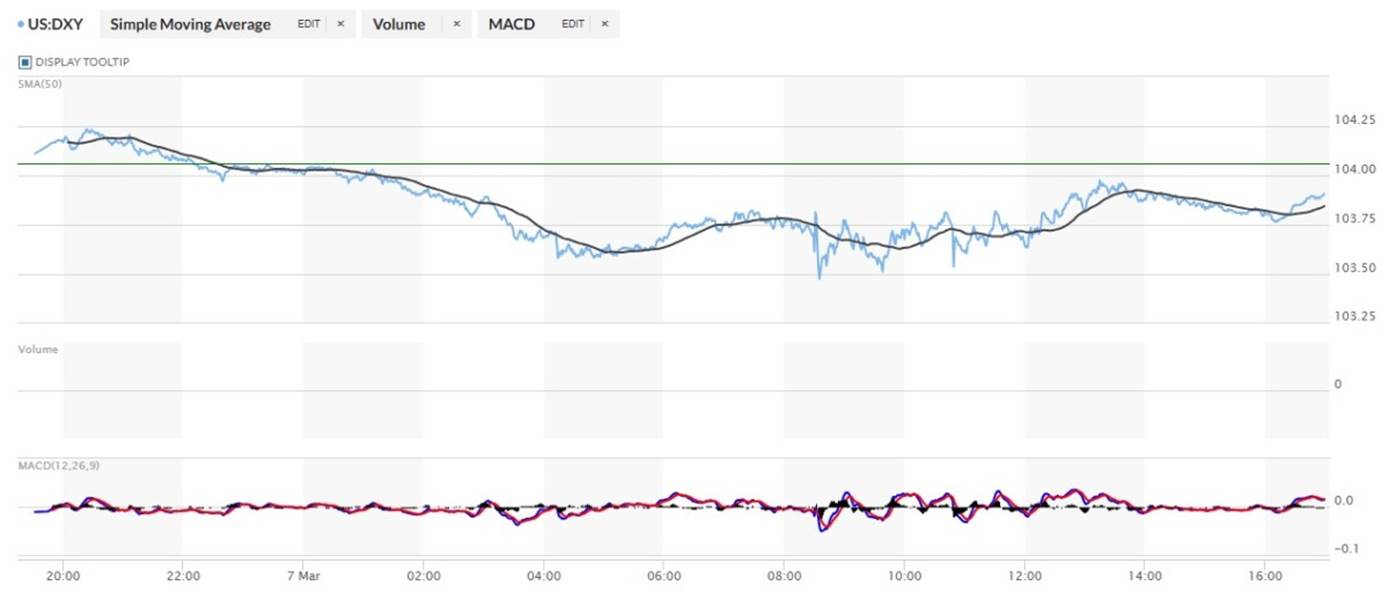
The dollar index closed very late on Thursday afternoon in New York at 104.06 -- and then opened higher by 5 basis points once trading commenced at 7:32 p.m. EST on Thursday evening...which was 8:32 a.m. China Standard Time on their Friday morning. It then edged a bit higher until its high tick of the day was set at 9:24 a.m. CST. From that juncture it wandered very quietly and evenly lower until around 9:15 a.m. in London. From that point it wandered/chopped sideways to a bit lower until around 10:50 a.m. in New York. Its quiet and bit uneven rally from that point ended at 1:15 p.m...crept lower until 4:10 p.m. -- and then edged a tad higher until the market closed at 5:00 p.m. EST.
The dollar index finished the Friday trading session in New York at 103.84...down 22 basis points from its close on Thursday.
Here's the DXY chart for Friday...thanks to marketwatch.com as usual. Click to enlarge.
![]()
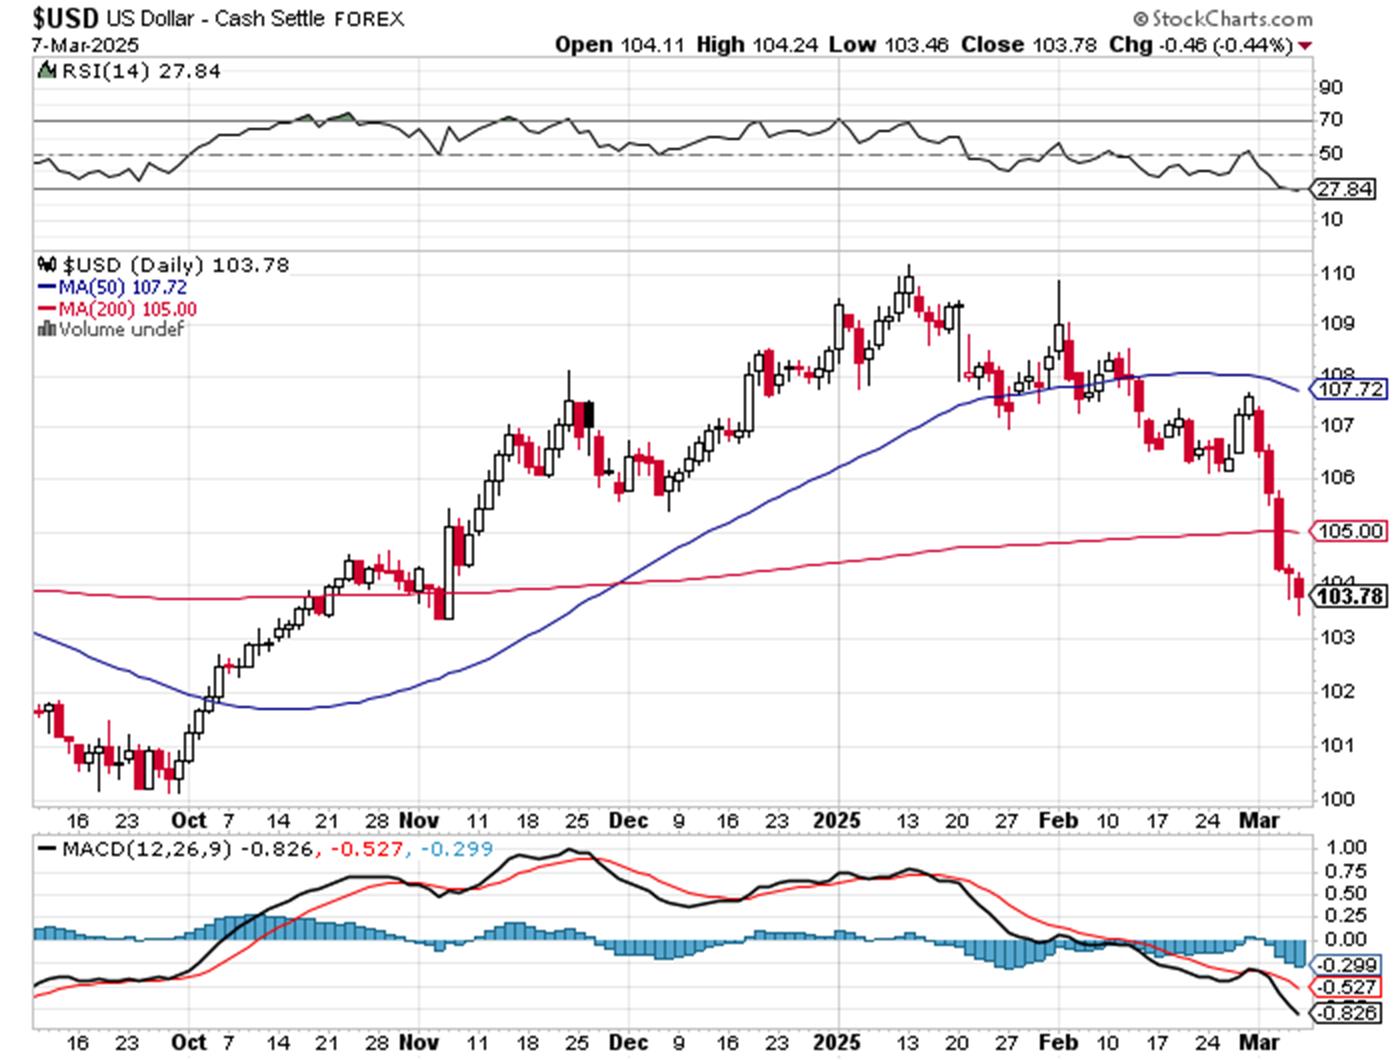
Here's the 6-month U.S. dollar index chart...courtesy of stockcharts.com as always. The delta between its close...103.78..and the close on DXY chart above, was 6 basis points below that. Click to enlarge.
![]()
It mattered little what the dollar index did yesterday, as the collusive commercial traders of whatever stripe didn't allow precious metal prices to reflect any of the bad news that came out yesterday.
U.S. 10-year Treasury: 4.3170%...up 0.0310/(+0.7233%)...as of the 1:59:51 p.m. CST close
The ten-year closed higher by 8.6 basis points on the week.
Here's the 5-year 10-year U.S. Treasury chart from the yahoo.com Internet site -- which puts the yield curve into a somewhat longer-term perspective. Click to enlarge.
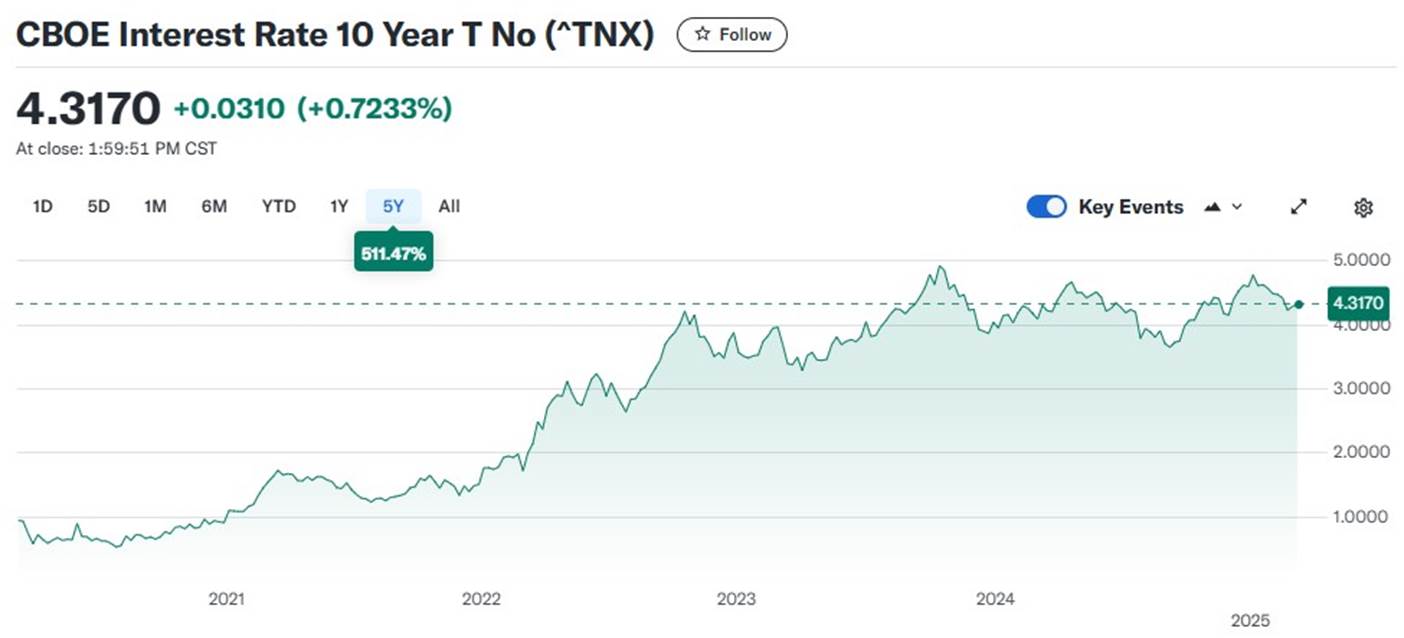
As I continue to point out in this spot every week, the 10-year hasn't been allowed to trade above its 4.92% high tick set back on October 15, 2023 -- and it's more than obvious from the above chart that it will he held at something under 5% until further notice, as yield-curve control is now the order of the day. That's despite the soaring yields in Europe...especially in the German bund.
![]()
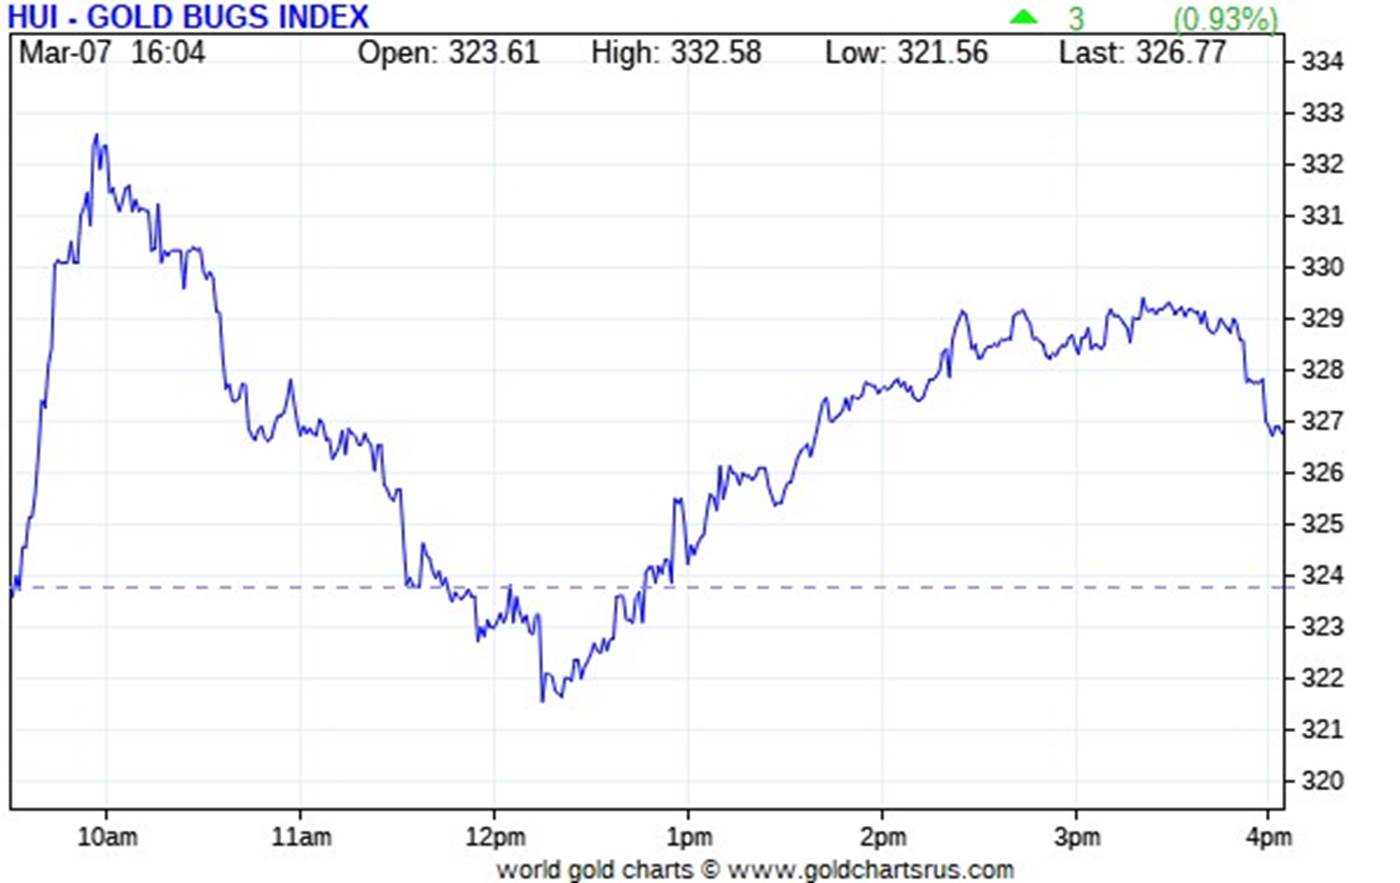
The gold shares took off higher right from the 9:30 opens of the equity markets in New York on Friday morning -- and topped out about five minutes before the 10 a.m. EST afternoon gold fix in London. Even though the gold price was engineered lower until the 1:30 p.m. COMEX close, the gold shares began to rally at 12:15 p.m...but at an ever-decreasing rate for the next two hours. They then traded flat for a bit until the day traders took profits in the last few minutes before the markets closed at 4:00 p.m. EST. The HUI managed to close higher by 0.93 percent.
![]()
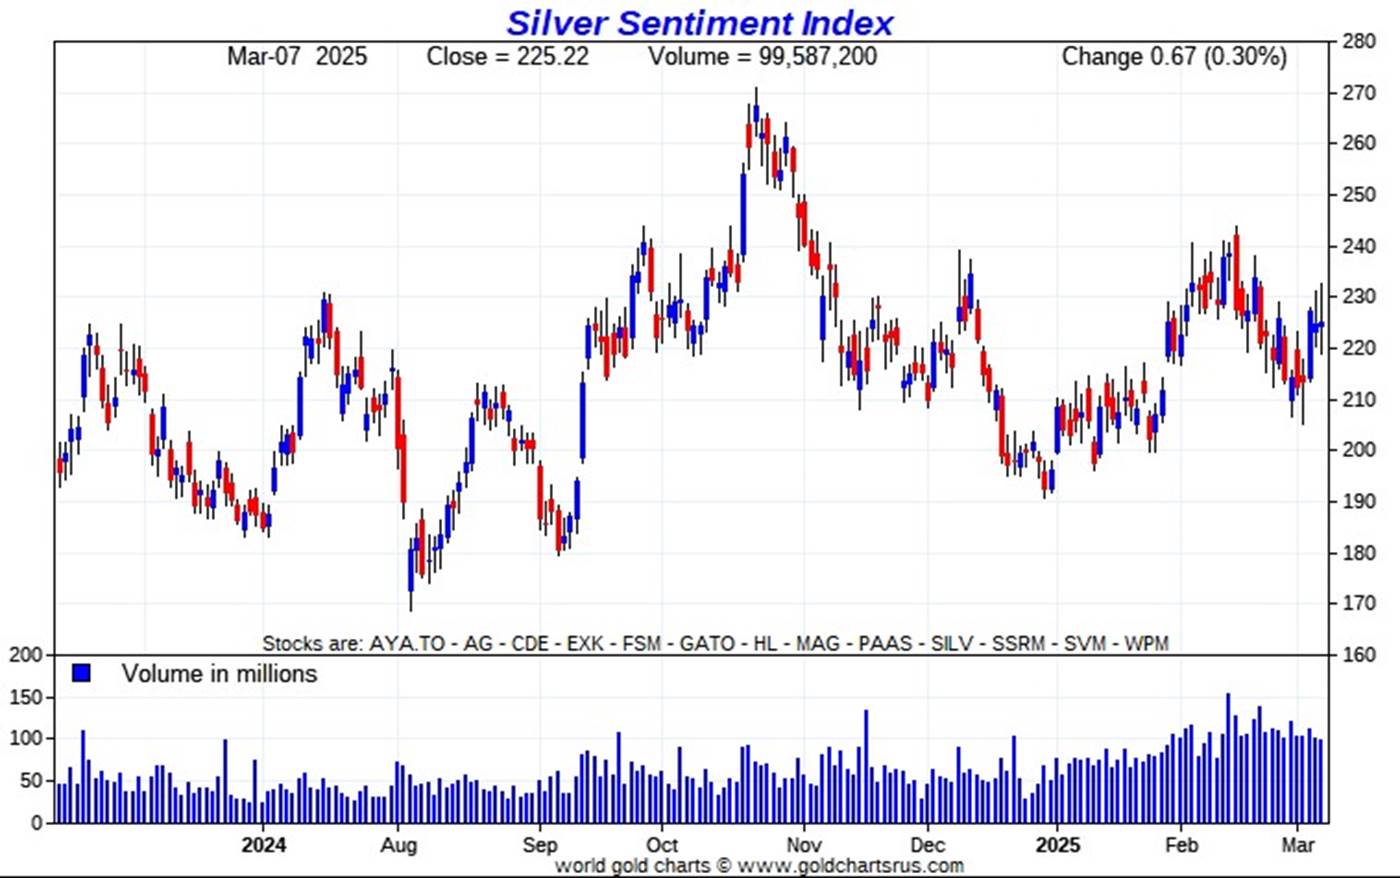
And despite the fact that the silver price also closed in the red, Nick Laird's 1-year Silver Sentiment Index closed up by 0.30 percent...helped mightily by Fortuna Silver. Click to enlarge.
![]()
The star yesterday was the aforesaid mentioned Fortuna Silver, closing higher by 6.05 percent on news linked in Friday's missive. The two dogs were Aya Gold & Silver -- and SSR Mining...closing down 3.27 and 2.36 percent respectively.
I didn't see any news yesterday on any of the now [down to] eleven silver companies that comprise the above Silver Sentiment Index.
The silver price premium in Shanghai over the U.S. price on Friday was 6.03 percent.
The reddit.com/Wallstreetsilver website, now under 'new' and somewhat improved management, is linked here. The link to two other silver forums are here -- and here.
![]()
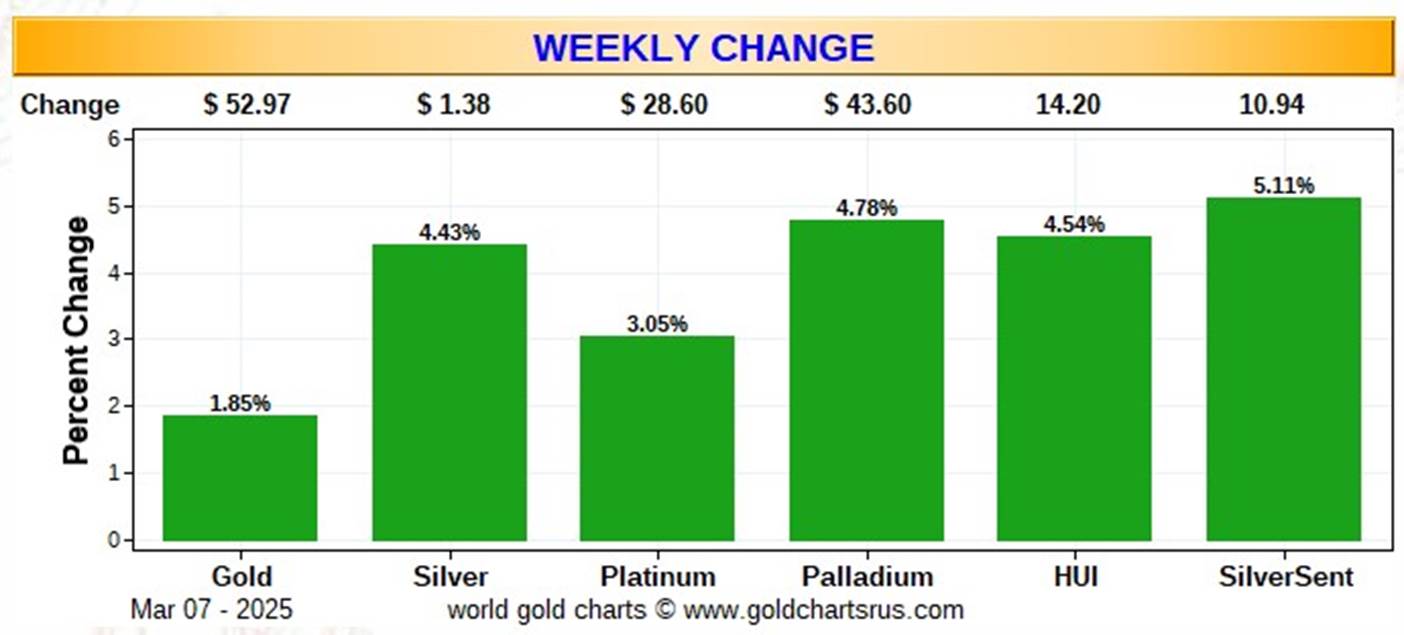
Here are two of the usual three charts that appear in this spot in every weekend missive. They show the changes in gold, silver, platinum and palladium in both percent and dollar and cents terms, as of their Friday closes in New York — along with the changes in the HUI and the Silver Sentiment Index.
Here's the weeklychart...which doubles as the month-to-date chart for this one week only. It's green across the board -- and that's mostly thanks to the big 'up' day we had on Wednesday. The gold equities outperformed the silver equities on a relative basis. Click to enlarge.
Here's the year-to-date chart -- and I'm happy that it's still green across the board...with the shares underperforming badly as usual. Everything silver-related is underperforming relative to gold, but only because of the the Big 8 commercial shorts just won't lessen their grip on it. Click to enlarge.
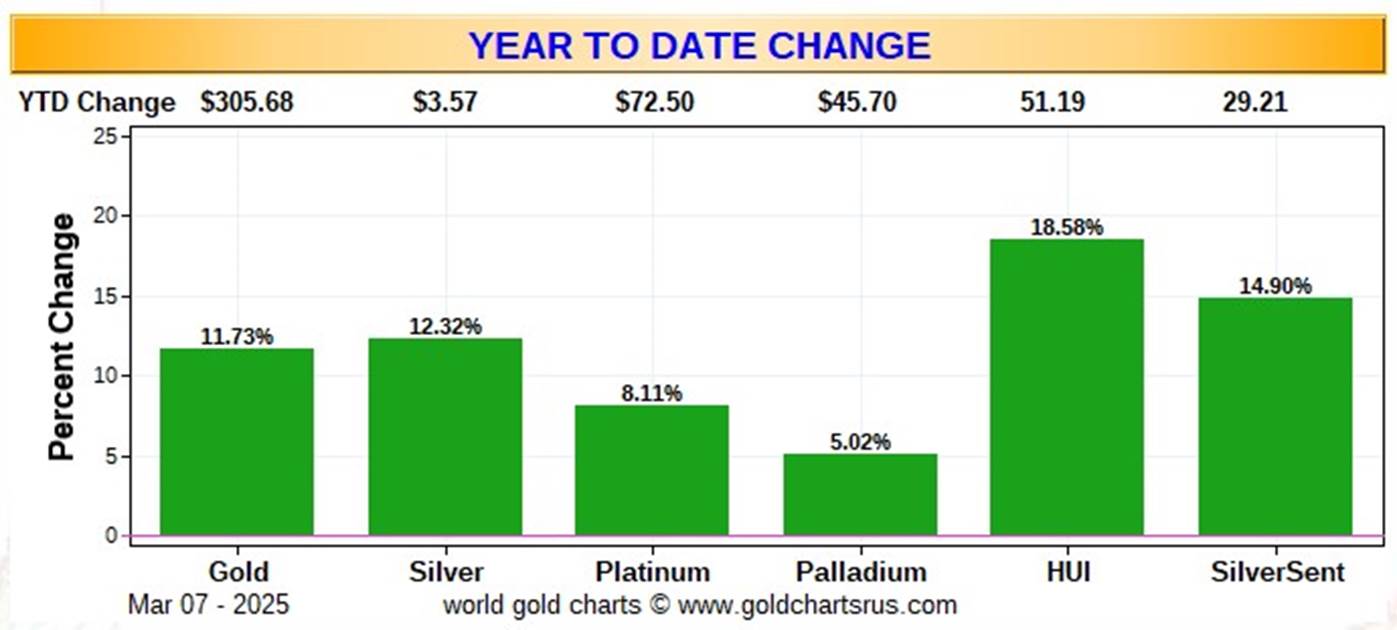
Of course -- and as I mention in this spot every Saturday -- and will continue to do so...is that if the silver price was sitting at a new all-time high of $50+ dollars an ounce, like gold is close to its nominal all-time high of $2,900+ the ounce...it's a given that the silver equities would be outperforming their golden cousins...both on a relative and absolute basis -- and by a country mile.

The CME Daily Delivery Report for Day 7 of March deliveries showed that 469 gold -- plus 63 silver contracts were posted for delivery within the COMEX-approved depositories on Tuesday.
In gold, the largest short/issuer by far was Australia's Macquarie Futures, issuing 409 contracts in total...334 from its client account -- and the other 75 from its house account. The other short/issuer of note was Stonex Financial, issuing 55 contracts out of its client account. The two biggest of the eight long/stoppers in total were Wells Fargo Securities and Citigroup, picking up 224 and 107 contracts for their respective house accounts.
In silver, the sole short/issuer was ADM out of its client account -- and the two largest of the five long/stoppers in total were JPMorgan and Canada's BMO [Bank of Montreal] Capital, picking up 32 and 15 contracts respectively...BMO for their house account.
In platinum, there were 3 contracts issued and stopped.
The link to yesterday's Issuers and Stoppers Report is here.
Month-to-date in March, there have been 13,571 gold...plus 12,997 silver contracts issued/reissued and stopped. In platinum, that number is 134 contracts -- and in palladium...95.
The Preliminary Report for the Friday trading session showed that gold open interest in March declined by 139 contracts, leaving 673 still open...minus the 469 contracts mentioned out for delivery on Tuesday as per the above Daily Delivery Report. Thursday's Daily Delivery Report showed that 604 gold contracts were actually posted for delivery on Monday, so that means that 604-139=465 more gold contracts were added to March deliveries.
Silver o.i. in March declined by 480 contracts, leaving 1,992 contracts still open...minus the 63 contracts mentioned a bunch of paragraphs ago. Thursday's Daily Delivery Report showed that 479 contracts were actually posted for delivery on Monday, so that means that 480-479=1 silver contract disappeared from the March delivery month.
Silver open interest in April increased by 199 contracts, leaving 1,737 still open. This number is subject to some downward adjustment in the CME's final report later on Monday morning CST.
Total gold open interest on Friday rose by a net 7,552 COMEX contracts -- but total silver o.i. fell by a net and tiny 6 COMEX contracts.
[I checked Thursday's final total open interest numbers -- and the change from the Preliminary Report in gold showed a decent downward revision, from +5,488 contracts...down to +1,255 contracts...the more the better as always. The final change in total silver o.i. showed a tiny increase...from +1,305 contracts, up to +1,382 contracts.]
![]()
There was a very decent withdrawal from GLD yesterday, as an authorized participant removed 138,365 troy ounces of gold. But two truckloads/ 1,274,221 troy ounces of silver were added to SLV.
The SLV borrow rate started the Friday session at 2.20%...and finished it at 2.31%...with only 150,000 shares available. The GLD borrow rate started the day at 0.99% -- and closed at 1.00%...with 2.4 million shares available.
In other gold and silver ETFs and mutual funds on Planet Earth on Friday...net of any changes in COMEX, GLD and SLV activity, there were a net 34,216 troy ounces of gold added -- plus a net 532,481 troy ounces of silver were added as well.
There was no sales report from the U.S. Mint -- and nothing month-to-date for March, either.
![]()
There was a big drop in gold deposits into the COMEX-approved depositories on the U.S. east coast on Thursday, as only 96,453.000 troy ounces/3,000 kilobars were received, all of which ended up at Brink's, Inc. -- and nothing was shipped out. In the paper category, there were 16,010 troy ounces transferred from the Eligible category and into Registered over at Manfra, Tordella & Brookes, Inc.
The link to all of Thursday's COMEX gold activity is here.
But there was no such drop-off in silver action, as another 4,623,697 troy ounces were received -- and only 2,840 troy ounces were shipped out...all of which left Brink's, Inc.
The largest 'in' amount were the three truckloads/1,831,571 troy ounces that arrived at JPMorgan...followed by the two truckloads/1,200,669 troy ounces that showed up at Brink's, Inc. Next were the two truckloads/1,197,723 troy ounces that found a new home over at Loomis International...with the remaining 393,731 troy ounces dropped off at Asahi.
There was hefty paper activity, as 1,345,091 troy ounces were transferred from the Eligible category and into Registered over at CNT...with the remaining 762,020 troy ounces getting transferred in the opposite direction, from the Registered category and back into Eligible, over at Asahi.
The link to all of Thursday's huge COMEX silver action is here.
There was some activity over at the COMEX-approved gold kilobar depositories in Hong Kong on their Thursday...all of it at Brink's, Inc. as usual. They reported receiving 763 kilobars -- and shipped out 488 of them. The link to this, in troy ounces, is here.
The Shanghai Futures Exchange reported that a net 823,419 troy ounces of silver were removed from their inventories on Friday, which now stands at 39.449 million troy ounces.
![]()
Here are the usual 20-year charts that show up in this space in every weekend column. They show the total amounts of physical gold and silver held in all known depositories, ETFs and mutual funds as of the close of business on Friday.
During the week just past, there were a net 584,000 troy ounces of gold added...with more than the lion's share being COMEX related -- plus a net 12.412 million troy ounces of silver were were also added during that same time period, with virtually all of it going into the COMEX. Click to enlarge.
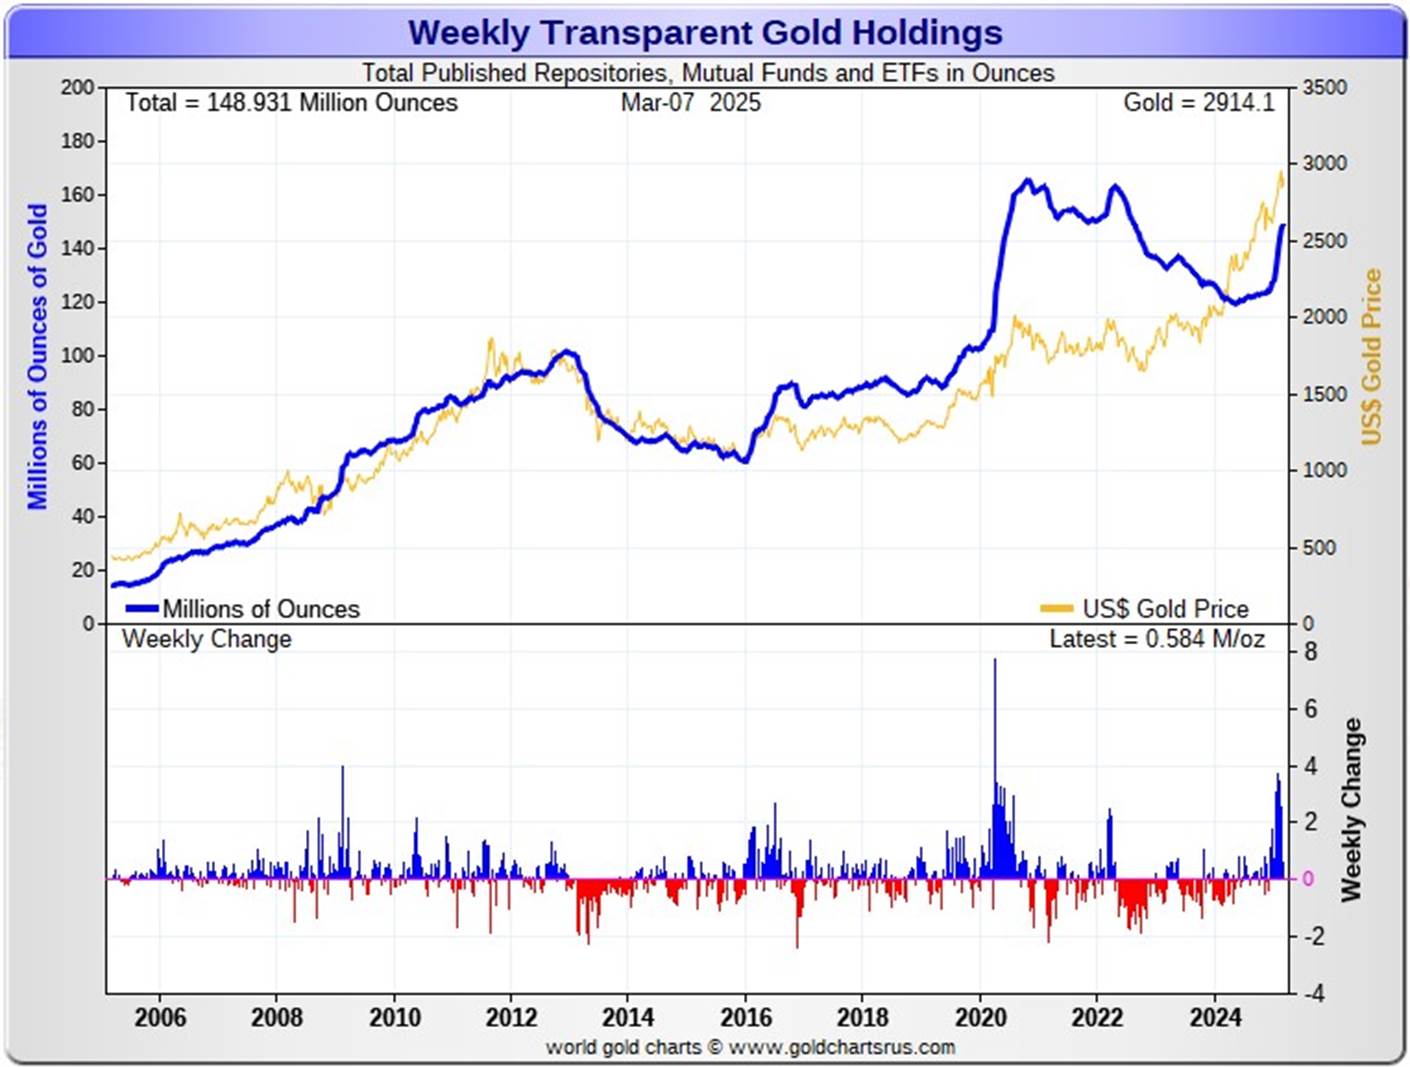
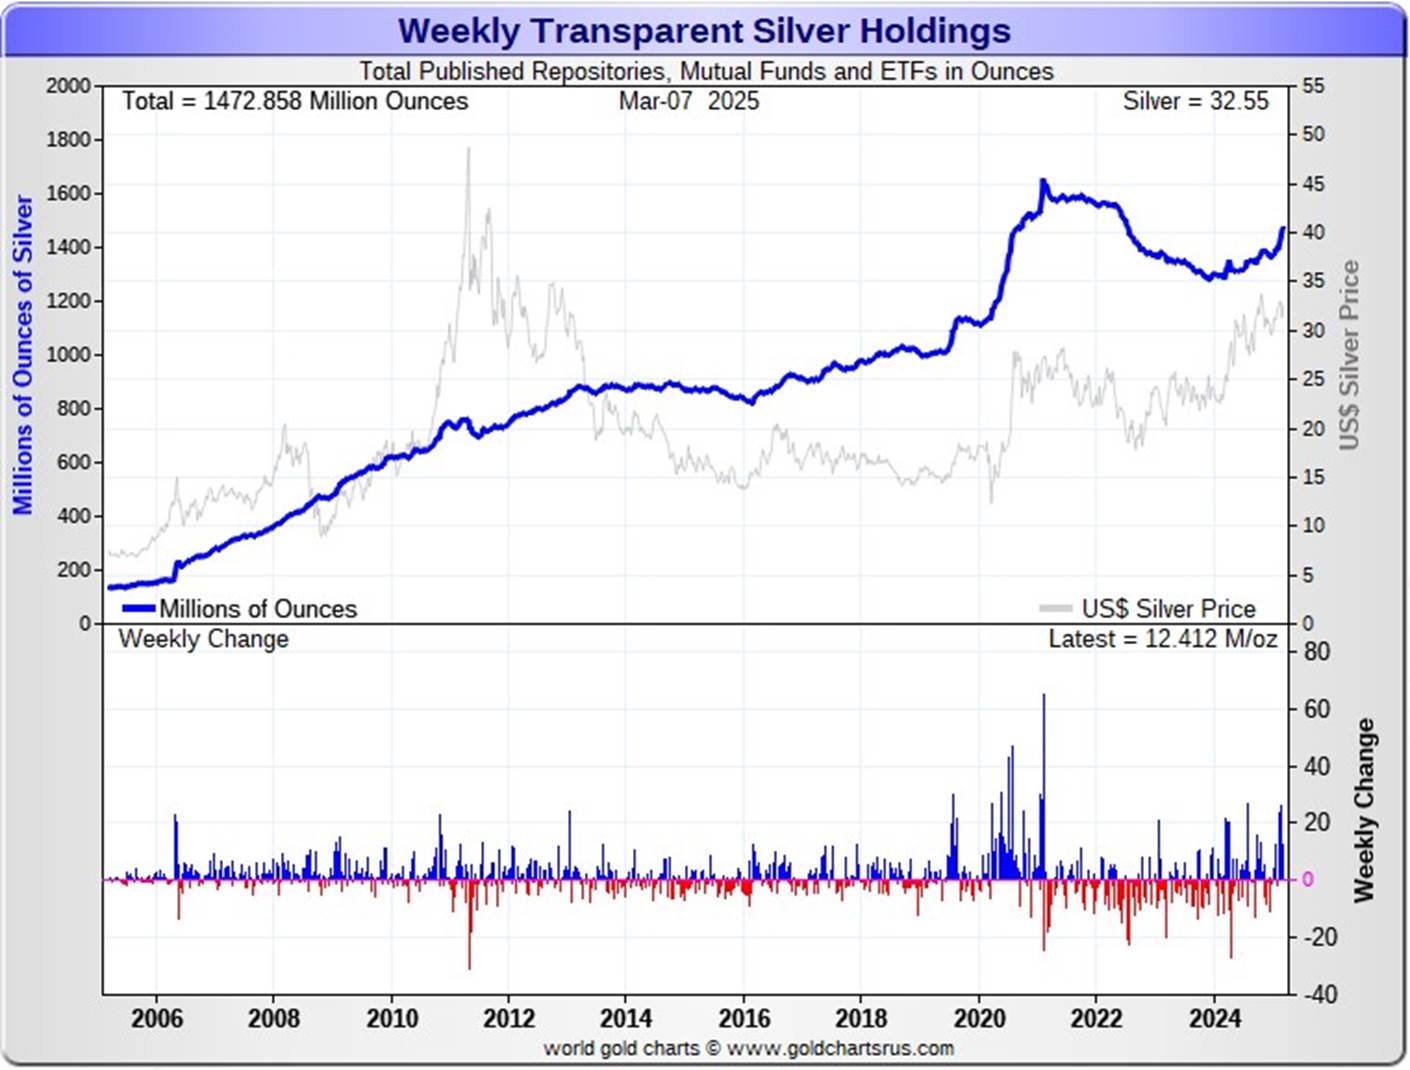
According to Nick Laird's data on his website, a net 7.626 million troy ounces of gold were added to all the world's known depositories, mutual funds and ETFs during the last four weeks -- with virtually all of it going into either the COMEX or GLD...mostly the former. And a net 77.686 million troy ounces of silver were were also added during that same time period, with virtually all of that amount going into the COMEX.
Retail bullion sales, from what I've heard from my sources, is not all that bad. Premiums remain at rock bottom -- and I haven't seen any sign that they've been raising them at all. It remains a buyer's market for physical at the retail level, but for a limited time only I'm sure...judging by what's happening elsewhere.
At some point there will be large quantities of silver required by all the ETFs and mutual funds once serious institutional buying really kicks in -- and there were signs of that, both this week and last...however mostly in gold. But the really big buying lies ahead of us when the silver price is finally allowed to rise substantially, which I'm sure is something that the powers-that-be in the silver world are keenly aware of -- and why they're desperate in their attempts to keep it from rising any faster than it already is. Their efforts were on full display once again yesterday...but can't last forever.
And as Ted stated a while ago now, it now stands to reason that JPMorgan has parted with most of the at least one billion troy ounces that they'd accumulated since the drive-by shooting that commenced at the Globex open at 6:00 p.m. EDT on Sunday, April 30, 2011.
They had to supply huge amounts to both India and China in 2024 -- and one has to suspect that this amount of demand will continue in 2025 as well...if not increase further. I also suspect that all the silver flown into the COMEX from London so far this month and last...over 100 million ounces...came from their stash.
The physical demand in silver at the wholesale level continues unabated -- and was beyond ginormous again this past week. The amount of silver being physically moved, withdrawn, or changing ownership remains breath-taking -- and continues without letup...including March deliveries. That was on prominent display during the December delivery month, as 40.435 million troy ounces of physical silver were delivered/changed hands -- and the 11.85 million troy ounces of silver in January. In February, there were 23.94 million troy ounces issued and stopped...4,788 COMEX contracts -- and 65.0 million ounces have already been delivered in March so far.
New silver has to be brought in from other sources [JPMorgan in London] to meet the ongoing demand for physical metal...as all the metal in New York is already spoken for and not for sale. That's been more than obvious on the COMEX in the past month or so -- and as mentioned a bit further up, at least 77 million oz. have been flow in from London in the last four weeks. This demand will continue until available supplies are depleted...which will most likely be the moment that JPMorgan & Friends stop providing silver to feed this deepening structural deficit, now in its fifth year.
The vast majority of precious metals being held in these depositories are by those who won't be selling until the silver price is many multiples of what it is today.
Sprott's PSLV is the third largest depository of silver on Planet Earth with 180.6 million troy ounces...unchanged for more than two months now -- and now an even greater distance behind the COMEX, where there are 424.9 million troy ounces being held...up another 16.3 million troy ounces this past week...but minus the 103 million troy ounces being held in trust for SLV by JPMorgan.
That 103 million ounce amount brings JPMorgan's actual silver warehouse stocks down to around the 66 million troy ounce mark...quite a bit different than the 169.1 million they indicate they have...up another 6.7 million ounces on the week.
PSLV remains a very long way behind SLV as well, as they are the largest silver depository, with 435.6 million troy ounces as of Friday's close...down 2.9 million troy ounces on the week.
The latest short report from ten days ago [for positions held at the close of business on Friday, February 14] showed that the short position in SLV declined by an insignificant 6.72%...from the 62.71 million shares sold short in the prior report...down to 58.50 million shares in this latest report. If my memory serves me correctly, this is around the third largest short position in history for this ETF -- and remains grotesque and obscene beyond description.
BlackRock issued a warning several years ago to all those short SLV, that there might come a time when there wouldn't be enough metal for them to cover. That would only be true if JPMorgan decides not to supply it to whatever entity requires it...which is most certainly a U.S. bullion bank, or perhaps more than one.
The next short report...for positions held at the close of trading on Friday, February 28... yesterday...will be posted on The Wall Street Journal's website this coming Tuesday, March 11.
Then there's that other little matter of the 1-billion ounce short position in silver held by Bank of America in the OTC market...with JPMorgan & Friends on the long side. Ted said it hadn't gone away -- and he'd also come to the conclusion that they're short around 25 million ounces of gold with these same parties as well.
The latest report for the end of Q3/2024 from the OCC came out about two months ago now -- and after careful scrutiny, I noted that the dollar value of their derivative positions were up just under 20 percent on average over the last quarter...the same percentage increase as Q2/2024. I suspect that it was entirely due to the price increases in both gold and silver since the Q2 report came out.
And as I keep pointing out in this spot, the OCC indicator is flawed for two very important reasons, as way back 10-15 years ago, this report used to include the top dozen or so U.S. banks -- and included the likes of Wells Fargo and Morgan Stanley, amongst others...that are card-carrying members of the Big 8 shorts. Now the list is down to just four banks...so a lot of data is hidden ...which is certainly the reason why the list was shortened. On top of that, the list doesn't include the non-U.S. banks that are members of the Big 8 shorts: British, French, German and Canadian banks.
![]()
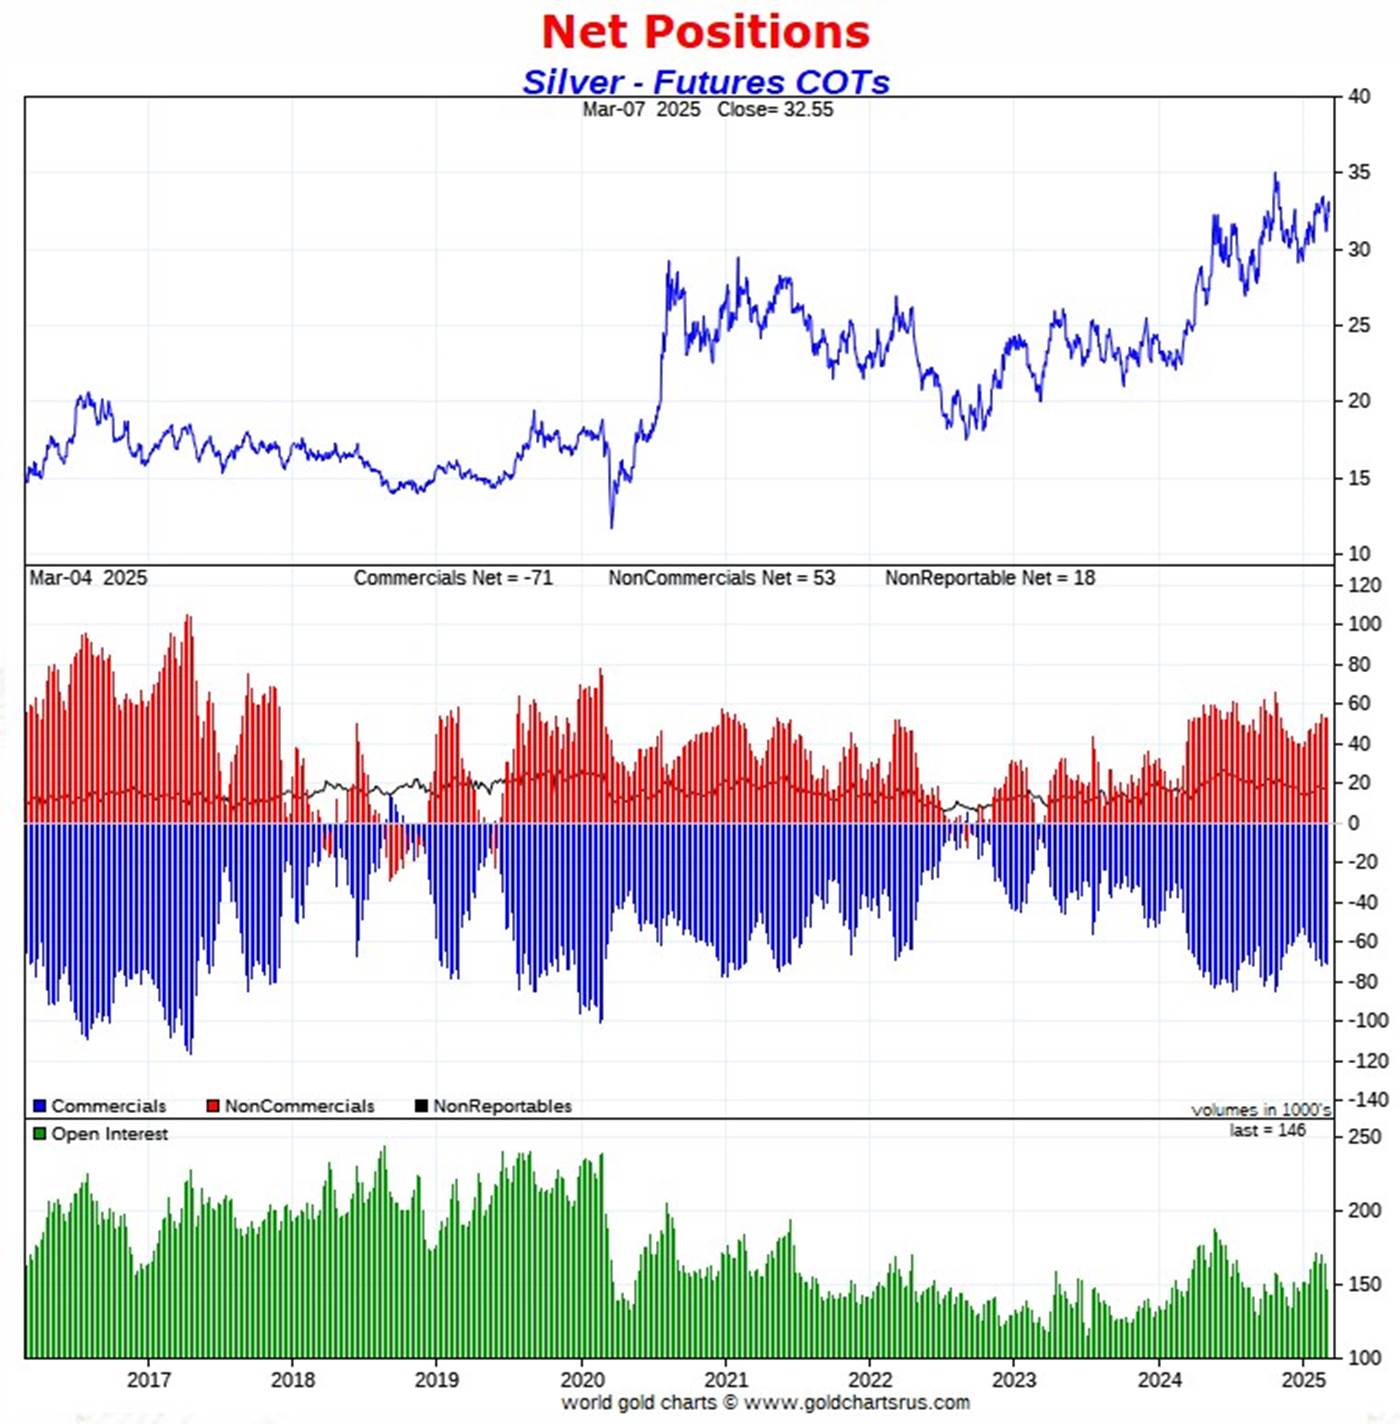
The Commitment of Traders Report, for positions held at the close of COMEX trading on Tuesday, showed a small increase in the Commercial net short position, which was entirely due to Ted's raptors selling long positions -- and a decent decrease in gold, mostly caused by raptor short covering.
In silver, the Commercial net short position increased by 756 COMEX contracts...3.780 million troy ounces of the stuff.
They arrived at that number through the sale of 7,259 long contracts -- and also bought back 6,503 short contracts. It's the difference between those two numbers that represents their change for the reporting week.
Under the hood in the Disaggregated COT Report, the Managed Money traders were the biggest buyers, increasing their net long position by 1,159 COMEX contracts...which they accomplished through the sale of 3,460 long contracts... but they bought back 4,619 short contracts -- and it's the difference between those two numbers that represents their change for the reporting week.
The traders in the Nonreportable/small trader category were also net buyers... increasing their net long position by 302 contracts. That meant that the traders in the Other Reportables category had have reduced their net long position -- and they did so by 705 COMEX contracts.
Doing the math: 1,159 plus 302 minus 705 equals 746 COMEX contracts, the change in the Commercial net short position.
The Commercial net short positionin silver now stands at 70,944 COMEX contracts/354.720 million troy ounces...up those 756 contracts from the 70,188 COMEX contracts/350.940 million troy ounces that they were short in last Friday's COT Report.
The Big 4 shorts [most likely the Big 1 or 2] decreased their net short position, but only 285 COMEX contracts...from 56,469 contracts, down to 56,184 contracts -- and still monstrously bearish.
The Big '5 through 8' shorts also decreased their net short position, them by 667 COMEX contracts...from the 20,952 contracts in the prior COT Report, down to 20,285 contracts in yesterday's COT Report -- but still hugely bearish.
The Big 8 shorts in total decreased their overall net short position from 77,421 contracts, down to 76,469 COMEX contracts week-over-week...an decrease of 952 COMEX contracts.
But since the Commercial net short position rose by 756 contracts in yesterday's COT Report -- and the Big 8 decreased their short position by 952 contracts, this meant that Ted's raptors...the small commercial traders other than the Big 8...had to have been sellers during the reporting week -- and they were...decreasing their long position by 952+756=1,708 COMEX contracts.
That decreased the raptor's long position from 7,233 COMEX contracts, down to 5,525 contracts. In the very bullish October 25, 2024 COT Report, they were net short silver by 7,356 COMEX contracts.
Here's Nick's 9-year COT chart for silver -- and updated with the above data. Click to enlarge.
Because of that 'V'-shaped down/up move in the silver price during the reporting week, I wasn't sure what to expect in this report, which is why I passed on what the number might be.
The only reason that the Commercial net short position in silver increased during this past reporting week is because of Ted's raptors selling long positions...which has the mathematical effect of increasing the short position, which isn't an increase at all.
I was happy to see that the Big 4/8 shorts were able to cover a bit. However, since their record short position of 82,119 contracts back on February 7, they've only managed to reduce their short position by 5,650 COMEX contracts...which isn't a lot.
The Big 8 collusive commercial traders are now net short 52.4 percent of the total open interest in silver in this week's COT Report, compared to the 47.3 percent they were net short in the last COT Report.
The reason that the above percentage rose as much as it did, was because of the huge 17,746 contract decrease in total silver open interest, which obviously affects the percentage calculation.
But from a COMEX futures market perspective, the set-up remains off-the-charts bearish.
As I've been saying recently, I've come to the conclusion that the Big 8 collusive commercial shorts have no intention of ever covering all of their short positions, or even a significant portions of them -- and it's now strictly a price management tool to prevent a silver price explosion. It's always been that way, of course...but is now institutionalized -- and it's for that reason I've lost most of my fear of it...especially considering the record demand for immediate delivery in the physical market.
And nothing has changed with regards to that ongoing and deepening structural deficit in the physical market...which is now in its fifth consecutive year.
As it's been for decades, it only matters what the collusive Big 8 commercial traders do... especially the Big 1 or 2...both of which are U.S. bullion banks, I'm sure.
Of course not to be forgotten -- and which also has a huge and negative impact on the silver price, is the still outrageous short position in SLV...58.50 million shares/troy ounces...as of last short report that came out ten days ago now. The next one is due out on Tuesday.
![]()
![]()
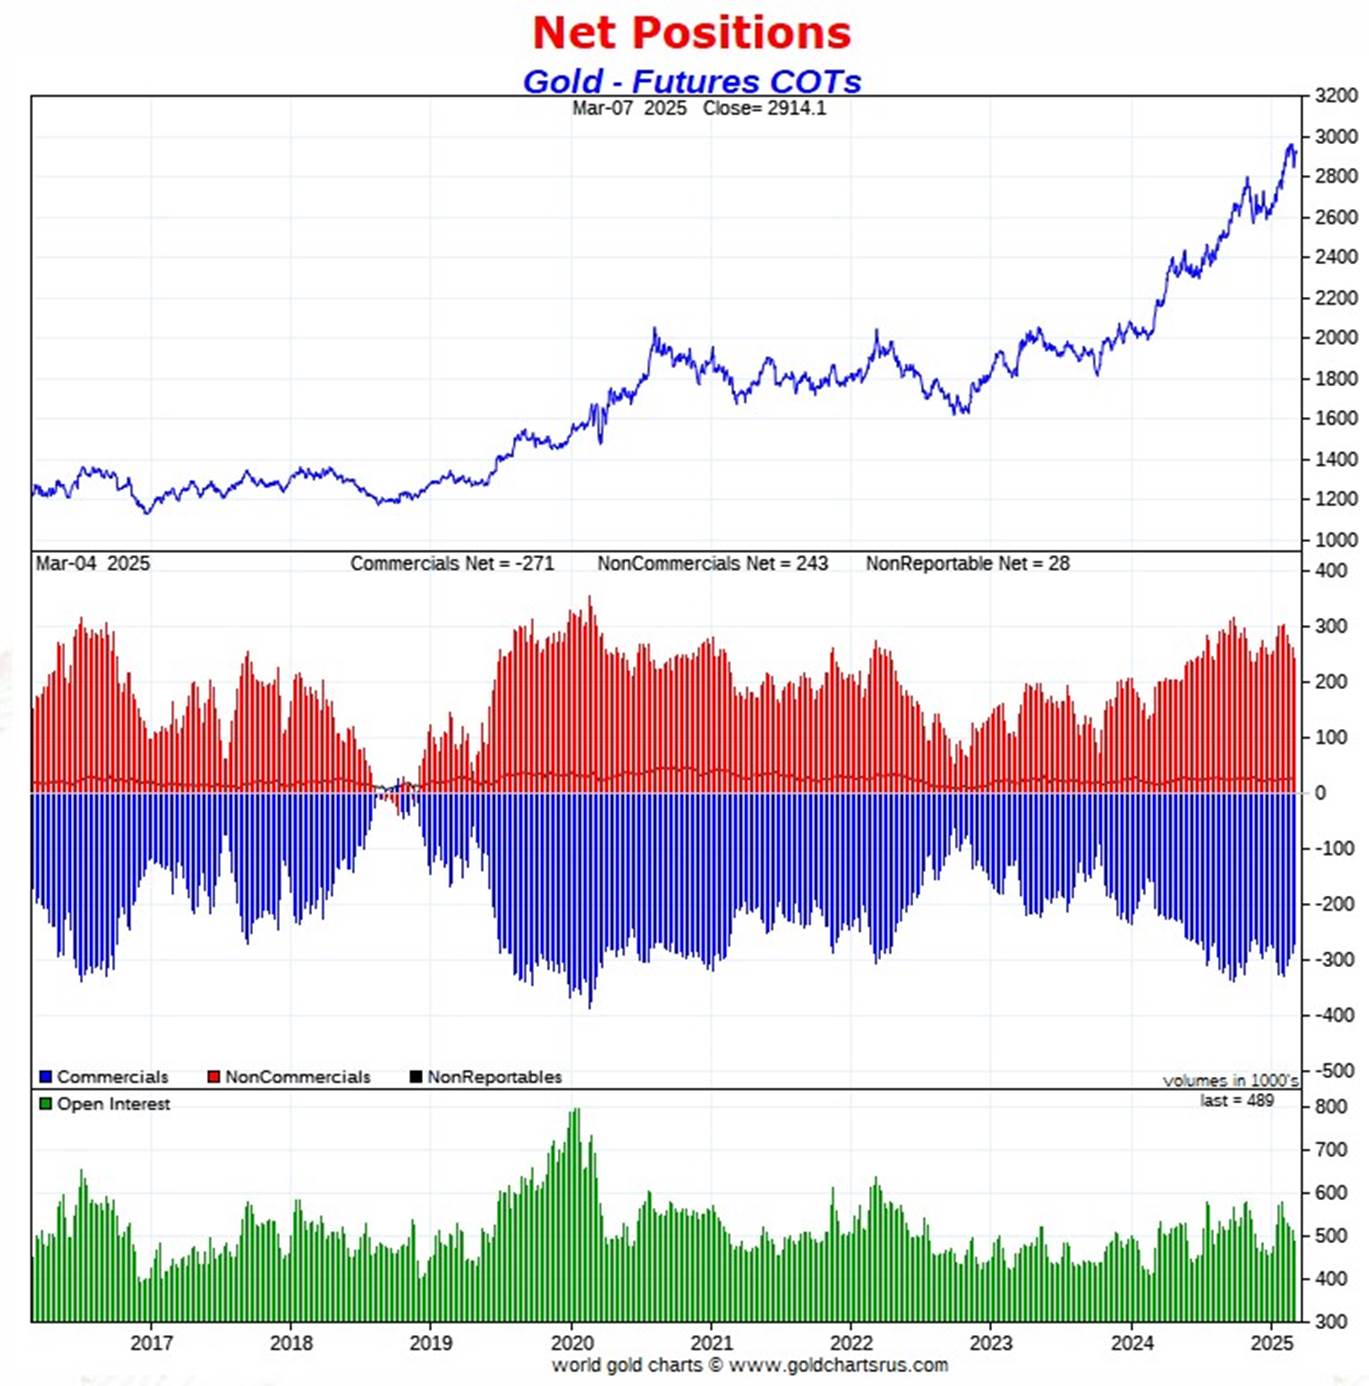
In gold, the commercial net short position dropped by 16,985 COMEX contracts...or 1.699 million troy ounces of the stuff.
They arrived at that number through the sale of 3,809 long contracts, but also bought back 23,068 short contracts -- and it's the difference between those two numbers that represents their change for the reporting week.
Under the hood in the Disaggregated COT Report, it was the Managed Money and Other Reportables that were the big sellers. The Managed Money traders decreased their net long position by 13,154 COMEX contracts...which they accomplished through the sale of 7,729 long contracts -- and they also sold 5,425 short contracts. The Other Reportables decreased their net long position by 5,210 contracts.
This meant that the Nonreportable/small traders had have increased their net long position...which they did to the tune of 1,379 COMEX contracts.
Doing the math: 13,154 plus 5,210 minus 1,379 equals 16,985 COMEX contracts...the change in the commercial net short position.
The commercial net short position in gold now sits at 271,115 COMEX contracts/27.112 million troy ounces of the stuff...down those 16,985 contracts from the 288,100 COMEX contracts/28.810 million troy ounces they were short in last Friday's COT Report -- and still very bearish.
The Big 4 shorts in gold decreased their net short position for the sixth week in a row, but only 941 contracts...from 141,361 contracts they were short in the last COT report, down to 140,420 contracts in yesterday's report. This is their lowest short position since March 15 of last year...still on the bearish side by a bit, but vastly improved from the 198,271 contracts there were net short in the January 21 COT Report.
The surprise for me regarding the Big 4 shorts in this report was the fact that they weren't more aggressive in covering short positions than they were.
The Big '5 through 8' shorts, also reduced their net short position in yesterday's report...from 72,217 contracts they were short in last Friday's COT Report, down to 68,987 contracts held short in the current report...a decline of a further 3,230 COMEX contracts -- and still on the bearish side.
The Big 8 short position decreased from 213,578 contracts/21.359 million troy ounces in last Friday's COT Report...down to 209,407 contracts/20.407 million troy ounces in yesterday's...a drop of a further 4,171 COMEX contracts.
But since the commercial net short position fell by 16,985 COMEX contracts during the reporting week -- and the Big 8 commercial short position decreased by only 4,171 COMEX contracts, that meant that Ted's raptors... the small commercial traders other than the Big 8 had to have been buyers during the reporting week -- and they were. They decreased their grotesque short position by 16,985-4,171=12,814 COMEX contracts. Their short position is now 61,708 contracts...down from the 74,522 contract record short position they held in last Friday's COT Report. This number obviously remains obscene and grotesque beyond description.
And because of that -- plus the fact that they added 5,425 short contracts during the reporting week, it's now a given that there's a managed money trader, or maybe more than one, with a large enough short position to be somewhere in the Big '5 through 8' commercial category.
Here's Nick's 9-year COT chart for gold -- and updated with the above data. Click to enlarge.
What makes the set up so bearish in gold from a COMEX futures market perspective is the grotesque short position still held by Ted's raptors...the small commercial traders other than the Big 8. And whether they matter or not anymore in the grand scheme of things, is unknown.
However, from a Big 8 short perspective, the set-up for them is bordering on bullish...as their collective short position is down to what it was back at the end of October 2023. But, having said that, the Big 4 were only short 127,918 contracts on 20 October 2023...compared to the 140,420 COMEX contracts they were short in yesterday's COT Report.
But if you remove the influence of the one or two Managed Money traders that currently contaminate that Big 8 commercial net short position, the set-up in gold is ever more bullish than just stated in the previous paragraph.
The Big 8 collusive commercial traders are short 42.8 percent of total open interest in gold in the COMEX futures market...up from the 41.7 percent they were short in the prior COT Report. That 42.8% number would have been a lot smaller [and less than 41.7%...if it hadn't been for the 22,909 contract drop in total open interest, which obviously affects the percentage calculation.
But once you add in the 61,708 contracts currently held short by Ted's raptors, the commercial net short position in gold works out to 55.4 percent of total open interest, down a bit from the 56.2 percent they were short in the prior COT Report...which is still grotesque and obscene beyond description.
That 55.4% number would have also been lower, if total open interest hadn't declined by those aforesaid mentioned 22,909 contracts.
Can gold rally big from here? Of course...as can silver. The only reason they aren't, is because these collusive commercial traders of whatever stripe always step in as not-for-profit sellers/short sellers of last resort when they do attempt to blow higher. That scenario is on full display multiple times a day -- and certainly was yesterday on that non-farm payrolls number.
But the eye-opening dichotomy between the raptor long position in silver...5,525 contracts vs. the monster short position held by the raptors in gold...61,708 contracts...remains unprecedented. For the most part, these small traders are all the same players in both these precious metals -- and why they're configured at odds with each other like this at the moment, is anyone's guess.
To sum up, from a COMEX futures market perspective, the set-up in gold remains bearish in the overall...but now mildly bullish in the Big 8 short category. However, as said about silver...at some point, as Ted mentioned repeatedly over the years, what the numbers in the COT Report show, won't matter, as they will be trumped by factors beyond the control of the paper hangers in New York.
That process may be in progress now, but it's not being allowed to fully manifest itself in the prices of either of these precious metals at the moment...as the commercial traders of whatever stripe continue to step in when required. Yesterday's price action was yet another poster child for that...as every Friday has been lately.
![]()
![]()
In the other metals, the Managed Money traders in palladium increased their net short position by a further 1,290 COMEX contracts -- and are net short palladium by 11,450 contracts...57.4 percent of total open interest. The commercial traders in the Producer/Merchant category are now back on the long side by a tiny 36 COMEX contract, re-joining the other three categories of traders that are all net long palladium...especially the Swap Dealers in the commercial category.
In platinum, the Managed Money traders reduced their net long position by a further 5,508 COMEX contracts during the reporting week -- but still remain net long platinum by 2,960 COMEX contracts.
The commercial traders in the Producer/Merchant category in platinum are meganet short a knee-wobbling 24,465 COMEX contracts -- but the Swap Dealers in the commercial category are net long 4,064 contracts. The traders in both the Other Reportables and Nonreportable/small traders categories remain net long platinum by very hefty amounts.
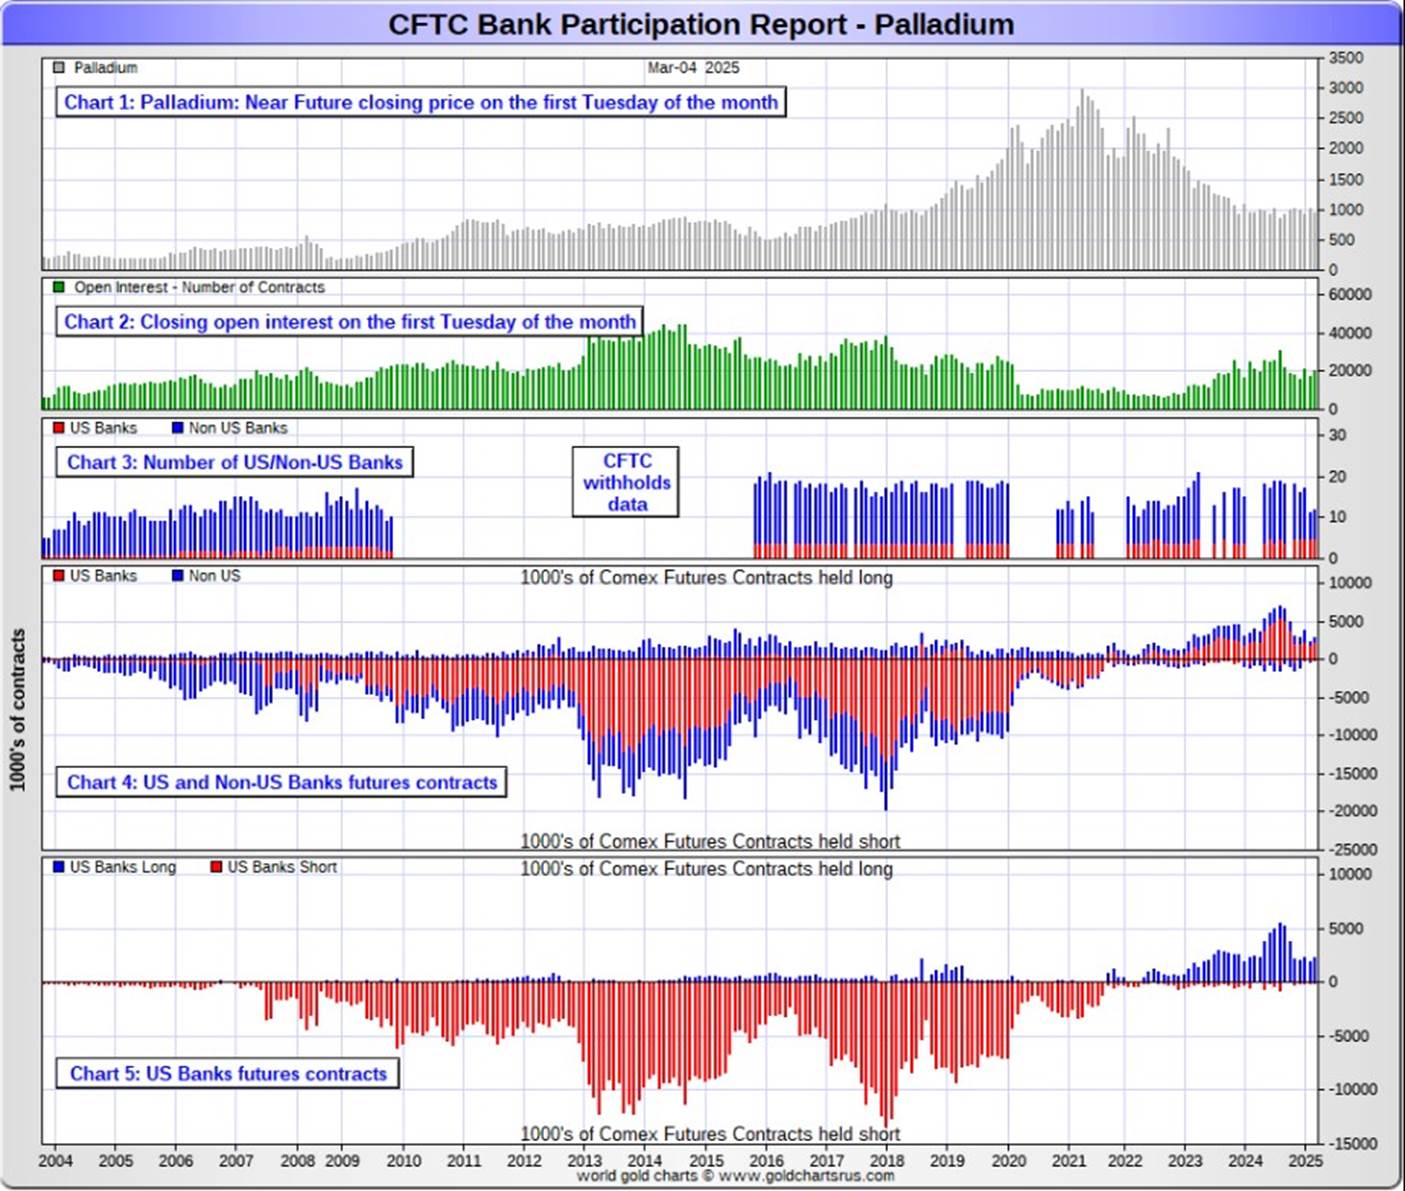
It's mostly the world's banks in the Producer/Merchant category that are 'The Big Shorts' in platinum in the COMEX futures market, as per March's Bank Participation Report that came out yesterday -- and have decreased their short position in platinum by a bit since the February report.
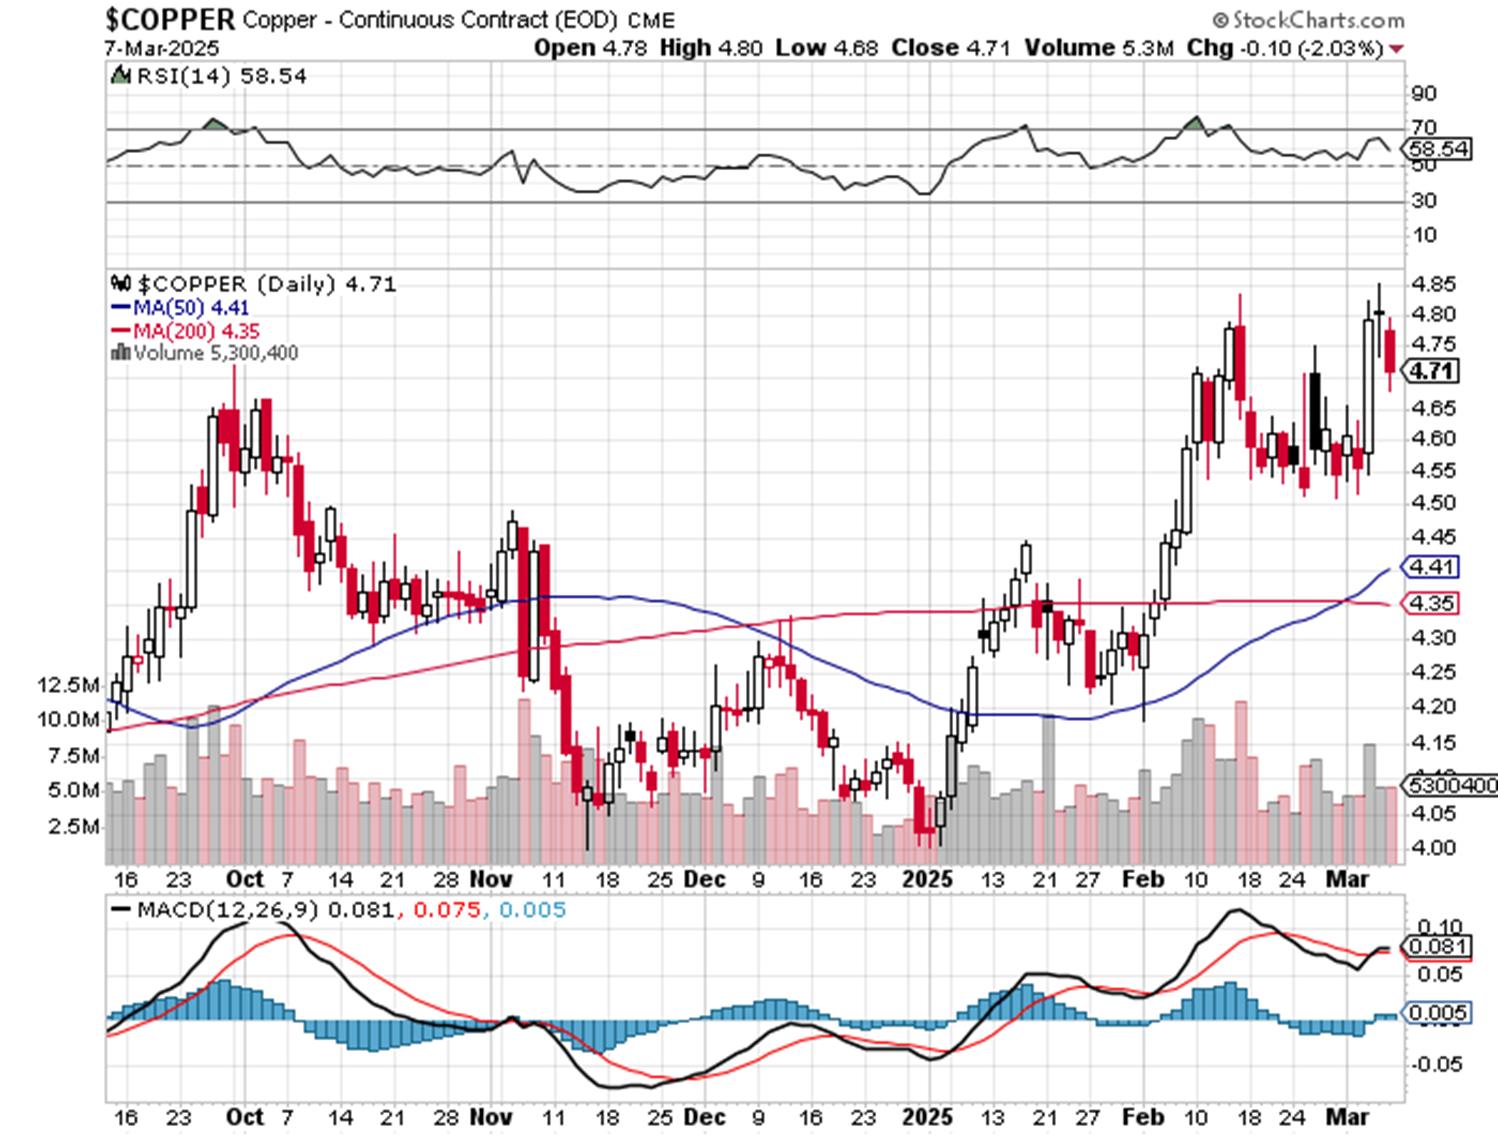
In copper, the Managed Money traders decreased their net long position by a further 9,755 contracts -- but remain net long copper by 8,902 COMEX contracts...about 222 million pounds of the stuff as of yesterday's COT Report ...down from the 466 million pounds they were net long copper in last Friday's COT report.
Copper, like platinum, continues to be a wildly bifurcated market in the commercial category. The Producer/Merchant category is net short 37,374 copper contracts/934 million pounds -- while the Swap Dealers are net long 21,185 COMEX contracts/529 million pounds of the stuff.
Whether this means anything or not, will only be known in the fullness of time. Ted said it didn't mean anything as far as he was concerned, as they're all commercial traders in the commercial category. However, this bifurcation has been in place for as many years as I can remember -- and that's a lot.
In this vital industrial commodity, the world's banks...both U.S. and foreign... are net long 9.2 percent of the total open interest in copper in the COMEX futures market as shown in the March Bank Participation Report that came out yesterday -- and up a decent amount from the 6.9 percent they were net long in February's.
At the moment it's the commodity trading houses such as Glencore and Trafigura et al., along with some hedge funds, that are net short copper in the Producer/Merchant category, as the Swap Dealers are net long, as pointed out above.
The next Bank Participation Report is due out on Friday, April 4.
![]()
Here’s Nick Laird’s “Days to Cover” chart, updated with the COT data for positions held at the close of COMEX trading on Tuesday, March 4. It shows the days of world production that it would take to cover the short positions of the Big 4 — and Big '5 through 8' traders in every physically traded commodity on the COMEX. Click to enlarge.
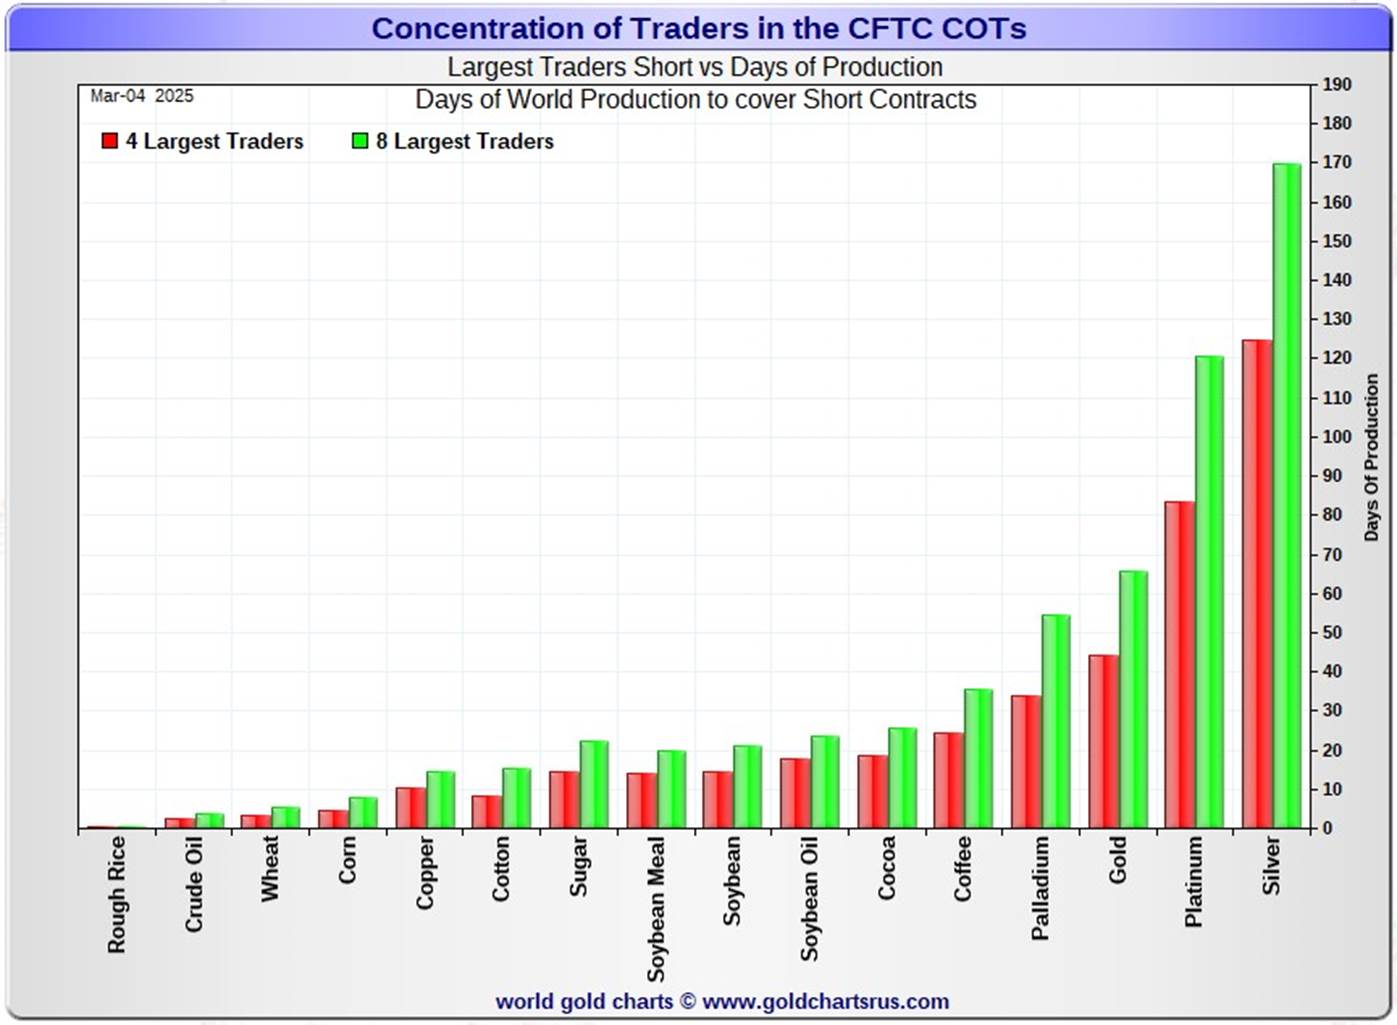
In this week's data, the Big 4 traders are short 125 days of world silver production... unchanged from the prior COT report. The ‘5 through 8’ large traders are short an additional 45 days of world silver production... down about 2 days from the last COT Report, for a total of about 170 days that the Big 8 are short -- and obviously down 2 days from last Friday's COT report.
Those 170 days that the Big 8 traders are short, represents around 5.7 months of world silver production, or 382.345 million troy ounces/76,469 COMEX contracts of paper silver held short by these eight commercial traders. Several of the largest of these are now non-banking entities, as per Ted's discovery a year or so ago. March's Bank Participation Report continued to confirm that this is still the case -- and not just in silver, either.
As mentioned further up, the small commercial traders other than the Big 8 shorts, Ted's raptors, are net long silver by 5,525 COMEX contracts...down from the 7,233 contracts they were net long in last Friday's COT Report.
In gold, the Big 4 are short about 44 days of world gold production... unchanged from the prior COT Report. The Big '5 through 8' are short an additional 22 days of world production, down about 1 day from last the last report...for a total of 66 days of world gold production held short by the Big 8 -- and obviously down 1 day from last Friday's COT Report.
As mentioned further up, the Big 8 commercial traders are net short 52.4 percent of the entire open interest in silver in the COMEX futures market as of yesterday's COT Report, up big from the 47.3 percent they were net short in last Friday's report. The only reason that the percentage number rose that much was because of that 17,746 contract drop in total open interest, which obviously affects the percentage calculation.
In gold, it's 42.8 percent of the total COMEX open interest that the Big 8 are net short, up from the 41.7 percent they were net short in the last COT Report -- and would have been down a lot more, except for the monstrous 22,909 contract decrease in total open interest during the reporting week, which obviously affects the calculation in it as well.
But the total commercial net short position in gold is 55.4 percent of total open interest once you add in what Ted's raptors [the small commercial traders other than the Big 8] are short on top of that...a further 61,708 COMEX contracts.
Ted was of the opinion that Bank of America is short about one billion ounces of silver in the OTC market, courtesy of JPMorgan & Friends. He was also of the opinion that they're short 25 million ounces of gold as well. And the latest report from late December [for Q3/2024] shows that their positions are up 20 percent from what they were holding at the end of Q2/2024...with most of that increase most likely being price related. One wonders if Mr. Buffet is done dumping the rest of the stock he has in that company. There was this story about it on Zero Hedge a few weeks ago.
The short position in SLV now sits at 58.50 million shares as of the last short report, for positions held at the close of COMEX trading on Friday, February 14...down an insignificant 6.72 percent from the 62.71 million shares sold short on the NYSE in the prior report. This, as you already know, is the second highest short position in SLV ever -- and is off-the-charts grotesque and obscene -- but yet another way that 'da boyz' are controlling the silver price.
The next short report is due out next Tuesday, March 11...for positions held at the close of COMEX trading on Friday, February 28.
The situation regarding the Big 4/8 commercial short positions in the COMEX futures market in silver remains bearish...but is now mildly bullish in gold -- and what that means going forward for their respective prices, remains to be seen.
As Ted had been pointing out ad nauseam, the resolution of the Big 4/8 short positions will be the sole determinant of precious metal prices going forward -- although the almost record high short position held by his raptors in gold is still of some concern.
![]()
The February Bank Participation Report [BPR] data is extracted directly from yesterday's Commitment of Traders Report data. It shows the number of futures contracts, both long and short, that are held by all the U.S. and non-U.S. banks as of Tuesday’s cut-off in all COMEX-traded products.
For this one day a month we get to see what the world’s banks have been up to in the precious metals. They’re usually up to quite a bit -- and they certainly were again this past month.
[The March Bank Participation Report covers the four-week time period from February 4 to March 4 inclusive]
In gold, 5 U.S. banks are net short 96,740 COMEX contracts, down a hefty 13,575 contracts from the 110,135 contracts that these same 5 U.S. banks were net short in the February's BPR. These U.S banks have been mega net short gold since August of last year...but are down 14,407 contracts since the January 2025 BPR.
Also in gold, 23 non-U.S. banks are net short 119,068 COMEX contracts, up a further 27,492 contracts from the 91,576 contracts that 24 non-U.S. banks were short in February's BPR...their largest short position since August 2019 -- and their second highest short position on record. In the last two months these non-U.S. banks have added a net and whopping 77,670 short contracts. I have more on this in The Wrap.
At the low back in the August 2018 BPR...these non-U.S. banks held a net short position in gold of only 1,960 contacts -- so they've been back on the short side in a gargantuan way ever since. Only a tiny handful of these banks hold a meaningful short position in gold. The short positions of the rest are of no consequence -- and never have been. A few of them may actually be net long gold by a bit.
Although some of the largest U.S. and foreign bullion banks are in the Big 8 short category in gold, some of the hedge fund/commodity trading houses are short even more grotesque amounts of gold than the banks in the Big 4/8 category.
It's also a strong possibility that the BIS could be short gold in the COMEX futures market as well.
As of March's Bank Participation Report, 28 banks [both U.S. and foreign] were net short 44.1 percent of the entire open interest in gold in the COMEX futures market...up a whole bunch from the 37.2 percent that 29 banks were net short in the February BPR.
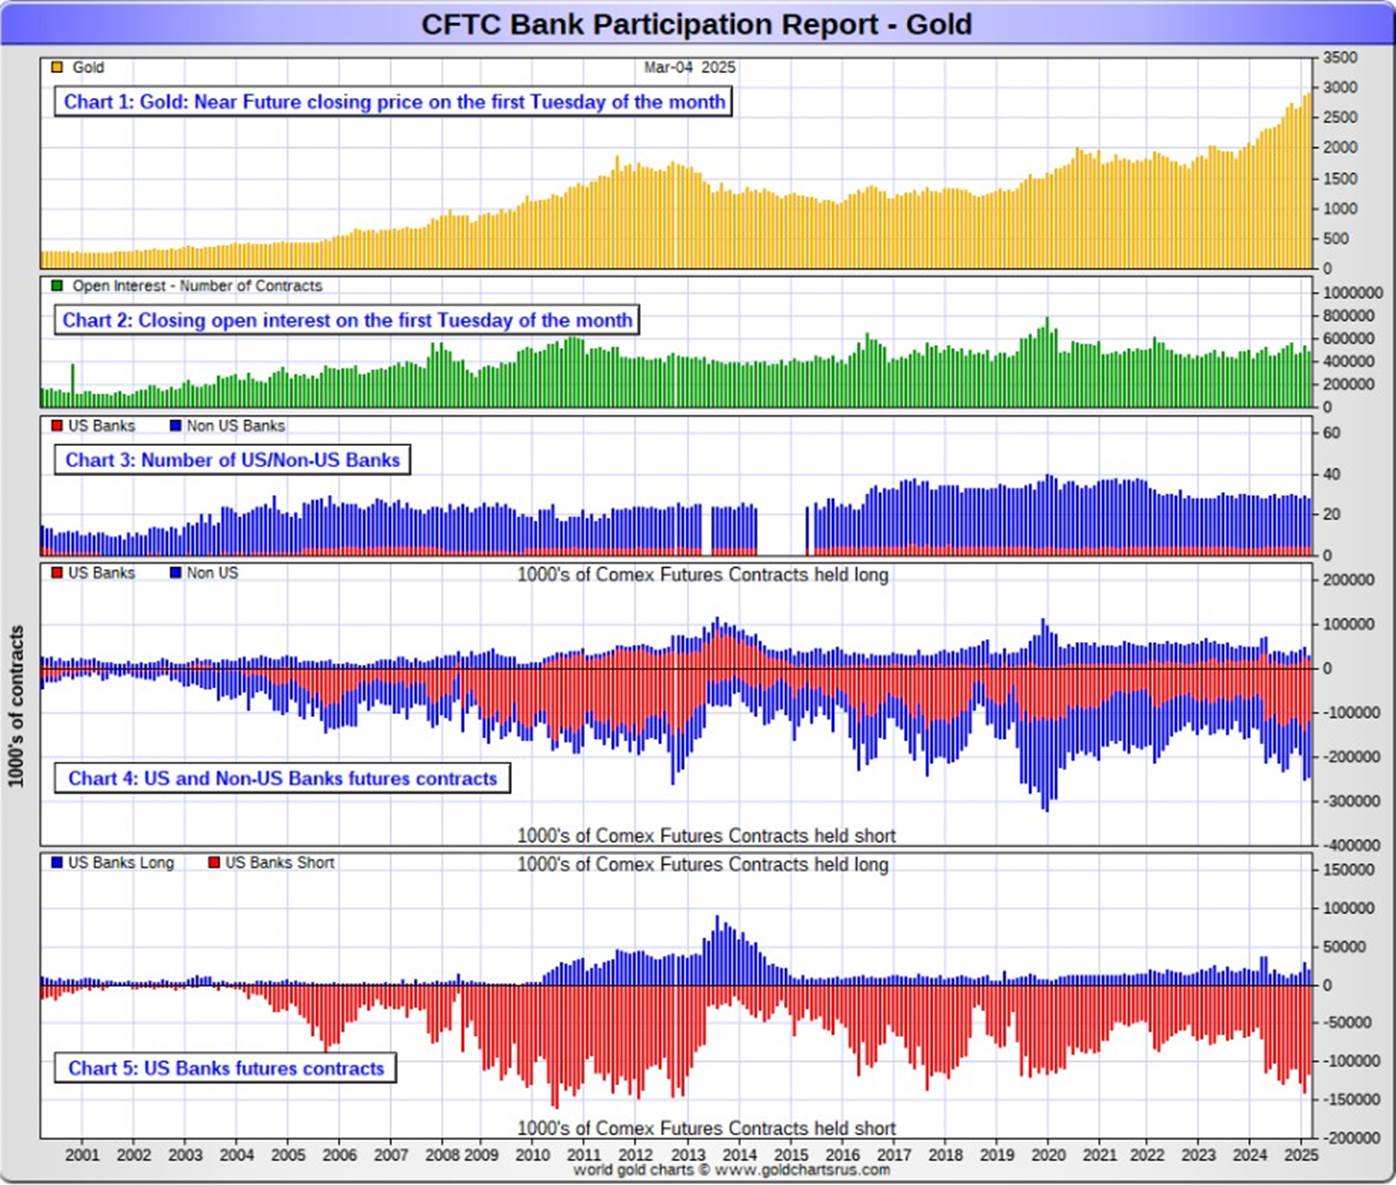
Here’s Nick’s BPR chart for gold going back to 2000. Charts #4 and #5 are the key ones here. Note the blow-out in the short positions of the non-U.S. banks [the blue bars in chart #4] when Scotiabank’s COMEX short position was outed by the CFTC in October of 2012. Click to enlarge.
In silver, 5 U.S. banks are net short 21,772 COMEX contracts, down 3,388 contracts from the 25,160 contracts that these same 5 U.S. banks were short in the February BPR. This decrease reverses the increase from the February BPR...plus a tad more.
The biggest short holders in silver of the five U.S. banks in total, would be Citigroup, Wells Fargo, Bank of America and JPMorgan.
Also in silver, 17 non-U.S. banks are net short 41,731 COMEX contracts, up a further 9,994 contracts from the 31,737 contracts that that these same non-U.S. banks were short in the February BPR...their biggest short position since last October's BPR. In the last two months, these non-U.S. banks have added a net 15,066 short contracts in silver.
It's a given that HSBC, Barclays and Standard Chartered hold by far the lion's share of the short position of these non-U.S. banks...as do some of Canada's banks as well...with the Bank of Montreal and Scotia Capital/Scotiabank coming to mind.
And, like in gold, the BIS could also be actively shorting silver. However, the remaining short positions divided up between the other 13 or so non-U.S. banks are immaterial — and have always been so....the same as most of the 23 non-U.S. banks in gold as well.
As of March's Bank Participation Report, 22 banks [both U.S. and foreign] were net short 43.5 percent of the entire open interest in silver in the COMEX futures market...which is outrageous — and up from the 33.4 percent that 22 banks were net short in the February BPR.
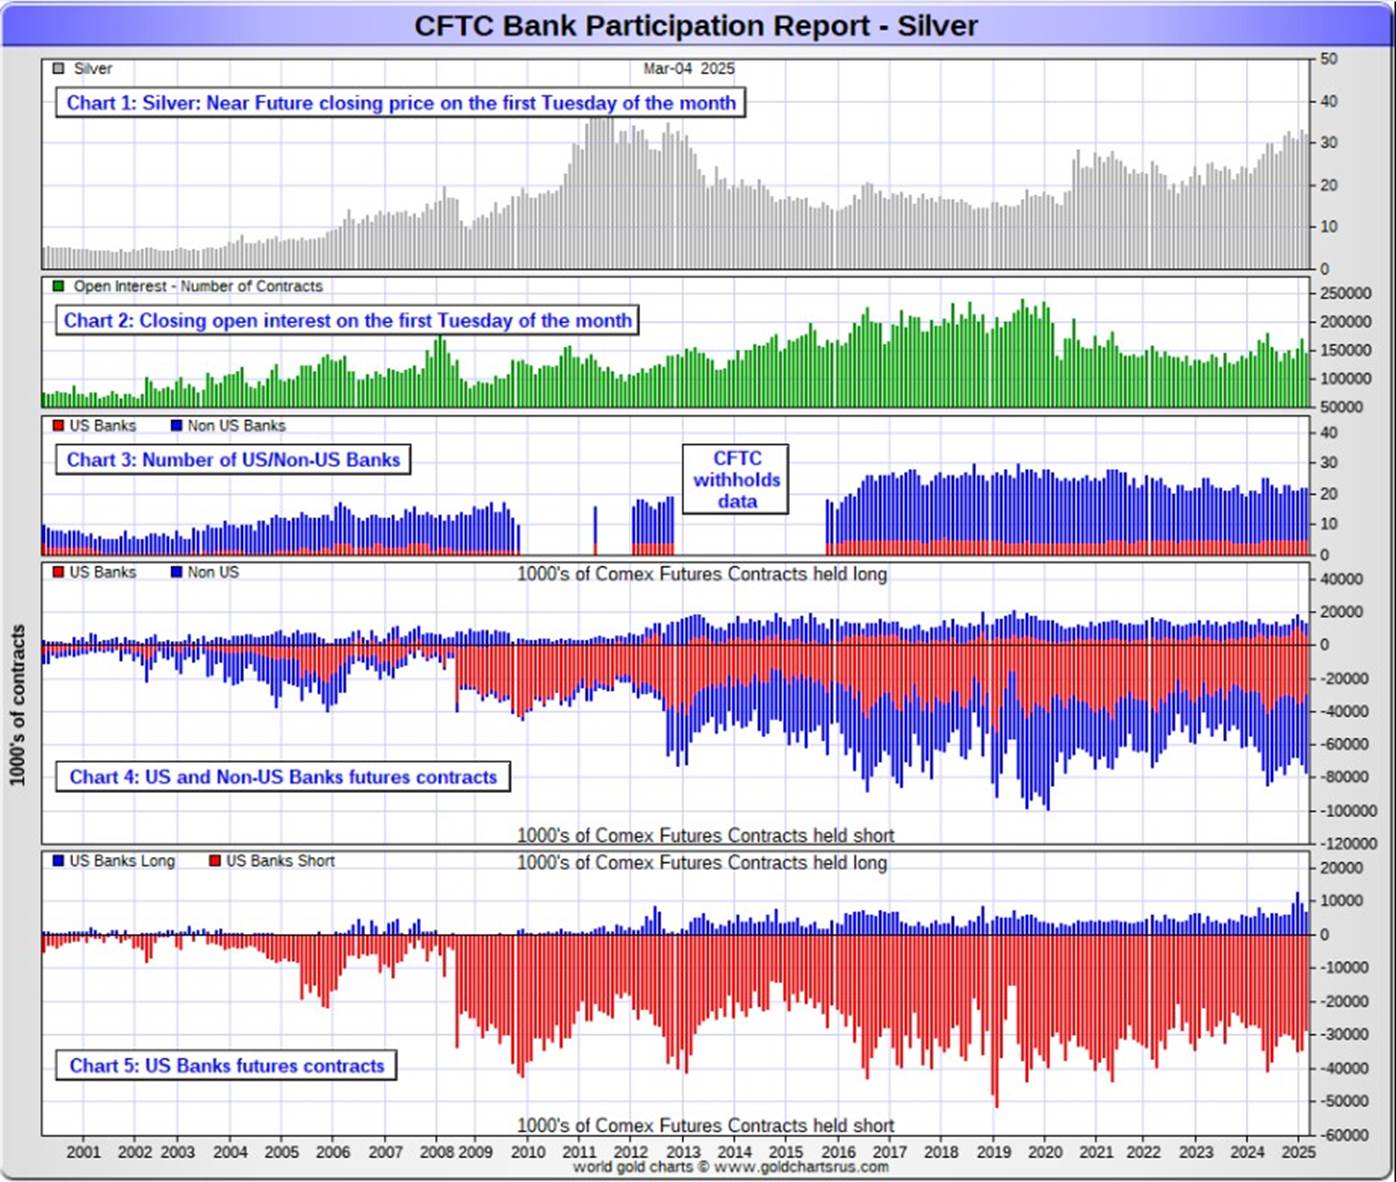
Here’s the BPR chart for silver. Note in Chart #4 the blow-out in the non-U.S. bank short position [blue bars] in October of 2012 when Scotiabank was brought in from the cold. Also note August 2008 when JPMorgan took over the silver short position of Bear Stearns—the red bars. It’s very noticeable in Chart #4—and really stands out like the proverbial sore thumb it is in chart #5. Click to enlarge.
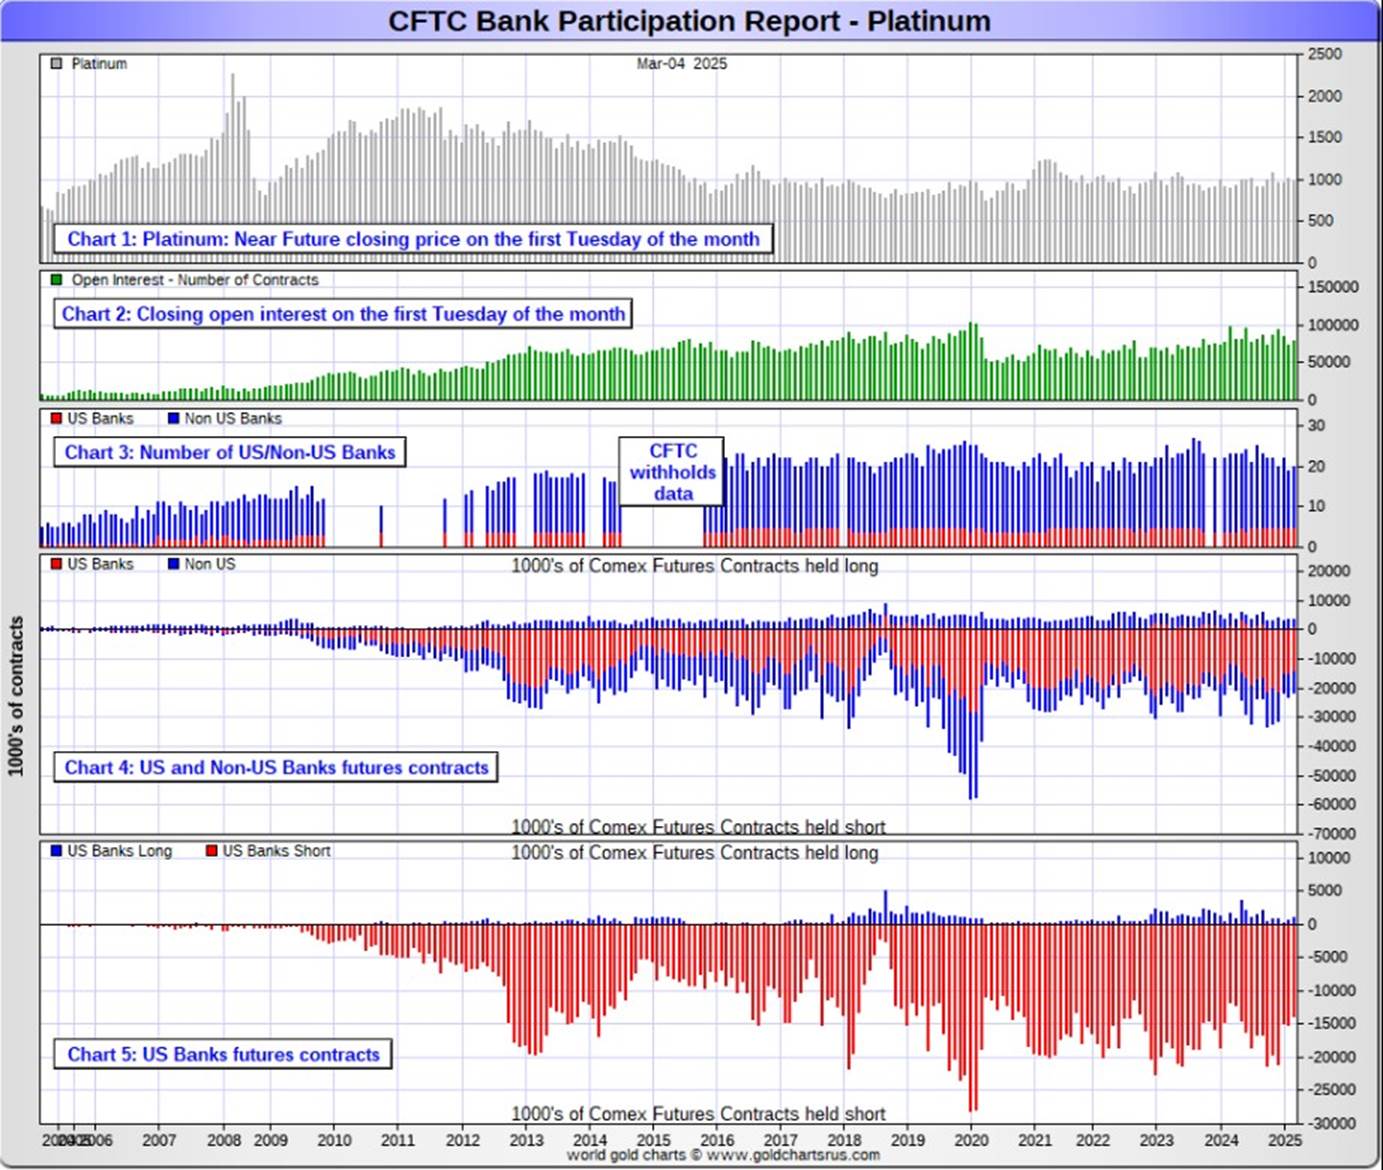
In platinum, 5 U.S. banks are net short 12,781 COMEX contracts in the March BPR, down 1,525 contracts from the 14,306 contracts that these same 5 U.S. banks were short in the February BPR -- but still an horrific amount.
At the 'low' back in September of 2018, these U.S. banks were actually net long the platinum market by 2,573 contracts. So they have a very long way to go just to get back to market neutral in platinum...if they ever intend to, that is. They look permanently stuck on the short side to me, a fact that I point out from time to time.
Also in platinum, the non-U.S. banks decreased their net short position by 307 contracts...from 5,449 contracts held by 14 banks in February's BPR... down to 5,142 contracts that 15 non-U.S. banks were net short in the March BPR.
Back in the December 2023 BPR, these non-U.S. banks were net short a microscopic 35 platinum contracts...so they've got more work to do if they ever want to get back to that number.
As you already know, platinum remains the big commercial shorts No. 2 problem child after silver. How it will ultimately be resolved is unknown, but most likely in a paper short squeeze, as the known stocks of platinum are minuscule compared to the size of the short positions held -- and that's just the short positions of the world's banks I'm talking about here.
Of course there's now a long-term structural deficit in it [and palladium] as well -- and I had a story about that in the Critical Reads section a couple of days ago.
And as of March's Bank Participation Report, 20 banks [both U.S. and foreign] were net short 22.6 percent of platinum's total open interest in the COMEX futures market, down from the 27.0 percent that 19 banks were net short in February's BPR.
Here's the Bank Participation Report chart for platinum. Click to enlarge.
In palladium, 5 U.S. banks are net long 2,169 COMEX contracts in the March BPR, up 405 contracts from the 1,764 contracts that that these same 5 U.S. banks were net long in the February BPR.
Also in palladium, 7 non-U.S. banks are gross long 647 COMEX contracts...as they only hold long positions, up from the 240 contracts that 6 non-U.S. banks were net long in the February BPR.
And as I've been commenting on for almost forever, the COMEX futures market in palladium is a market in name only, because it's so illiquid and thinly-traded. Its total open interest in yesterday's COT Report was only 19,942 contracts...compared to 79,207 contracts of total open interest in platinum...145,935 contracts in silver -- and 489,270 COMEX contracts in gold.
Total open interest in palladium has increased quite a bit over the last few years, because I remember when it was less than 9,000 contracts. So it's nowhere near as illiquid as it used to be -- and it's also been helped along by the fact that the bid/ask is now only 40 bucks. It used to be $150 at one point way back when.
As I say in this spot every month, the only reason that there's a futures market at all in palladium, is so that the Big 8 commercial traders can control its price. That's all there is, there ain't no more.
As of this Bank Participation Report, 12 banks [both U.S. and foreign] are net long 14.1 percent of total open interest in palladium in the COMEX futures market...up from the 11.6 percent of total open interest that 11 banks were net long in the February BPR.
For the last 5 years or so, the world's banks have not been involved in the palladium market in a material way...see its chart below. And with them still net long, it's almost all hedge funds and commodity trading houses that are left on the short side. The Big 8 commercial shorts, none of which are banks, are short 50.6 percent of total open interest in palladium as of yesterday's COT...up 10 percentage points month-over-month.
Here’s the palladium BPR chart. Although the world's banks are net long at the moment, it remains to be seen if they return as big short sellers again at some point like they've done in the past. Click to enlarge.
Excluding palladium for obvious reasons, and almost all of the non-U.S. banks in gold, silver and platinum...only a small handful of the world's banks, most likely no more than a dozen or so in total -- and mostly U.S. and U.K.-based...along with [maybe] the BIS...continue to hold meaningful short positions in the other three precious metals...although I won't let Canada's Bank of Montreal or Scotia Capital/Scotiabank off the hook just yet...nor Deutsche Bank in gold.
As I pointed out above, some of the world's commodity trading houses and hedge funds are also mega net short the four precious metals...far more short than the U.S. banks in some cases. They have the ability to affect prices if they choose to exercise it...which I'm sure they're doing at times -- and this is particularly obvious in the thinly-traded and illiquid palladium market. But it's still the collusive Anglo/American banking cartel in the commercial category that are at Ground Zero of the price management scheme in the COMEX futures market in the other three.
And as has been the case for years now, the short positions held by the Big 4/8 traders is the only thing that matters...especially the short positions of the Big 4...or maybe only the Big 1 or 2 in both silver and gold. How this is ultimately resolved [as Ted kept pointing out] will be the sole determinant of precious metal prices going forward.
The Big 8 commercial traders continue to have an iron grip on their respective prices -- and it will remain that way until they either relinquish control voluntarily, are told to step aside...or get overrun.
Considering the current state of affairs of the world as they stand today -- and the structural deficit in silver -- and now in platinum and palladium as well, the chance that these big bullion banks and commodity trading houses could get overrun at some point, is no longer zero -- and certainly within the realm of possibility if things go totally non-linear, as they just might if the drain on LBMA gold and silver stockpiles continues.
But...as Ted kept reminding us from time to time...if they do finally get overrun, it will be for the very first time...which obviously wasn't allowed to happen this past month, either.
The next Bank Participation Report is due out on Friday, April 4.
I don't have all that many stories, articles or videos for you today -- and I didn't bother posting Doug Noland's commentary, as he was off on another off-topic rant for the second week in a row.
![]()
CRITICAL READS
U.S. payroll growth totals 151,000 in February, less than expected
Job growth was weaker than expected in February though still stable despite President Donald Trump’s efforts to slash the federal workforce.
Non-farm payrolls increased by a seasonally adjusted 151,000 on the month, better than the downwardly revised 125,000 in January, but less than the 170,000 consensus forecast from Dow Jones, the Labor Department’s Bureau of Labor Statistics reported Friday. The unemployment rate edged higher to 4.1%.
The report comes amid efforts from Elon Musk’s Department of Government Efficiency to pare down the federal government, starting with buyout incentives and including mass firings that have impacted multiple departments.
Though the reductions likely won’t be felt fully until coming months, the efforts are beginning to show. Federal government employment declined by 10,000 in February though government payrolls overall increased by 11,000, the BLS said.
Many of the DOGE-related layoffs happened after the BLS survey reporting period, meaning they won’t be included until the March report. Outplacement firm Challenger, Gray & Christmas reported earlier this week that announced layoffs under Musk’s efforts totaled more than 62,000.
This CNBC news item appeared on their Internet site at 8:31 a.m. EST on Friday morning -- and comes to us courtesy of Patrik Ekdahl. Another link to it is here. Gregory Mannarino's post market close rant for Friday is linked here -- and this one runs for 28 minutes.
![]()
![]()
David Stockman on How Trump's Meeting With Zelensky Could Alter History
It goes without saying that the Donald can never get enough of the limelight. But recently in a live Oval Office broadcast seen around the world that thirst for public attention may have actually changed the course of history. And very much for the good—even if the trigger was pulled by a third rate actor who couldn’t even figure out how to properly brown-nose one of the most capacious egos on the planet.
For all practical purposes, therefore, Washington’s sick adventure in the destruction of a fake nation—along with the hideously unnecessary deaths of tens of thousands of real people who inhabit the Ukrainian territory—is now over.
Zelensky will soon be gone to a hideaway in such as Costa Rica or an unmarked grave, as the case may be. Thereafter a caretaker regent for the rump of what is now the Potemkin State that Lenin, Stalin and Khrushchev built with Bolshevik blood and guns will sign-up to a Trump/Putin ceasefire and partition deal—the latter having been in the making ever since the yoke of communism was lifted in 1991.
Indeed, the final splintering of "Ukraine" in the Oval Office itself will surely soon unmask the rationality-defying farce that has been the Washington/NATO proxy war against Russia in its own "borderlands". The latter term, of course, being the meaning of the word "ukraine" in Russian.
And we do mean monumental farce. As the most recent desultory chapter has unfolded since February 2022, in fact, the U.S. and E.U. combined have spent the staggering sum of nearly $400 billion to conduct a Demolition Derby on Russia’s doorstep in order for what?
Apparently, to pleasure the arms merchants of the U.S. and Europe with a grand occasion for the sale of beaucoup new weapons to replenish depleted NATO arsenals. And all in the name of more of the same old baloney about collective security and a "rules based international order".
This interesting and worthwhile commentary from David showed up on the internationalman.com Internet site on Friday -- and another link to it is here.
![]()
![]()
[LIVE from Moscow] -- Judge Andrew Napolitano: The INTEL Round Table w/Larry Johnson & Ray McGovern
This interesting and worthwhile interview with former CIA analysts McGovern and Johnson with the Judge as host, lasts for 26-minutes. It was posted on the youtube.com Internet site around noon EST on Friday -- and I thank Guido Tricot for sending it our way. Another link to it is here.
![]()
![]()
What do rising bond yields mean for gold and silver? -- Alasdair Macleod
E.U. defence spending plans are driving German, French, and Italian bond yields higher. Japan’s are soaring too. The dollar is sinking: what does it all mean for gold and silver?
This week, the end-February decline in gold and silver prices appear to be over, with a recovery based on a firm undertone. In early European trading this morning, gold was $2,920, up $60 from last Friday’s close, and silver $32.60, up $1.50.
Despite the recent transfers of physical gold into New York, there still appears to be a bear squeeze in place. Look at how COMEX Open Interest has declined in the last few months as gold has continued to rise.
Silver appears to have been behaving more normally until last week, when Open Interest fell significantly and the price less so. It points to a firm undertone, reflected in silver’s outperformance relative to gold in the last four trading sessions.
These are dollar prices. But the dollar weakened considerably this week against the euro and the yen, reflected in the chart of the USD Trade-Weighted Index/TWI.
The TWI has crashed back below its moving averages, indicating that a strong dollar is over for now, which is obviously supportive for gold and silver. But behind the dollar’s sudden weakness is euro and yen strength on the back of sharply rising bond yields in the two currencies.
Just when you might expect U.S. industry to have increasing confidence due to Trump’s trade protectionism, it is collapsing...as the GDPNow model is estimating a sharp contraction in GDP. Should this continue, all DOGE’s efforts to reduce the budget deficit will be overwhelmed by lower tax revenue and higher welfare costs. Worse still, a contracting GDP combined with rising government debt is the classic definition of an intensifying debt trap.
Putting all the evidence together, of rising government deficits in the US, Eurozone, and Japan at a time of declining private sector activity, markets are likely to wake up to rapidly increasing credit risk at the currency level. No wonder precious metals appear to be headed higher — possibly much higher — reflecting not so much an increase in their values, but currency debasement.
This multi-chart article from Alasdair was posted on the goldmoney.com Internet site on Thursday -- and I found it embedded in a GATA dispatch. Another link to it is here.
![]()
![]()
China's central bank reports raising gold reserves for fourth straight month in February
China's gold reserves rose to 73.61 million fine troy ounces at the end of February from 73.45 million at the end of January...about 5 tonnes...as the central bank kept buying the precious metal for a fourth straight month.
China's gold reserves were valued at $208.64 billion at the end of last month, up from $206.53 billion at the end of January, central bank data showed on Friday.
"The PBOC's purchases are an important factor underpinning gold, so a continuation of its buying in February could help to build further strength behind the gold price," said Frank Watson, market analyst at Kinesis Money.
U.S. import tariff fears, their potential effect on global economic growth and inflation as well as geopolitical uncertainty drove gold to a record high on February 24. Bullion rose by 27% in 2024, the most in 14 years.
This Reuters article put in an appearance on their website at 12:49 a.m. PST on Friday morning -- and I found it embedded in a GATA dispatch as well. Another link to it is here.
![]()
![]()
Perth Mint's gold, silver sales rise in February
The Perth Mint's gold product sales jumped in February, while silver sales rose 16% from the previous month, the refiner said on Friday, driven by strong demand.
Sales of gold coins and minted bars rose to 25,103 ounces in February, up 35% from January. On a year-on-year basis, they were down 47%.
Silver product sales increased to 482,451 ounces in February.
"It is heartening to see the increase in sales on January levels given precious metals prices remain at record highs," said Neil Vance, Perth Mint's general manager of minted products.
Of course, in nominal terms, silver is light years away from what price it should be -- and gold too, for that matter.
This brief Reuters story from Thursday afternoon PST was picked up by the finance.yahoo.com Internet site -- and I found it on Sharps Pixley. Another link to it is here.
![]()
![]()
Why silver is the new gold -- The Economist
It is a fabulous time to be a gold bug. Not long ago, outing yourself as one was a good way of getting people to back away from you at an investment conference. The popular image was of someone in possession of their own electricity generator, stacks of water-purification tablets and several years’ supply of tinned food. Now it just features a shrewd investor. Since the start of 2023 the shiniest asset’s price has soared by nearly 60% in dollars. That is more than any of the world’s leading share indices—including, after a turbulent couple of weeks, America’s S&P 500.
Yet the sweetest vindication goes to fans of another precious metal. Even gold enthusiasts tend to view an ardent interest in silver as somewhat eccentric. To traders it is the “poor man’s gold” or “the devil’s metal”. For years those nicknames were justified by silver’s lacklustre returns and the wild ride its price took along the way. The devil’s metal is still not for the faint-hearted. But it has almost kept pace with gold over the past year and has outperformed it over the past five. With investment flows now following returns, a once-niche asset is inching towards the mainstream.
Logic suggests that silver’s price should move similarly to gold’s. It, too, is rare, pretty and inert, and so has been used to forge jewellery and coins for millennia. This long-established role as a store of value lends it “safe-haven” appeal when investors are nervous. As with gold, the fixed amount of silver in the Earth’s crust ought also to make it a good hedge against inflation. Sure enough, both metals’ recent rallies came as investors fretted over geopolitical chaos and persistently rising prices. In doing so they overcame another common tendency, for their prices to fall when real interest rates rise and vice versa, since they generate no income.
This interesting silver-related article show up in The Economist no less...which is a surprise. It was posted there on Wednesday -- and I thank Patrik Ekdahl for his second contribution to today's column. Another link to it is here.
![]()
QUOTE of the DAY

![]()
The WRAP
"Understand this. Things are now in motion that cannot be undone." -- Gandalf the White
Today's pop 'blast from past' is an American rock classic that needs no introduction whatsoever...the song and band are instantly recognizable. There are two links to it...here -- and here, as the first one may not be available in your country. Of course there's a bass cover to this, which is fairly intricate -- and that's linked here.
Today's classical 'blast from the past' is the last of the Brandenburg Concertos ...No. 6 in B-flat major, BWV 1051 -- and what makes this work unusual, is the total lack of violins or wind instruments.
Of the six Brandenburg concertos, it's the least played as a stand-alone work -- and only the third movement would be familiar to most.
Here's the Orchestra Mozart performing at the Teatro Municipale Valli in Reggio Emilia, Italy in 2007 -- and the link is here.
![]()
It was obvious to me, even in the early going in Globex trading on Thursday evening in New York -- and up until the morning gold fix in London, that the powers-that-be had the precious metals on a short leash -- and they took no prisoners after the non-farm payroll report came out at 8:30 a.m. EST.
And that was regardless of the fact that the dollar index was down again on the day...down 342 basis points on the week...a monster drop -- and as you can tell from their respective 6-month charts below, not much of that was allowed to manifest itself in the prices of either silver or gold. That's how tight a rein they have on them at the moment.
Gold was closed down only $1.10 in the spot market...but down $12.50 in its current front month, which is April. Silver was down only 11.5 cents in the spot market...but down 53 cents in its current front month, which is May.
Although platinum traded above both its 50 and 200-day moving averages intraday on Friday, it was closed below both of them by the time the day was done...down $13.20 in its current front month. Palladium has been barely allowed to move all week...closing within a dollar or so of $955 in its current front month for the last four trading sessions in a row.
Copper gave back a decent portion of its Wednesday gain, as it was closed down 10 cents at $4.71/pound.
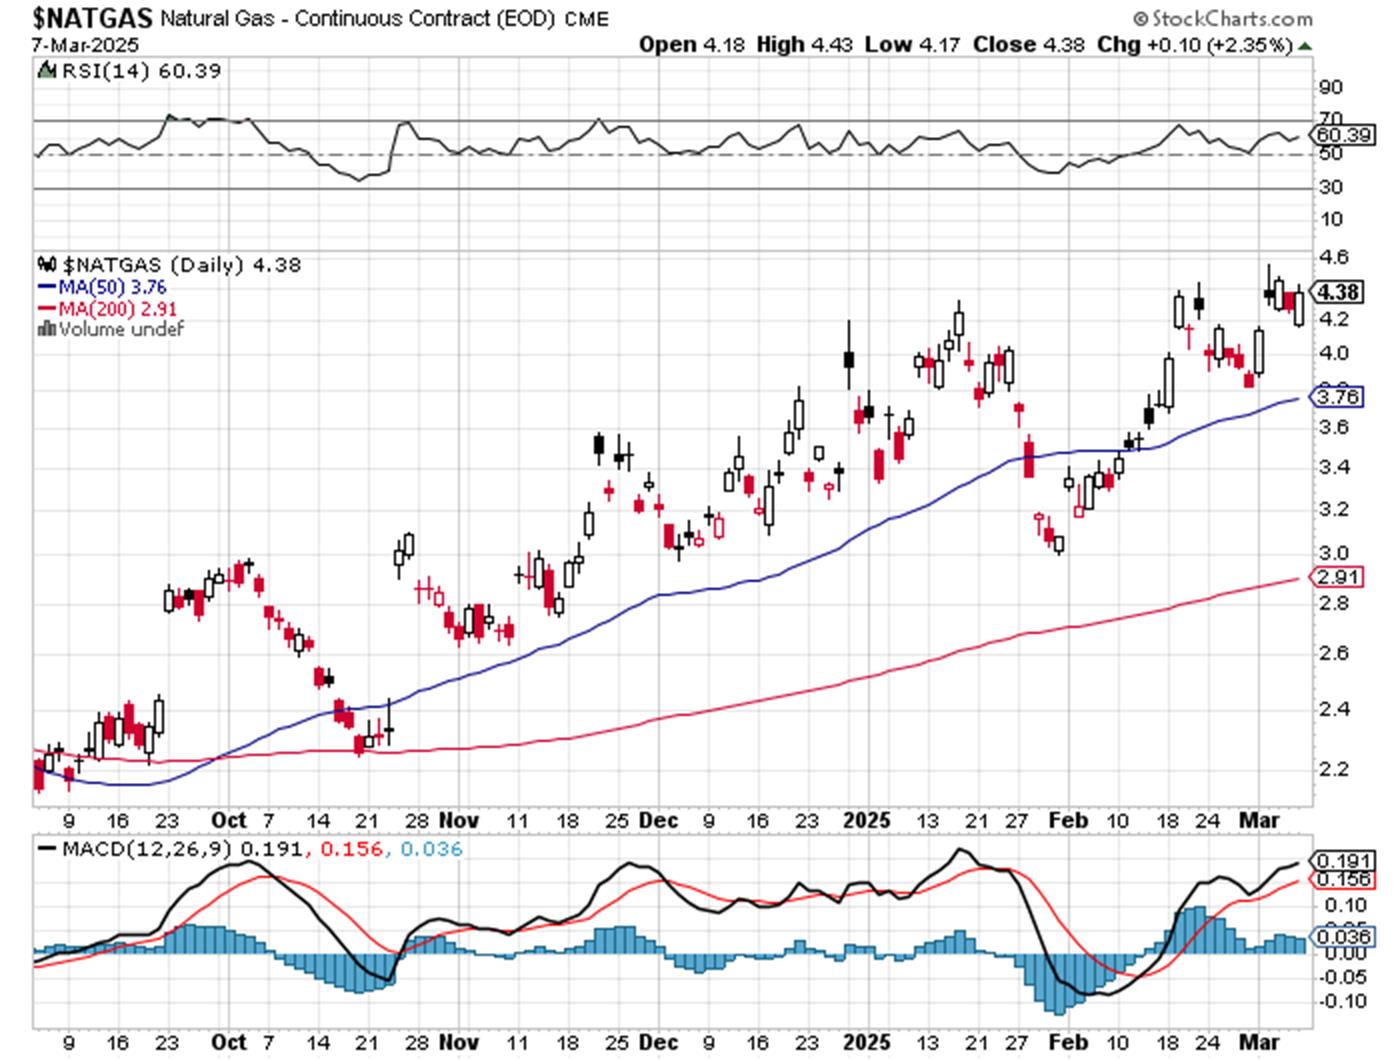
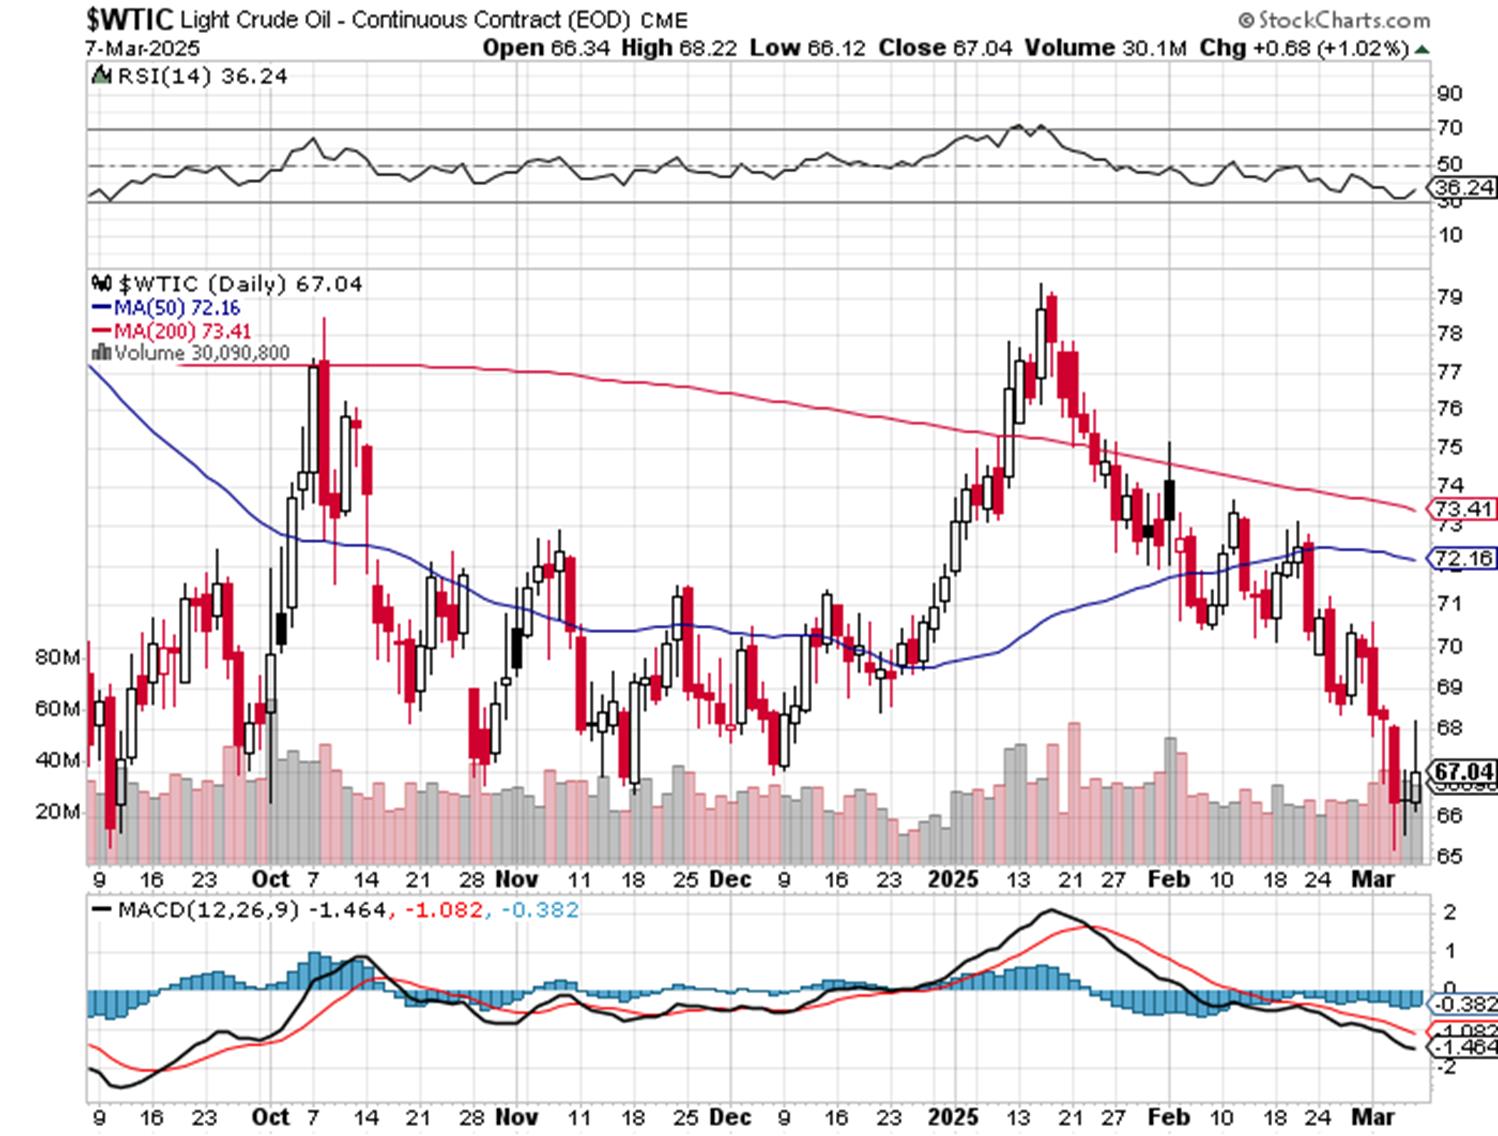
Natural gas...chart included...closed up a dime at $4.38/1,000 cubic feet -- and WTIC finally was allowed to catch a bid, as it closed higher by 68 cents at $67.04/barrel...but still a country mile below any moving average that matters.
Here are the 6-month charts for the Big 6+1 commodities...courtesy of stockcharts.com as always and, if interested, their COMEX closing prices in their current front months on Friday should be noted. Click to enlarge.
"There's something happening here. What it is ain't exactly clear." -- Buffalo Springfield, "For What It's Worth"...1967
On Thursday evening, Nick sent around the charts showing gold imports into the U.S...and updated with January's data. It was immediately apparent that the 43.479 tonne import number shown was pure b.s...as the 220 tonnes imported from Switzerland weren't there -- and neither were the tonnages from Australia, Canada or any other country...nor London.
That 43.479 tonnes doesn't even come close to what was deposited in the COMEX that month, either...so whatever is going on, the central and bullion banks in the West want to keep it hidden from public view. Nick thought it might be central bank gold...but that's speculation. However, he could be right.
The U.K. has yet to update import/export data for January -- and it will be of some interest as to what it shows...especially shipments from them to the U.S. However, considering what Nick and I have seen already, I'm not at all hopeful that the numbers will reflect reality...especially considering the fact that the LBMA and the Bank of England are in technical default -- and have admitted as such. That's how monstrous the drain on their physical reserves have been year-to-date...all of which they've also admitted, has gone to the U.S.
Besides that -- and along with the seemingly unending amount of gold and silver being flown into the COMEX every day, I was somewhat taken aback by the gold and silver data in yesterday's Bank Participation Report.
I mentioned it further up, but will point it out again. Since the start of the year, the non-U.S. banks have almost tripled their short position in gold...from 41,398 contracts, up to 119,068 contracts in yesterday's report...their second highest short position on record. In silver, they've increased their short position by 56% over the same time period...from 26,665 COMEX contracts... up to 41,731 contracts. What that's all about, I don't know...but it is noteworthy -- and one can only fantasize about what their respective prices would be if they hadn't gone short so aggressively.
Of course the question that begs to be asked, is why these non-U.S. banks would throw themselves back on the short side so recklessly in this environment? As all that was going on, the U.S. banks reduced their short position in gold by a bit...but very little in silver.
And while on the subject of Europe and the U.K...the political fall-out from the U.S.A.'s continuing withdrawal from the conflict in the Ukraine, has gone even more into overdrive than it was a week ago.
The question as to whether NATO can survive without U.S. involvement going forward, has come under serious discussion. Even the survival of the European Union itself...along with its currency...is pretty much all that's being talked about over there now.
But no matter how this turns out, the Trump administration has made it clear in no uncertain terms that their interest in Europe is waning fast -- and all that remains to be seen is just how messy the divorce is going to be on both sides of the Atlantic, as the post-WW2 order over there, comes to an end.
The European/U.K. globalist power elite are in a blind panic about it...as are their brothers-in-arms in the U.S. All we can do is watch from the sidelines -- and hope that "We, the people..." aren't collateral damage in form or another.
Of course the Trump administration made their feeling felt on Europe and NATO long before they took the reins of power back in late January -- and I'm wondering if that's a large part of the reason why the financial elite are taking delivery of such large quantities of gold and silver from the COMEX.
Besides which -- and if you look at the exports from the U.K., Switzerland and other countries, far more gold and silver has been flown in than required for delivery so far...so maybe [and this is speculation] those at the top of the economic and financial food chain in Europe and the U.K...want to move their metal out, before things really begin to circle the drain in earnest over there, as those U.S. 25% tariffs loom.
Who really knows for sure...but whatever it is, it has spooked the financial power elite -- and has manifested itself in a major way in the precious metals world over the last several months...with no signs yet that it's slowing down.
As Gandalf the White said..."Things are now in motion that cannot be undone."
He would be right about that.
And despite the ongoing efforts by the collusive commercial shorts of whatever stripe, I'm still "all in" -- and will remain so [as always] to whatever end.
See you on Tuesday.
Ed
About the author

SUBSCRIBE: https://edsteergoldsilver.com/

Ed Steer’s Daily Analysis of the Gold and Silver Markets
After eight years of writing about the precious metals for Casey Research, the folks at Stansberry & Associates—who just recently purchased controlling interest in the company—decided that my ‘niche market’ column didn’t fit into their plans.
Since the time that Casey Research was kind enough to offer me a stand-alone column, it became their most highly-rated blog almost from the outset—and has remained that way up to this date...