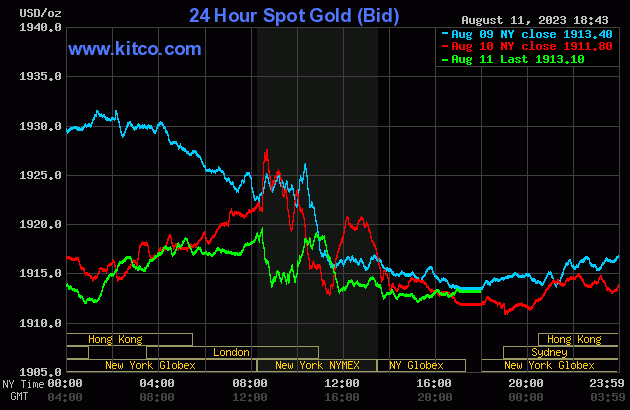
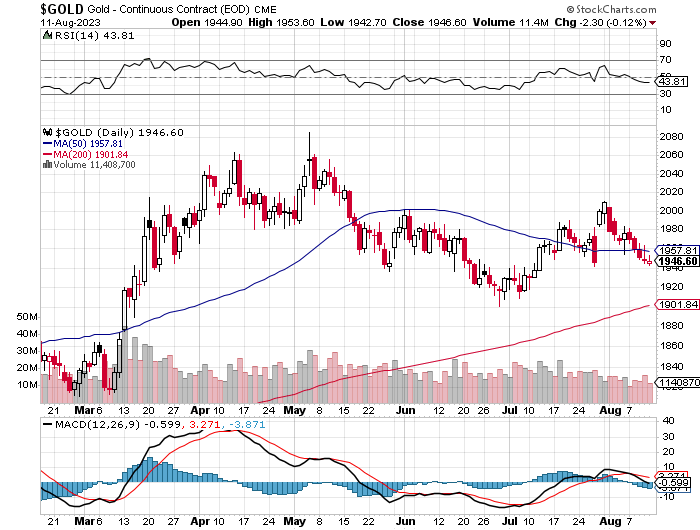
The gold price had a quiet and broad up/down move between 8 a.m. and around 1 p.m. China Standard Time in GLOBEX trading on their Friday -- and from there it worked its way unevenly higher until it ran into 'da boyz' when the latest PPI number hit the tape at 8:30 a.m. in Washington. It was then engineered lower until 8:55 a.m. -- and then rallied a bit going into the 10 a.m. EDT afternoon gold fix in London. It was sold lower anew starting about ten minutes after the 11 a.m. EDT London close -- and that lasted until around 11:50 a.m. It didn't do a whole heck of a lot after that.
The low and high ticks in gold were recorded as $1,924.00 and $1,934.40 in the October contract -- and $1,942.70 and $1,953.60 in December. The August/October price spread differential in gold at the close in New York yesterday was $14.80...October/December was $18.90...December/February was $19.90 -- and February/April was $19.30 an ounce.
Gold was closed in New York on Friday afternoon at $1,913.10 spot, up $1.30 on the day. Net volume in October and December combined was exceedingly light at a bit under 124,500 contracts -- and there were only 2,600 contracts worth of roll-over/switch volume on top of that.
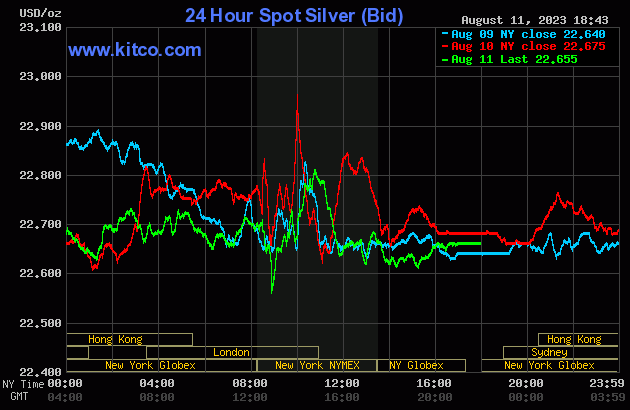
The silver price wandered/chopped broadly and unevenly sideways during the entire GLOBEX trading session on Friday and, like gold, was hammered lower on the 8:30 a.m. EDT PPI report. It chopped unevenly higher from there until 10:45 a.m. in COMEX trading -- and was then sold lower until around 11:50 a.m...just like gold as well. From there it didn't do much for the rest of the day.
The low and high ticks in silver, both of which occurred during the COMEX trading session in New York were reported by the CME Group as $22.61 and $22.91 in the September contract. The September/December price spread differential in silver at the close in New York yesterday was 33. 9 cents... December/March was 36.6 cents -- and March/May was 25.6 cents an ounce.
Silver was closed on Friday afternoon in New York at $22.655 spot, down 2 cents from Thursday. Net volume was very light at 34,000 contracts -- and there were a bit over 18,500 contracts worth of roll-over/switch volume out of September and into future months in this precious metal...mostly into December of course, but with noticeable amounts into March and May of next year as well.
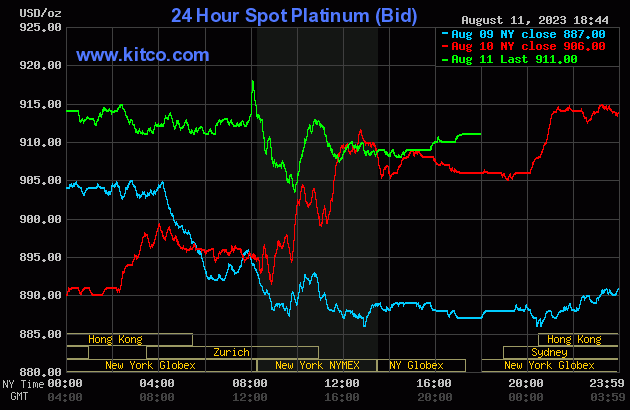
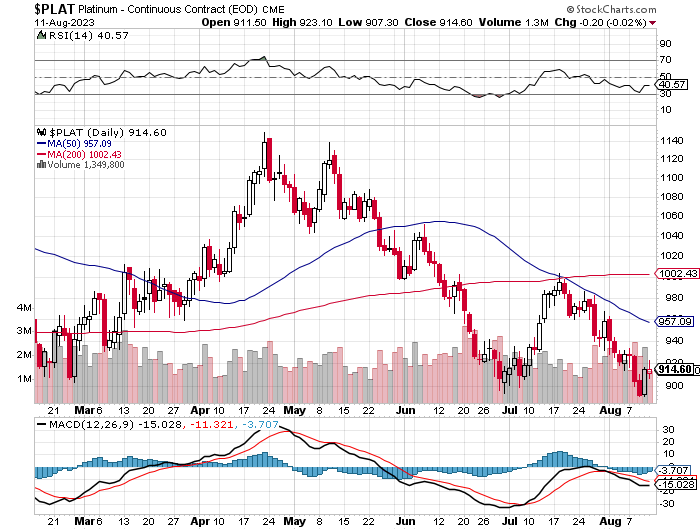
Platinum took off higher starting shortly after 8 a.m. China Standard Time in GLOBEX trading on their Friday morning -- and that lasted until 9 a.m. CST. From there it chopped quietly sideways to a bit lower until its price went vertical at 2 p.m. CEST in Zurich/8 a.m. EDT in New York. That was capped instantly -- and it was then sold lower until at or minutes before the 10 a.m. EDT afternoon gold fix in London. Its ensuing rally was capped minutes before the 11 a.m. EDT Zurich close -- and from that juncture it was sold a bit lower until minutes before 12 o'clock noon. It began to edge very quietly higher from there -- and that lasted until the market closed at 5:00 p.m. EDT. Platinum was closed at $911 spot, up 5 bucks from Thursday.
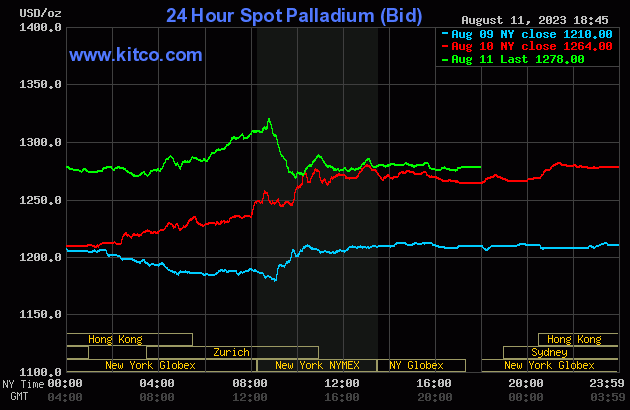
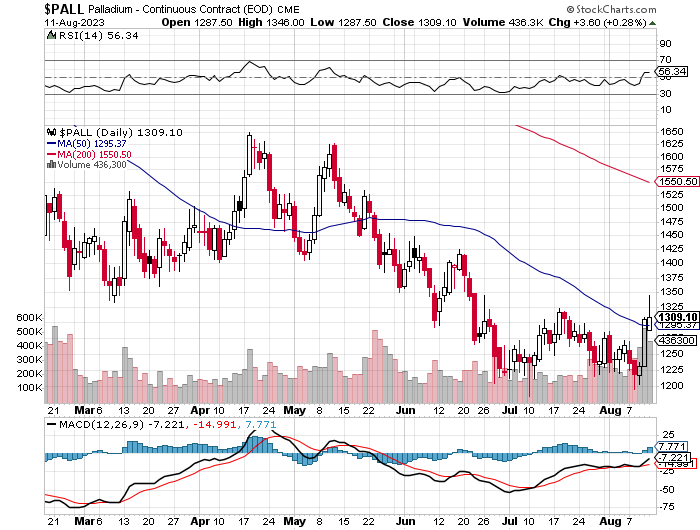
Palladium's price path was identical to platinum's in the early going in GLOBEX trading on Friday, except it began to head rather impressively higher starting at the 9 a.m. CEST Zurich open. That was allowed to last until a not-for-profit seller appeared minutes before 9 a.m. in COMEX trading in New York and also like platinum was sold lower until at or minutes before the 10 a.m. EDT afternoon gold fix in London. It also crawled quietly higher from there until trading ended at 5:00 p.m. Palladium was closed at $1,278 spot, up 14 dollars on the day, but 44 bucks off its Kitco-recorded high tick.
Based on the kitco.com spot closing prices in silver and gold posted above, the gold/silver ratio worked out to 84.4 to 1 on Friday...compared to 84.3 to 1 on Thursday.
Here's Nick's 1-year Gold/Silver Ratio chart, updated with last week's data. Click to enlarge.

![]()
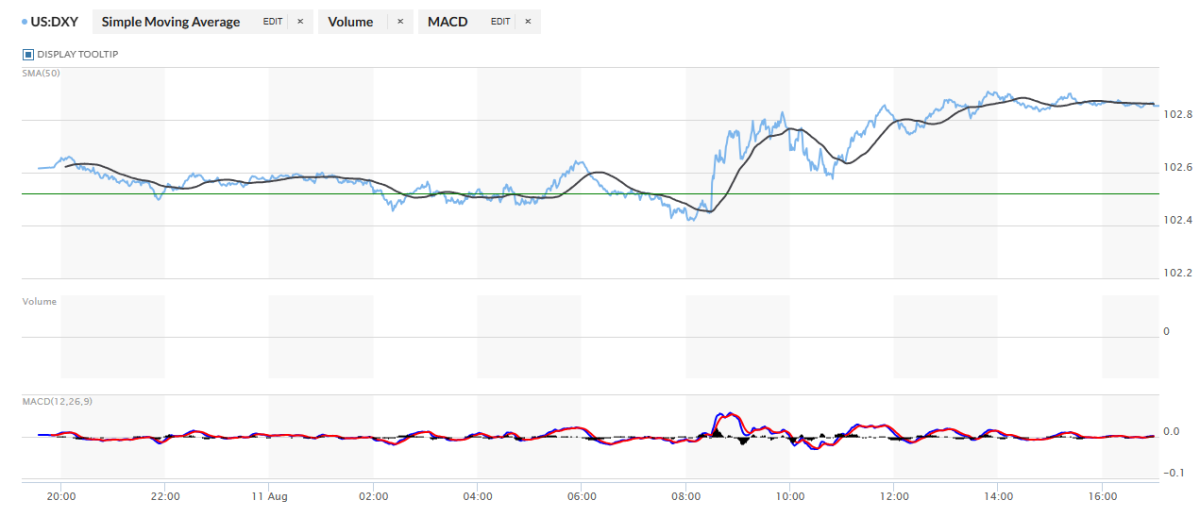
The dollar index closed very late on Thursday afternoon in New York at 102.52 -- and then opened higher by 10 basis points once trading commenced at 7:34 p.m. EDT on Thursday evening, which was 7:34 a.m. China Standard Time on their Friday morning. From there it wandered quietly and a bit unevenly lower until about twenty minutes before the PPI number came out at 8:30 a.m. in New York. Once that number hit the tape, the index wandered very unevenly and broadly higher until around 1:50 p.m. EDT. From that juncture it crept a bit lower until the market closed at 5:00 p.m.
The dollar index finished the Friday trading session in New York at 102.85...up 33 basis points on the day.
Here's the DXY chart for Friday, thanks to marketwatch.com as usual. Click to enlarge.
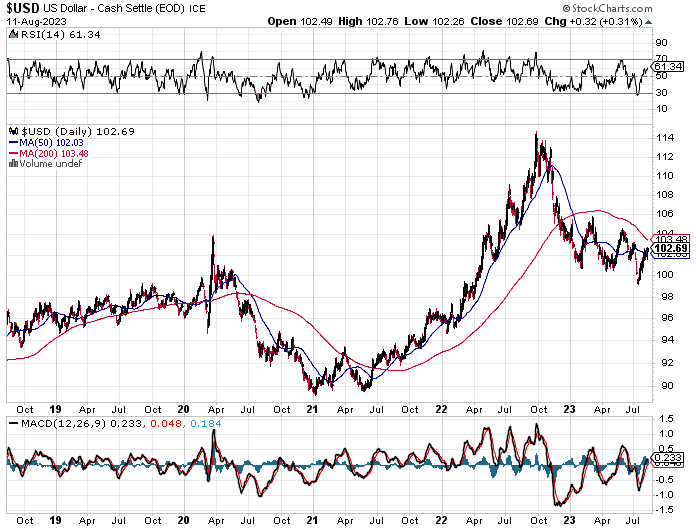
And here's the 5-year U.S. dollar index chart that appears in this spot every Saturday, courtesy of stockcharts.com as always. The delta between its close...102.69...and the close on the DXY chart above, was 16 basis points below its spot close. Click to enlarge.
It was obvious from the action in both the precious metals and the currencies, that the powers-that-be were all over both during the New York trading session yesterday.
U.S. 10-Year Treasury: 4.1540%...up 0.0740 (+1.81%)...as of 12:59 p.m. EDT
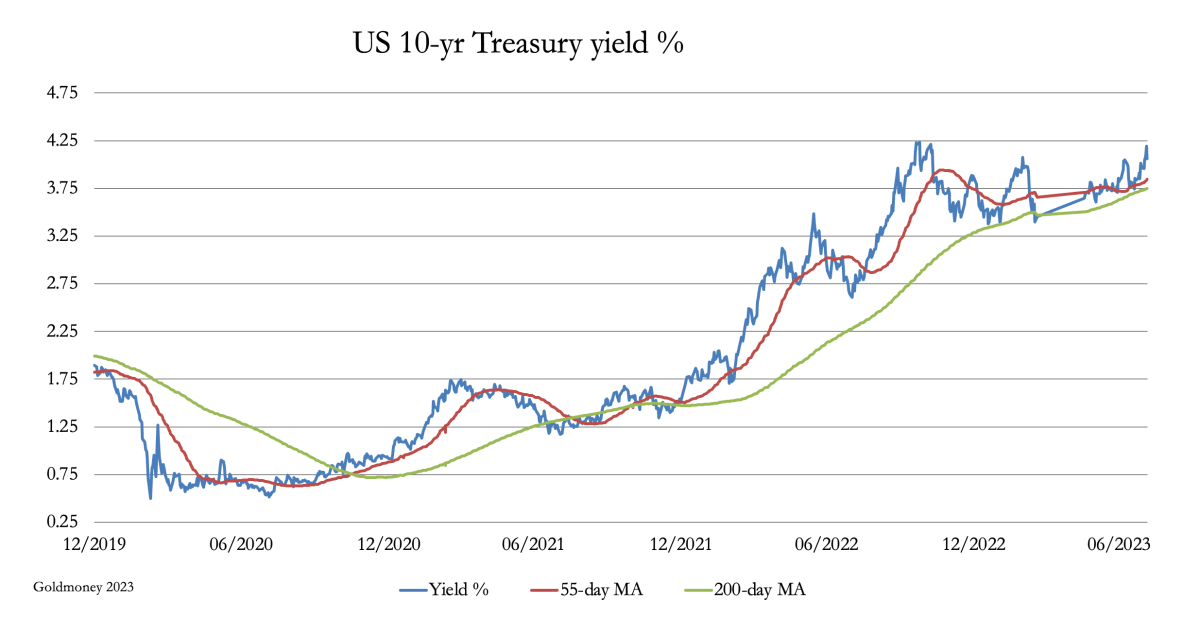
And here's the 5-year 10-year U.S. Treasury chart from the yahoo.com Internet site -- which puts the yield curve into a somewhat longer-term perspective. Click to enlarge.
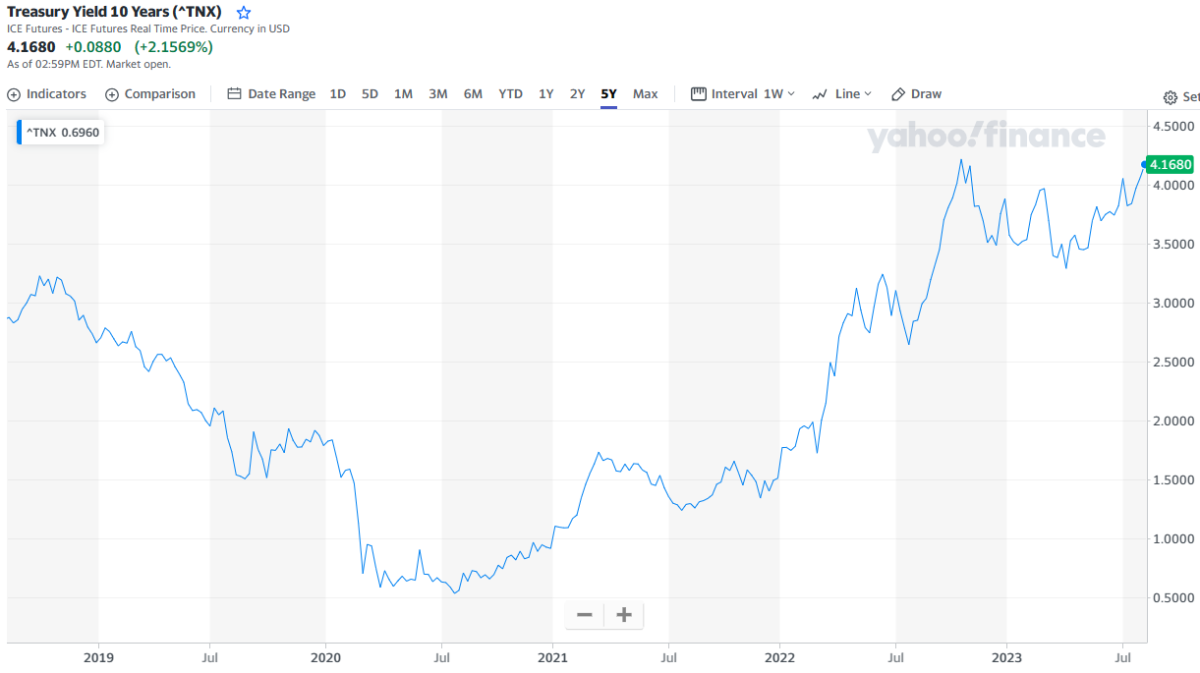
We have yet to close above the 4.213% high set back on October 17 of last year...but it appears that it's only a matter of time before that happens... unless the Fed gets really serious about buying up the treasury market across the yield curve.
![]()
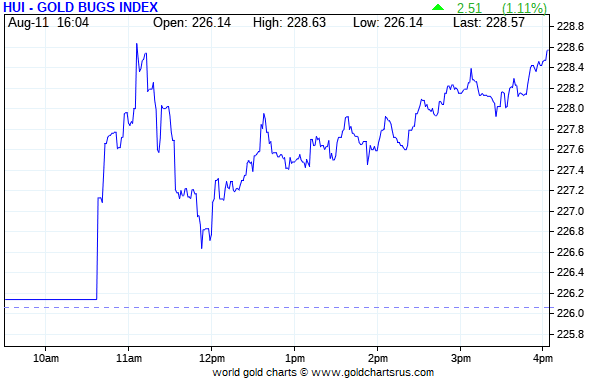
Once again the HUI trace was M.I.A. for an hour before it began to record data at Kitco -- and its high tick after that was set around 11:05 a.m. EDT in New York trading. Then, along with the gold price, the gold stocks were sold lower until 11:50 a.m. -- and despite the fact that the gold price didn't do anything after that, the gold shares began to tick higher -- and the HUI closed up 1.11 percent.
Computed manually, the new Silver Sentiment/Silver 12 Index finished the day higher by a hefty 2.79 percent...helped immensely by Coeur Mining, as it came roaring back after its big loss on Thursday.
Here's Nick's old 1-year Silver Sentiment/Silver 7 Index chart, updated with Friday's candle. Click to enlarge.
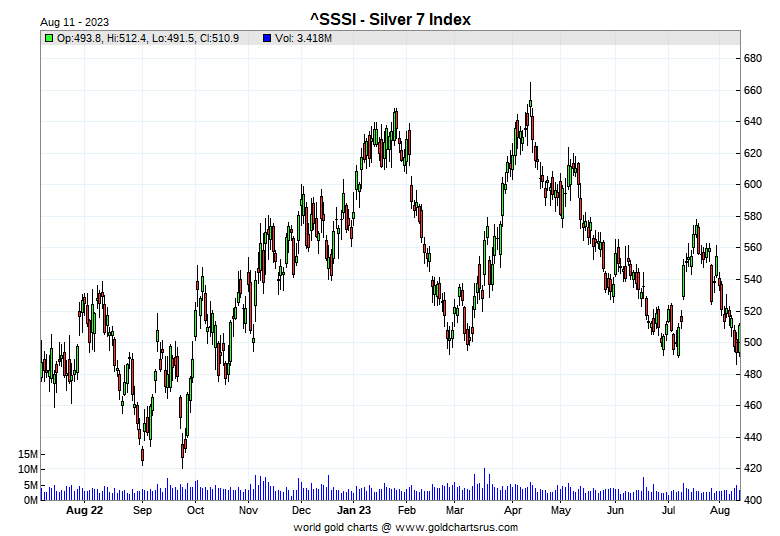
The star on Friday was Coeur Mining of course, as it closed up 8.86 percent -- and the other two big winners were First Majestic Silver and Hecla Mining, as they finished the day higher by 4.93 and 4.58 percent respectively.
It's hard not to think positive thoughts about the future price of silver based on their share price performance yesterday.
The reddit.com/Wallstreetsilver website, now under new management, is linked here. The link to two other silver forums are here -- and here.
![]()
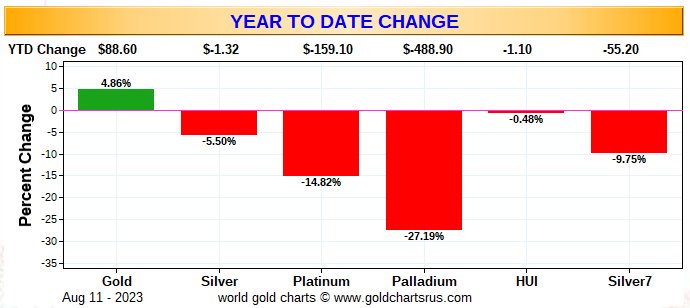
Here are the usual three charts that appear in every weekend missive. They show the changes in gold, silver, platinum and palladium in both percent and dollar and cents terms, as of their Friday closes in New York — along with the changes in the HUI and the old Silver 7 Index.
Here's the weekly chart and, like last week, only palladium finished in the green. There's nothing much else to see here. Click to enlarge.

Here's the month-to-date chart back in its usual spot, after being being M.I.A. last week. Palladium is still the only green bar to be seen -- and the silver equities 'outperformed' their golden cousins relative to the price declines in their underlying precious metals...which is not much to cheer about.

Here's the year-to-date graph -- and after three weeks of ongoing engineered price declines, the only thing green on it is the gold price. That's because it hasn't been beaten down as much as silver. The silver shares are still down on the year for the reason just given in the previous sentence. Of course -- and as I mention in this spot every Saturday -- and will continue to do so...is that if the silver price was sitting within 10 percent or so percent of its old high of $50 the ounce...like gold is currently within 10 percent or so of its old high of around $2,080...it's a given that the silver equities would be outperforming their golden cousins by an absolute country mile. That day still lies in our future. Click to enlarge.
The current 'wash, rinse, spin' cycle, courtesy of the commercial traders of whatever stripe appears to be nearing its end. That is discussed at length in the COT Report further down -- and again in The Wrap.
![]()
The CME Daily Delivery Report for Day 11 of August deliveries showed that 18 gold -- and zero silver contracts were posted for delivery within the COMEX-approved depositories on Tuesday.
In gold, the sole short/issuer was Wells Fargo Securities out of their house account. The three long/stoppers were JPMorgan, the CME Group and Advantage, as they picked up 10, 6 and 2 contracts...the CME Group for their own account.
The CME Group immediately reissued theirs as 10x6=60 of those ten-ounce good delivery bar micro gold futures contracts. The three long/stoppers for them were Advantage, Morgan Stanley and ADM, as they picked up 36, 16 and 8 contracts for their respective client accounts.
The link to yesterday's Issuers and Stoppers Report is here.
The CME Preliminary Report for the Friday trading session showed that gold open interest in August fell by 68 contracts, leaving just 90 left, minus the 18 contracts mentioned a few paragraphs ago. Thursday's Daily Delivery Report showed that 79 gold contracts were actually posted for delivery on Monday, so that means that 79-68=11 more gold contracts just got added to the August Delivery month. Silver o.i. in August remained unchanged at zero contracts -- and no silver contracts were posted for delivery on Monday.
Total gold open interest at the close on Friday increased by 826 COMEX contracts -- but total silver o.i. jumped up by 3,062 contracts, which I suspect was more of these uneconomic and market-neutral spread trades being put on...something that Ted may comment on in his weekly review this afternoon. Both these numbers are subject to some revision by the time the final figures are posted on the CME's website later on Monday morning CDT.
![]()
There was another withdrawal [the ninth in a row] from GLD yesterday, as an authorized participant took out 120,657 troy ounces of gold. And, for the fourth day in a row, there was another counterintuitive deposit into SLV. This time an a.p. added 458,647 troy ounces of silver.
This past week there have been 3.58 million troy ounces of silver deposited in SLV -- and one has to suspect that it was being added to cover an existing short position. Ted and I discussed this briefly on the phone yesterday, along with increase in the short position in SLV -- and I know that he'll have something to say about both these matters in weekly review this afternoon.
In other gold and silver ETFs and mutual funds on Planet Earth on Friday, net of any changes in COMEX, GLD and SLV inventories, there were a net 114,085 troy ounces of gold removed, but a net 239,030 troy ounces of silver...mostly as a result of the 439,757 troy ounces of silver added to iShares/SVR -- and the 145,236 troy ounces taken out of Deutsche Bank.
There was no sales report from the U.S. Mint yesterday -- and all they've produced month-to-date so far were the 15,000 troy ounces of gold eagles and 823,000 silver eagles that I reported earlier this week.
![]()
There was some decent activity in gold over at the COMEX-approved depositories on the U.S. east coast on Thursday, as 643.020 troy ounces/20 kilobars were received -- and 96,453.000 troy ounces/3,000 kilobars were shipped out. All of this happened at Brink's, Inc.
There were some rather minor paper changes -- and the two biggest were the 4,963 troy ounces that were transferred from the Eligible category and into Registered...most likely scheduled for immediate delivery in the August contract. The other large amount were the 3,894 troy ounces that were transferred from the Registered category and back into Eligible over at Brink's, Inc.
The link to Thursday's COMEX activity in gold, is here.
There was fairly decent activity in silver, as 39,422 troy ounces were reported received, all of which arrived at Delaware -- and 614,436 troy ounces were shipped out.
In the 'out' category, the lion's share was the one truckload/593,298 troy ounces that left JPMorgan. The remaining 15,246 and 5,891 troy ounces departed CNT and Delaware respectively.
There was some paper activity, as 237,678 troy ounces were transferred from the Registered category and back into Eligible over at Manfra, Tordella & Brookes, Inc.
The link to all of Thursdays' COMEX silver action is here.
There was some activity over at the COMEX-approved gold kilobar depositories in Hong Kong on their Thursday...all of it at Brink's, Inc. They received 867 kilobars -- and shipped out 139 of them. The link to this, in troy ounces, is here.
![]()
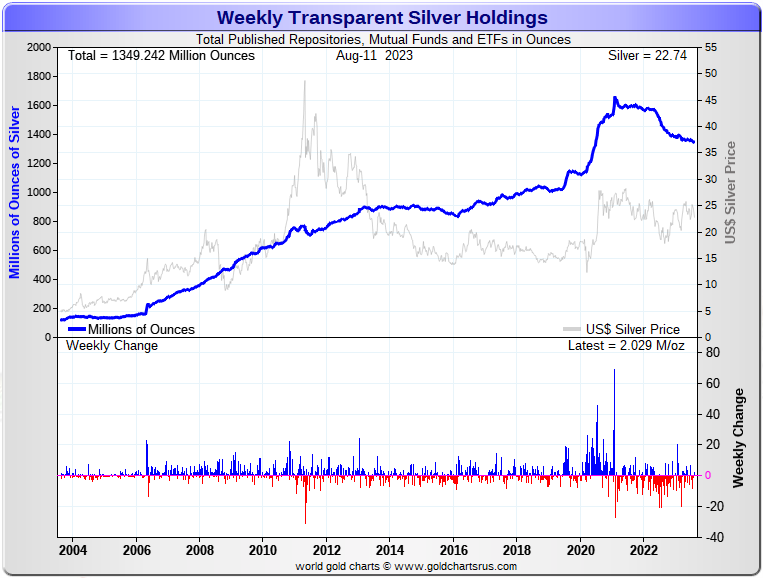
Here are the usual 20-year charts that show up in this space in every Saturday column. They show the total amounts of physical gold and silver held in all know depositories, ETFs and mutual funds as of the close of business on Friday.
During the week just past, there were a net 369,000 troy ounces of gold removed -- but a net 2.029 million troy ounces of silver was added. Click to enlarge for both.
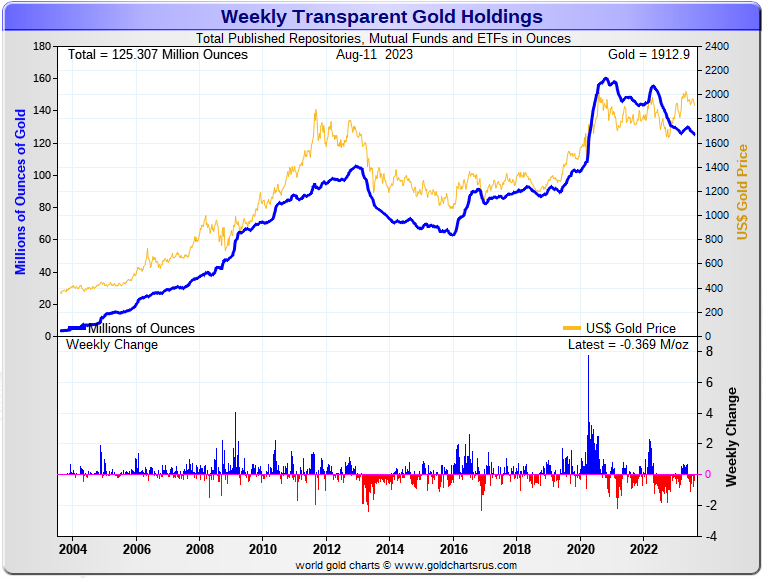
According to Nick Laird's data on his website, there have been a net 1.663 million troy ounces of gold removed -- and a net 3.776 million troy ounces of silver has been taken out as well in all the world's known depositories, mutual funds and ETFs during the last four weeks.
In gold, the only net 'in' amount were the 4,272 troy ounces that arrived at ETF Securities/GOLD.ASX. Every other ETF, mutual fund and depository is in the red. The two largest 'out' amounts by far were the 513,000 troy ounces that left GLD...followed by the 219,000 troy ounces that departed iShares/SGLN. After them were the 169,000 troy ounces that left iShares/IAU -- and the 154,000 troy ounces out of ETF Source/SGLN. The list goes on and on...
In silver, the only depository showing a net inflow was the COMEX...as they received a net 3.941 million troy ounces. The largest 'out' amount were the net 3.310 million troy ounces that left SLV. In second spot were the 2.661 million troy ounces taken out of iShares/SVR -- and in very distant third place were the 576,000 troy ounces removed from Source/SSLV. The list goes on and on here as well.
Retail bullion sales remain comatose. That situation will exist until the next buying frenzy commences...which is coming as surely as night follows day when the next rally is allowed to begin. When that time comes, we will be back to shortages/back orders and high premiums in very short order.
The physical demand in silver at the wholesale level continues unabated. This means that most of what's left in their inventories is not available for sale... especially the COMEX, where new silver has to be brought in from other sources [JPMorgan?] to meet the ongoing rabid demand for physical metal.
The vast majority of precious metals being held in these depositories are by those who won't be selling until the silver price is many multiples of what it is today. That's particularly true of shareholders in PSLV.
Sprott's PSLV is the third largest depository of silver on Planet Earth with 175 million troy ounces -- and some distance behind the COMEX, where there are 280 million troy ounces being held. However, as Ted Butler has mentioned from time to time, it's most likely that 105 million troy ounces of that amount is actually held in trust for SLV. But PSLV is light years behind SLV, as they are the largest silver depository, with 452 million troy ounces as of Friday's close.
The latest short report from Wednesday, August 9th showed that the short position in SLV rose by a a hefty 18.71%...up to 27.10 million shares held short. Ted will certainly have something to say about this in his weekly review for his paying subscribers today. The next short report will be posted on The Wall Street Journal's website on Thursday, August 24th.
Then there's that other little matter of the 1-billion ounce short position in silver held by Bank of America...with JPMorgan & Friends on the long side. Ted says it hasn't gone away -- and he's also come to the conclusion that they're now short around 37 million ounces of gold with these same parties as well...up 12 million oz. from the 25 million they were short in the March OCC Report. You can read Ted's commentary about it linked here.
![]()
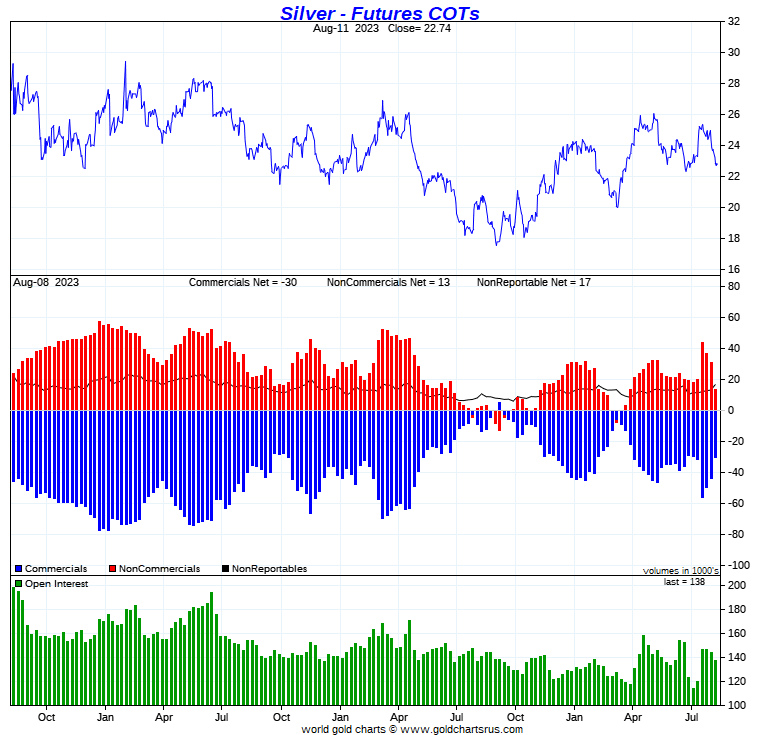
The Commitment of Traders Report, for positions held at the close of COMEX trading on Tuesday, 08 August, was everything that both Ted and I were hoping it would be...plus more.
In silver, the Commercial net short position dropped by 13,663 COMEX contracts, or 68.315 million troy ounces of the stuff.
They arrived at that number by increasing their long position by 2,677 contracts -- and also reduced their short position by 10,986 COMEX contracts. It's the sum of those two numbers that represents their change for the reporting week.
Under the hood in the Disaggregated COT Report, it was all Managed Money traders as expected, plus more...as they decreased their net long position by 16,439 COMEX contracts -- and are now back to being net short silver by 3,781 contracts.
The Other Reportables also decreased their net long position...them by 1,068 contracts. That meant that the Nonreportable/small traders had have increased their net long position during the reporting week -- and they did just that...by 3,844 COMEX contracts.
Doing the math: 16,439 plus 1,068 minus 3,844 equals 13,663 COMEX contracts, the change in the Commercial net short position.
The Commercial net short position in silver now stands at 30,349 COMEX contracts/151.745 million troy ounces...down those 13,663 contracts from the 44,012 COMEX contracts/220.060 million troy ounces they were short in August 4 COT Report.
The Big 4 shorts decreased their short position by 3,978 contracts, from 39,349 contracts, down to 35,371 contracts during the reporting week. Ted was of the opinion that the big Managed Money trader that had contaminated the Big 4 commercial short position, reduced their short position by around 5,000 contracts -- and is now back in the Big '5 through 8' category. And if that's the case, this Big 4 short figure is a pure number, as it's back to being composed of commercial traders only once again.
The '5 through 8' big shorts actually decreased their net short position by 4,496 contracts -- and are currently short 18,855 COMEX contracts in total.
The Big 8 shorts in total decreased their net short position from 62,700 contracts, down to to 54,226 COMEX contracts week-over-week...a drop of 8,474 contracts. But you have to subtract out the short position of that Managed Money trader...now down to 5,000 contracts...so the Big 8 commercial short position, in reality, is likely a bit under the 50,000 contract mark...which is the lowest its been like forever.
And because there's still that Managed Money trader contaminating the Big 8 commercial category, it's not possible to calculate the long position that Ted's raptors hold with with much accuracy...but in the "close enough" category, they added around 10,000 long contracts...leaving them net long something under 19,000 contracts. Their buying of long contracts had the mathematical effect of decreasing the Commercial net short position...which is not a decrease at all.
So most of the improvement in the Commercial net short position in silver was due to Ted's raptors adding to their long position...just as it was in last week's COT Report. This long position held by Ted's raptors is still rather smallish on an historical basis.
Don't forget, that despite their small size, they're still commercial traders in the commercial category -- and all in the Swap Dealers category.
Here's Nick's 3-year COT Report for silver, updated with the above data. Click to enlarge.
Ted was happy to see that the big Managed Money short covered about half of his short position -- and he admitted that this number was a 'best guess'...as I knew it had to be.
Ted also said that this big whale holding 10,000 long contracts in silver turned out to be a bit a myth, as this week's COT data showed that it was two traders holding a 10,000 contract long position between them...one in the Managed Money category -- and the other in the Other Reportables.
Both got blown out during the reporting week -- and Ted was also happy to report that the long positions of the Big 4 traders in silver is now lower than it was before their arrival, which was another bullish surprise.
On top of that, the commercial traders of whatever stripe have set three tiny and consecutive new intraday lows in silver since the Tuesday cut-off, so we're back to being wildly bullish in silver from a COMEX futures market perspective.
![]()
In gold, the commercial net short position fell by 19,281 COMEX contracts, or 1.928 million troy ounces. They arrived at that number by reducing their long position by 3,720 contracts, but also reduced their short position by 23,011 contracts -- and it's the difference between those two numbers that represents their change for the reporting week.
Under the hood in the Disaggregated COT Report, it was all Managed Money traders, plus a bit more, as they reduced their net long position by 21,403 COMEX contracts. The Other Reportables also decreased their net long position, them by a rather paltry 536 contracts. And, like in silver, the Nonreportable/small traders increased their net long position to make things balance out, as they increased their net long position by 2,648 contracts.
Doing the math: 21,403 plus 536 minus 2,648 equals 19,281 COMEX contracts...the change in the commercial net short position.
The commercial net short position in gold now sits at 167,554 COMEX contracts, or 16.756 million troy ounces of the stuff...down those 19,281 contracts from the 186,845 contracts/18.685 million troy ounces they were short in the August 4 COT Report.
The Big 4 shorts decreased their net short position from 158,617 contracts, down to 151,426 COMEX contracts...a drop of 7,191 contracts...the same amount it fell in the prior COT Report.
The Big '5 through 8' shorts actually increased their net short position from the 56,241 contracts they held short in the August 4 COT Report, up to 57,748 contracts held short in the current COT Report...an increase of a smallish 1,507 COMEX contracts. This is the second week in a row that they've increased their short position in gold...although only by a small amount both times. Up until then they'd been whittling away at it. But like last week on their first increase, I'm not reading anything into it, at least for the moment.
The Big 8 shorts in total decreased their net short position from 214,858 COMEX contracts, down to 209,174 contracts...a decrease of 5,684 COMEX contracts...[7,191 minus 1,507]. This is their lowest short position since March 21...but still high on an historical basis, especially compared to early last fall.
Ted's raptors, the small commercial traders other than the Big 8, were buyers for the third week in a row -- and they were big buyers, as they increased their long position from 28,013 COMEX contracts...up to 41,620 COMEX contracts...an increase of 13,607 contracts.
So, like in silver, it was Ted's raptors buying of long positions that the Managed Money traders were puking up, that accounted for most of the decrease in the commercial net short position in gold.
But don't forget that despite their small size, they are great in number. These raptors in gold are still commercial traders in the commercial category -- and in direct competition with the Big 4/8 shorts.
Here's Nick Laird's 3-year COT Report chart for gold, updated with the above data. Click to enlarge.
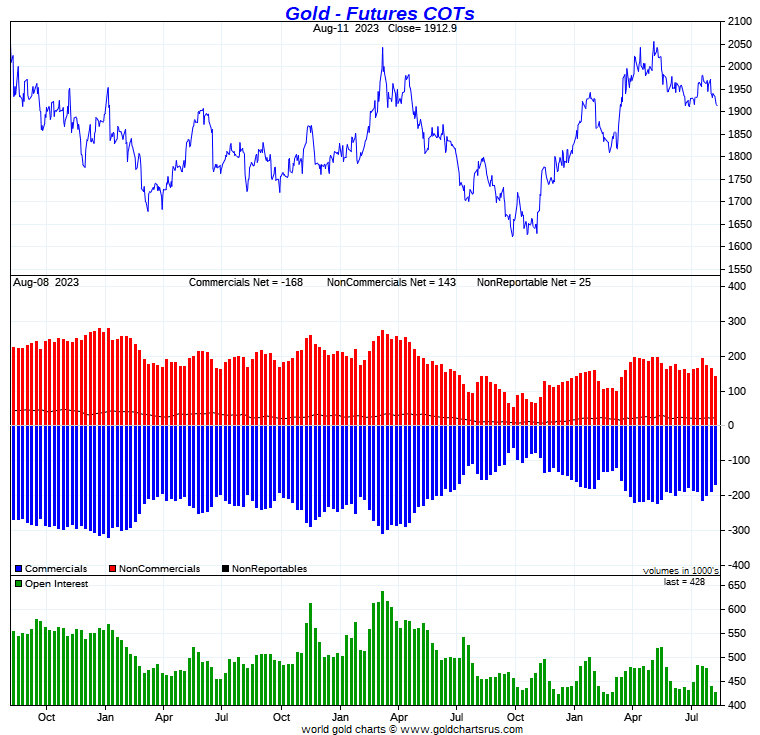
The Big 4 and Big 8 short positions in gold are the lowest they've been since mid-to-late March. But, having said that, from a COMEX futures market perspective, the set up in gold still remains somewhat bearish -- and has been that way for many month, compared to their absolute lows of early last fall.
However, since the Tuesday cut-off, the commercial traders have engineered gold back below its 50-day moving average and, like in silver, have been quietly setting new intraday lows since.
So whether or not we've seen the lows for this move down in gold and the other three precious metals, is unknown. It's still in the hands of the commercial traders of whatever stripe...principally the Big 4 shorts as always.
![]()
In the other metals, the Managed Money traders in palladium increased their net short by a further 862 COMEX contracts. They are now net short palladium by a very hefty 9,711 contracts...47+ percent of total open interest. The commercial traders are very net long palladium in both categories...especially the Swap Dealers. All the other categories are net short.
In platinum, the Managed Money traders decreased their net long position by a whopping 11,717 COMEX contracts -- and are now back to being net short platinum by 8,434 contracts. The Producer/Merchant category is the only other category net short platinum at the moment -- and they are mega net short to the tune of 21,198 contracts -- and are mostly U.S. bullion banks as per last Friday's Bank Participation Report. The rest of the categories are net long by very decent amounts.
In copper, the Managed Money traders decreased their net long position by an eye-watering 24,962 contracts -- and are now back to being net short copper by 5,179 COMEX contracts...about 129 million pounds of the stuff as of the August 11 COT Report...down big from the 448 million pounds they were net long in last week's report. They are even more short since the Tuesday cut-off.
Copper, like platinum, continues to be a wildly bifurcated market in the commercial category. The Producer/Merchant category is net short 36,388 contracts...which is down big from the 62,813 contracts they were short in the August 4 COT Report -- and the Swap Dealers are net long 41,296 COMEX contracts.
Whether that mean anything or not, will only be known in the fullness of time. Ted says it doesn't mean anything as far as he's concerned, as they're all commercial traders in the commercial category.
In this vital industrial commodity, the world's banks...both U.S. and foreign...are net long 9.5 percent of the total open interest in copper in the COMEX futures market in the August Bank Participation Report, which came out last Friday...down from the 10.7 percent they were net long in July's. At the moment it's the commodity trading houses such as Glencore and Trafigura et al., along with some hedge funds, that are mega net short copper in the Producer/Merchant category, as the Swap Dealers are mega net long, as I pointed out above.
![]()
Here’s Nick Laird’s “Days to Cover” chart, updated with the COT data for positions held at the close of COMEX trading on Tuesday, August 8. It shows the days of world production that it would take to cover the short positions of the Big 4 — and Big '5 through 8' traders in every physically traded commodity on the COMEX. Click to enlarge.
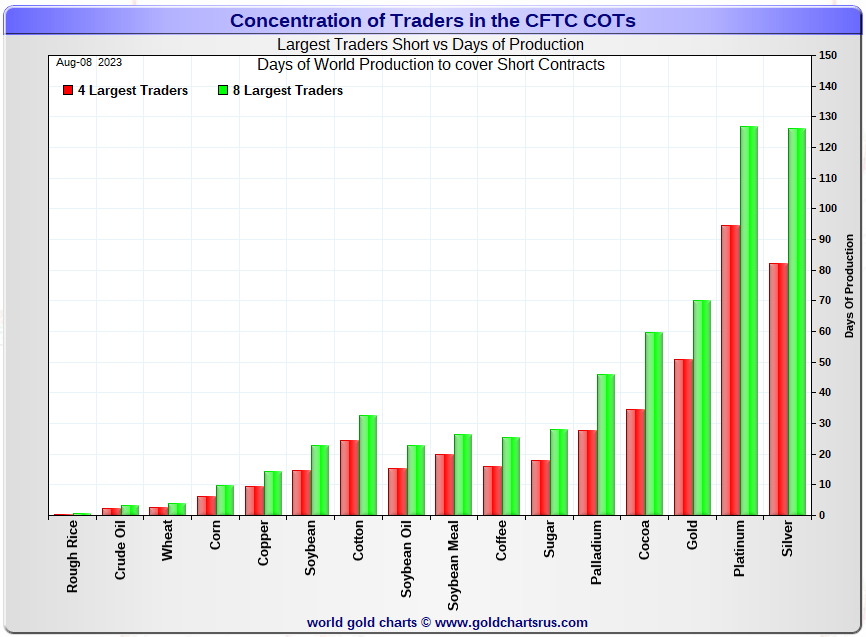
It should be noted on the chart above -- and for the first time that I can remember, the short position of the Big 4 and 8 traders in silver, is smaller than the Big 4 and 8 shorts in platinum. It's only 1 day for the Big 8 -- and 12 days for the Big 4 shorts...but it's very noteworthy. These two precious metals are the the No. 1 and 2 problem children for the bullion banks -- and in the case of platinum...only the U.S. bullion banks.
In this week's data, the Big 4 traders are short about 82 days of world silver production, down a whopping 10 days from the August 4 COT Report. The ‘5 through 8’ large traders are short an additional 44 days of world silver production, also down 10 days from the August 4 COT Report, for a total of about 126 days that the Big 8 are short -- and obviously down an eye-watering 20 days from last week.
Those 126 days that the Big 8 traders are short, represents a bit over 4 months of world silver production, or 271.13 million troy ounces/54,226 COMEX contracts of paper silver held short by these eight traders. Several of the largest of these are now non-banking entities, as per Ted's discovery in last December's Bank Participation Report. Last week's Bank Participation Report confirms that this is still the case -- and not just in silver, either.
But this Big 8 commercial short position is still contaminated by the one Managed Money trader that is still embedded in it, so these numbers are overstated by around 5,000 COMEX contracts/25 million troy ounces...give or take a few million.
Because of that Managed Money trader now in the Big 8 category, the long position of Ted raptors, the small commercial traders other than the Big 8, cannot be calculated accurately...as mentioned further up. However, it's somewhere around 95 million troy ounces/8,700 contracts...net of that Managed Money trader...give or take a million ounces or so -- and up about 50 million troy ounces from last week.
In gold, the Big 4 are short 51 days of world gold production, down 2 days from the August 4 COT Report. The '5 through 8' are short 19 days of world production, unchanged from the August 4 COT Report...for a total of 70 days of world gold production held short by the Big 8 -- and obviously down 2 days from last week's COT Report.
The Big 8 commercial traders are short 39.4 percent of the entire open interest in silver in the COMEX futures market as of yesterday's COT Report, down from the 43.5 percent that they were short in the August 4 COT Report. And once whatever market-neutral spread trades they have on are subtracted out, that percentage would be around the 45 percent mark. In gold, it's 48.9 percent of the total COMEX open interest that the Big 8 are short, exactly unchanged from the 48.9 percent they were short in the August 4 COT Report -- and around the 55 percent mark once their market-neutral spread trades are subtracted out.
And as also mentioned earlier, Ted is still of the opinion that Bank of America is short about one billion ounces of silver in the OTC market, courtesy of JPMorgan & Friends. He's also of the opinion that they're now short 37 million troy ounces of gold, as of the March OCC Report...with the same bunch of JPMorgan & Friends crooks on the long side. That up 12 million ounces from the 25 million that they were short in the December OCC Report.
And as you already, know the short position in SLV rose from 22.83 million shares, up to 27.10 million shares in the August 9 short report. The next short report is due out on Thursday, August 24.
The situation regarding the Big 4/8 concentrated commercial short positions in silver and gold are still obscene...although vastly improved over the last three weeks -- and has improved a bit more since Tuesday's cut-off.
As Ted has been pointing out ad nauseam forever, the resolution of the Big 4/8 short positions will be the sole determinant of precious metal prices going forward -- which should be obvious to everyone by now... except the willfully blind as always.
I have about an average number of stories, articles and videos for you today ...including several that I've been saving for today's column for length or content reasons.
![]()
CRITICAL READS
Wholesale prices rose 0.3% in July, higher than expected
A measure of wholesale prices rose more than expected in July, countering recent trends showing that inflation pressures are easing.
The producer price index, which gauges the costs that goods and services producers receive for their products as opposed to those that consumers pay, rose 0.3% for the month, the Bureau of Labor Statistics reported Friday. That was the biggest monthly gain since January and up from a unchanged reading in June.
Excluding food and energy, core PPI also increased 0.3%, the biggest monthly increase since November 2022 after falling 0.1% in June. Core PPI rose 2.4% on a 12-month basis, tied for the lowest since January 2021.
Economists surveyed by Dow Jones had been expecting an increase of 0.2% for both readings. Excluding food, energy and trade services, PPI increased 0.2%.
On a year-over-year basis, headline PPI was up just 0.8%. Prices excluding food, energy and trade services moved up by 2.7% on an annual basis, unchanged from June.
Another number that was massaged to perfection, I'm sure, dear reader. This news item appeared on the cnbc.com Internet site at 8:35 a.m. EDT on Friday morning -- and comes to us courtesy of Swedish reader Patrik Ekdahl. Another link to it is here. The Zero Hedge spin on this is headlined "Producer Prices Rose More Than Expected in July; Money Management Fees Soar" -- and linked here.
![]()
Junctures and New Cycles -- Doug Noland
In what would have been a good week for bonds turned into an uncomfortably lousy one. Ten-year Treasury yields rose another five bps Friday, pushing the week’s gain to 12 bps (to 4.15%). Ten-year yields are again knocking on the door of the 4.24% spike high from last October. Things are looking even rougher in mortgage land. Benchmark MBS’s 11 bps Friday jump boosted the week’s yield gain to a notable 23 bps. MBS yields traded above 6% intraday Friday (closed at 5.97%), again within striking distance of the 6.10% October high.
The market’s impulse to sell the good CPI news is not confounding. The Pollyanna “immaculate disinflation” case gets tougher going forward. Energy prices have bounced back, with the Ukraine war and inhospitable climate elevating food price risks. But mainly, some prices that spiked (i.e., used cars and airline tickets) have come off the boil. Now the focus will shift to more structural issues. For one, ongoing tight labor markets virtually ensure strong wage growth and second-round inflationary pressures.
Meanwhile, Crisis Dynamics have gained momentum in China. Country Garden – the former largest and “model developer” – now has a “penny stock” that traded Friday at an all-time low. The company missed a $25 million bond payment due Monday, which starts the clock ticking on a 30-day grace period before official default. Bond yields (2025) that were at 17% in February – after beginning 2022 below 7% - spiked Friday to a record 187% (trading at seven cents on the dollar). With an apology, the company announced a larger-than-expected $7.6 billion first-half loss – followed soon by a three-notch Moody’s downgrade to Caa1.
To better appreciate unfolding China risks, it’s important to recognize the Ponzi Finance elements to the Chinese housing market. Buyers of new apartments typically must provide large down payments prior to the start of construction – funds often used to complete previously sold units. The Evergrande default sent shock-waves through housing markets, with project delays/cancelations leading to widespread public outrage and protests. Potential buyers have backed away from the more troubled developers and the entire group of private developers, more generally, choosing instead to purchase from public and quasi-public builders.
Country Garden’s July sales were down 60% from July 2022 (75% from July 2021). This week’s news will have a further chilling effect on company sales and housing sentiment. So far, apartment price deflation has been relatively moderate compared to the scope of deteriorating fundamentals. Country Garden and other private developers will increasingly resort to aggressive discounting to drive sales. Analysts expect Country Garden to make bond payments over the next month to avoid imminent default. But absent a Beijing bailout, prospects for recovery appear dim.
Some might ponder why Beijing doesn’t just bite the bullet and commit to a $1 TN developer bailout. Perhaps it’s because they confront a much bigger festering crisis, with $13 TN of local government debt spread across hundreds of entities – some accounted for, but much of the hidden variety.
Like the scores of stimulus measures announced over recent months, this week’s plan to transfer $139 billion of LGFV debts to the books of provincial governments is understandably viewed in the markets as a drop in the bucket.
It’s interesting to contemplate the massive $600 billion response to the “great financial crisis.” With China’s banking system having inflated to $60 TN, even a 10-fold increase of 2009 stimulus would today provide little more than a jug of water in the bucket.
Data suggest a destabilizing Chinese Credit slowdown could now be unfolding. August Credit growth was abysmal. The $48 billion increase in Bank Loans was the weakest since November 2009. Aggregate Financing rose $73 billion, the smallest increase in data back to 2017.
Market focus has shifted from Fed policy to more fundamental concerns, including persistent inflation and endless supply. It has all the makings of a paradigm shift after three decades, when inflation and supply could essentially be disregarded. And it goes without saying: the previous bond market paradigm had a momentous effect on equities valuations and global asset prices generally...the world grew so accustomed to indiscriminately inflating the quantity of financial claims year after year – with central banks ensuring ever increasing financial asset market values.
It was never going to be sustainable. The world is in the process of rapid and momentous change, and these changes are not constructive for financial assets. Perhaps the bond market is signaling a new paradigm, an unfolding New Cycle and long-overdue revaluation.
Doug's weekly commentary is always a must read for me -- and this week's version showed up on his website sometime after 1 a.m. PDT on Saturday morning. Another link to it is here.
![]()
Beware the great unwind -- Alasdair Macleod
This chart strongly suggests that U.S. Treasury bond yields, widely regarded as the risk-free yardstick against which all other credit is measured are going significantly higher, not stabilising close to current levels before going lower as commonly believed. I conclude that U.S. Treasury bond yields could easily double, and the political class will be powerless to stop them going even higher. The implications for interest rates globally are that they will be forced considerably higher as well.
This article concludes that reasoned analysis takes us to this inevitable conclusion. It is consistent with the end of the post Bretton Woods fiat currency era, and the return to credit backed by real values.
The collapse of un-backed credit’s value was only a matter of time, which is now rapidly approaching. The Great Unwind is under way. It is the consequence of monetary and currency distortions which have accumulated since the end of Bretton Woods fifty-two years ago. It will not be a trivial matter.
The trigger will be capital flows leaving the dollar, creating a funding crisis for the U.S. Government. Foreigners, who have accumulated $32 trillion in deposits and other dollar-denominated financial assets will no longer need to maintain dollar balances to the same extent, perhaps even paring them back to a minimum. Furthermore, economic factors are turning sharply negative with energy prices rising ahead of the Northern Hemisphere winter, springing debt traps on western alliance governments. So how could bond yields possibly decline materially in the coming months?
This chart-filled short novel from Alasdair was posted on the goldmoney.com Internet site on Wednesday -- and for length reasons it had to wait for today's column. I found it embedded in a GATA dispatch -- and another link to it is here.
![]()
Pentagon alarm bells, primates on the loose, foreign policy quagmires and plenty more...
Inflation in the U.S. is picking up slightly. El Pais reports:
Inflation in the United States edged up in July after 12 straight months of declines. But excluding volatile food and energy costs, so-called core inflation matched the smallest monthly rise in nearly two years,…
We believe the financial world – or at least that part of it that is in the U.S. – is in a confusing transition period. The Primary Trend, we think, is down. Ultimately, stocks and bonds are going down…in real terms.
But that trend is going to take time. And it’s often going to feel like riding a bucking steer. It’s going to be hard to stay on top of it. While most central banks are raising rates to bring monetary inflation under control (deflationary), most central governments are running big deficits…increasing demand (inflationary) while actually lowering the output of desirable goods and services. The feds use our money for boondoggles, not for productive investment, making us all poorer.
Primate Warns Biden
One of the biggest rat holes of all is in the news today – foreign policy. Niger has just had a coup d'état staged by disgruntled military men. The former president is said to be locked in his home…and starving. The new Junta says it will kill him if the U.S. intervenes.
As you know, no sparrow can fall anywhere in the world without setting off alarm bells in the Pentagon…hatching subversive plots in the CIA…and raising mansion prices in Northern Virginia, home of America’s ‘defense’ industry.
Niger is now eager to head off a U.S. attack.
This interesting commentary from Bill showed up on his website on Friday morning EDT -- and I thank Roy Stephens for sending it along. Another link to it is here. Gregory Mannarino's post market close rant for yesterday is linked here -- and this one lasts for about 15 minutes.
![]()
Niger: The Liberation from “Independence” -- Peter Koenig
Abas La France! Vive le Niger!
Down with France, Down with ECOWAS, Down with the European Union!
Thousands of people demonstrate in the streets of Niamey, the capital of Niger. They do not want an ECOWAS intervention. ECOWAS stands for Economic Community of West African States. And ECOWAS stands for western influence.
On 26 July 2023, Niger’s official French-supported President, Mohamed Bazoum, was over-thrown by a military junta, led by General Abdourahamane Tiani.
ECOWAS, France, the European Union (E.U.) and other western governments may be thinking they are domineering over the sovereignty of other nations. They slammed down sanctions on Niger. Among the “sanctioning” countries was also the United States.
Reuters reported that one participant was seen carrying a sign that read
“Long live Niger, Russia, Mali, and Burkina Faso. Down with France, ECOWAS, and the E.U.” “We are demonstrating [against] all the countries of ECOWAS and all who are taking inhumane and unpopular measures toward Niger.”
The creation of ECOWAS in 1975 via the Treaty of Lagos was prompted by Europe and the U.S., to keep a closer grip on the 15 resources-rich member countries. The official reason was free trade and economic integration. ECOWAS members include, Benin, Burkina Faso, Cabo Verde, Côte d’Ivoire, The Gambia, Ghana, Guinea, Guinea Bissau, Liberia, Mali, Niger, Nigeria, Senegal, Sierra Leone, and Togo.
A little anecdote. When U.S. President Biden threatened to withhold U.S. aid to Niger due to the military coup, the Niger military leader said,
“...they should keep their aid money and give it to their millions of homeless people in the U.S. Charity begins at home.”
This clear vision can only be congratulated.
This longish commentary from the globalresearch.ca Internet site arrived in my in-box on Tuesday -- and for obvious reasons had to wait for today's column. Another link to it is here. Two days before that, I received a related story from reader John Coombs headlined "Coup d'état in Niger: Africa on verge of new war with deep geopolitical effects" -- and it's linked here.
![]()
Colonel Douglas Macgregor : "Russia is more powerful than ever , we are out of weapons"
This 45-minute wide-ranging audio/video interview interview was posted on the youtube.com Internet site back on 01 August 2023 -- and I thank Roy Stephens for sharing it with us. It's definitely worth your while if you have the interest. Another link to it is here.
![]()
Poland, Turkey and Czechia bought gold in July, IMF data shows
Central banks continued to bolster their reserves with gold purchases in July, according to the latest International Financial Statistics data released by the International Monetary Fund (IMF).
Krishan Gopaul, senior analyst for the World Gold Council, highlighted three central banks’ purchases of precious metals in a series of Twitter posts published Wednesday and Thursday.
“Central Bank of Turkey data shows that its gold reserves rose by 17 tonnes in July, adding to the 11 tonnes bought in June when it resumed net buying after heavy net selling between March-May,” Gopaul said. “YTD net sales now total 85 tonnes, with total gold reserves at 457 tonnes.”
He said the Czech National Bank also added 2 tonnes to its gold reserves in July, bringing their year-to-date net buying total to nearly 10 tonnes, which represents almost half of their 21 tonnes of total holdings.
But the biggest purchaser highlighted in the IMF data was the National Bank of Poland, which increased its gold reserves by 22 tonnes last month. “This brings year-to-date net purchases to 71 tonnes, and lifts total gold reserves to 299 tonnes,” Gopaul said.
On Monday, Gopaul shared that China bought 23 tonnes of gold in July, and noted that China has purchased 126 tonnes of gold to date in 2023, increasing its official reserves to 2,136 tonnes.
This worthwhile gold-related news item put in an appearance on the kitco.com Internet site on Thursday -- and I found it on Sharps Pixley. Another link to it is here.
![]()
The Photos and the Funnies
Continuing northwest down B.C. Highway 8 on May 20, we went 'off road' a bit -- and onto the long-abandoned Kettle Valley Railway right-of-way that snakes the length of the Nicola River Valley. There's a big black iron railroad bridge visible from the highway which we'd both wanted to see close up, so off we went down this dirt path of very dubious quality. The first photo is looking down the right-of-way, now a dirt trail of sorts -- and towards the bridge...the second at the bridge -- and the third looking back towards the car. Note the rust-coloured trees in the background of the last photo. These, plus a lot more you can't see, were casualties of one of the major forest fires that ripped through this area in the summer of 2021 -- and several months before the ravaging flood of mid-November of that same year. Click to enlarge.


![]()
The WRAP
"Understand this. Things are now in motion that cannot be undone." -- Gandalf the White
![]()
Today's pop 'blast from the past' is all-Canadian -- and is celebrating its 50th anniversary this year. I remember spinning this 45 rpm record on CHAR radio at Alert, N.W.T. way back then when I was 24 years young. It finished at No. 53 on Billboard's Hot 100 -- and the link is here. And here's Canada's own Contstantine Isslamow laying down the bass cover to this -- and that's linked here.
Today's classical 'blast from the past' is Beethoven's violin concerto in D major, Op. 61...his only violin concerto. Its first performance by Franz Clement was unsuccessful -- and for some decades the work languished in obscurity, until revived in 1844 by the then 12-year-old violinist Joseph Joachim with the orchestra of the London Philharmonic Society conducted by Felix Mendelssohn. Joachim would later claim it to be the "greatest" German violin concerto. Since then it has become one of the best-known and regularly performed violin concertos.
On my list of favourite violin concertos, it's first amongst equals.
Here's the legendary Itzhak Perlman at the top of his game -- and accompanied by the Berlin Philharmonic in a live recording from 31 years ago. Daniel Barenboim conducts -- and the link is here.
![]()
Like for the CPI number on Thursday, the commercial traders were at the ready when the PPI number was rolled out at 8:30 a.m. EDT on Friday morning. The dollar index was turned higher -- and precious metal prices were tightly controlled.
This was especially true of gold and silver, as the former was only allowed a small gain on the day in the spot market, but was actually closed lower in the December contract...its current front month. At its intraday low, which was set in the first hour of GLOBEX trading in New York on Thursday evening, 'da boyz' set another new low for this move down.
Silver was closed down 2 cents in the spot market...but down 8 cents in September, its current front month. At its 8:55 a.m. EDT spike low tick yesterday, another slight now low for this series of engineered price declines was set for it as well.
Platinum's price spike at 2 p.m. CEST in Zurich/8 a.m. in New York yesterday was capped instantly -- and it was sold down hard into the 10 a.m. EDT afternoon gold fix in London -- and heaven only knows what its closing price would have been if that not-for-profit seller hadn't appeared at that juncture.
It was even more flagrant in palladium, as its continuing short-covering rally was ravaged starting minutes before 9 a.m. in COMEX trading in New York and, as I mentioned at the top of today's column, was closed 44 bucks off its Kitco-recorded high tick. This is in-your-face price management, as no 'for profit' seller ever trades like this...ever!
The commercial traders continue to work the copper price lower, as they closed it down another 5 cents at $3.72/pound...trading as low as $3.69 intraday. It's now a dime below any moving average that matters -- and 29 cents off its Kitco-recorded $4.01 high tick of 31 July.
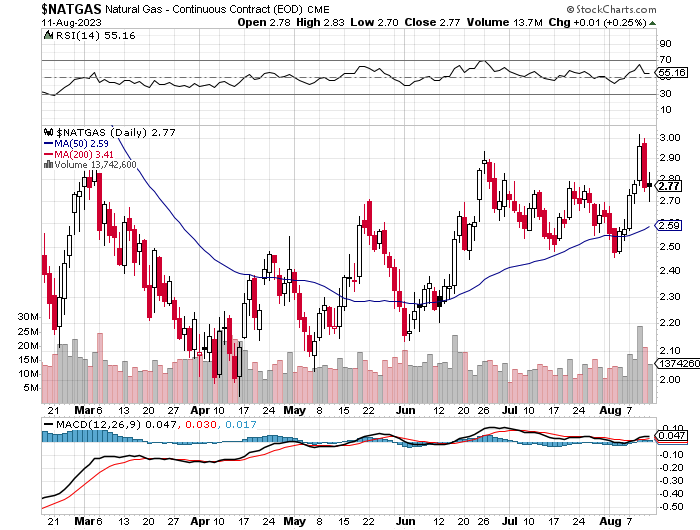
And after its big price swings of Wednesday and Thursday, natural gas [chart included] finished the day up a penny at $2.77/1,000 cubic feet. It traded in a 13 cent price range on Friday.
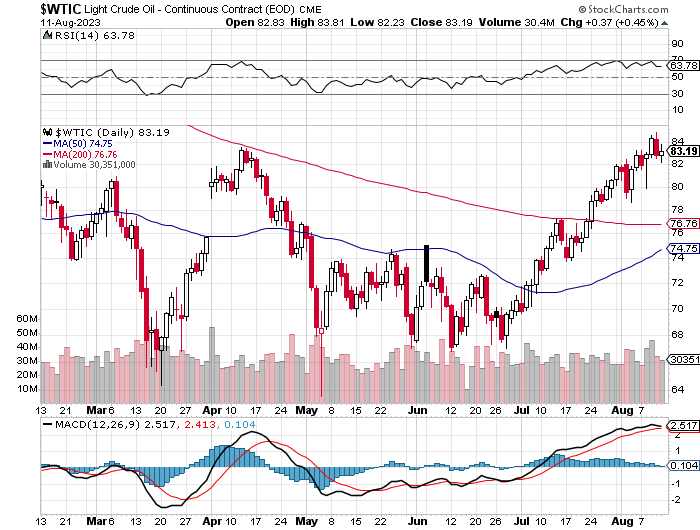
WTIC closed higher by 37 cents at $83.19/barrel...erasing part of Thursday's big decline in the process. It has been bouncing off the overbought mark on its RSI trace for the last few weeks now. It wouldn't surprise me if there was a 'correction' at some point before it moves higher anew.
Here are the 6-month charts for the Big 6+1 commodities, thanks to stockcharts.com as usual and, if interested, their closing prices in their current front months on Friday should be noted. Click to enlarge.

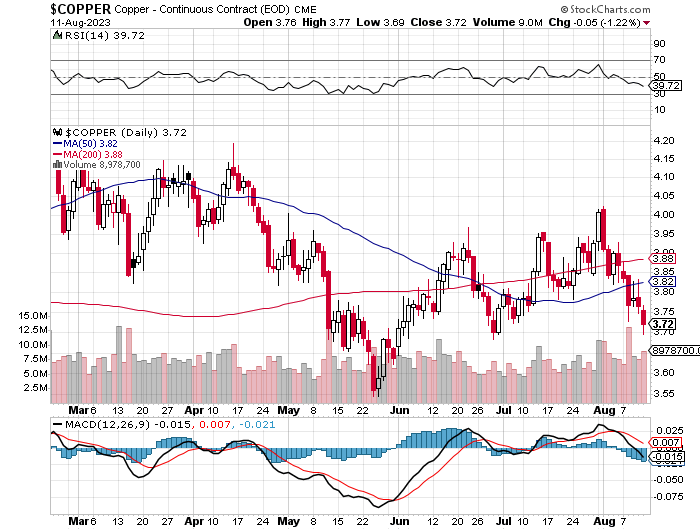
So...are we done the downside yet?
If we're not there...we're close -- and that's especially true since the Tuesday cut-off, as the commercial traders of whatever stripe have been slicing the price salamis in gold, silver, platinum and copper since then.
All four are currently trading below important moving averages...gold below its 50-day -- and silver, platinum and copper below any moving average that matters. Only palladium got away from 'da boyz' on Thursday and Friday.
From a Managed Money perspective the only precious metal they're net long in, is gold -- and by a lot. To get them market neutral or short would require Herculean effort on behalf of the commercial traders -- and the price bottom required to do that would be a very long way below yesterday's close.
Since the Tuesday cut-off, 'da boyz' have closed gold below its 50-day moving average, plus took two more small sliced off its price since. Can they do more, or are they even going to try? Who knows. It doesn't seem likely but, as Ted continually points out, one must never underestimate their treachery.
In silver, the Managed Money traders are now net short this precious metal as of yesterday's COT Report, which took me by surprise -- and because of the price salami-slicing since the Tuesday cut-off, are most likely even more short now.
And like in silver, the Managed Money traders are now net short platinum and copper as of the Tuesday cut-off as well -- and with respect to copper, are now even more short since then. The bullion banks of the world are not the main drivers of the copper price, as they are hugely net long...especially the U.S. banks.
Platinum has rallied a bit since the Tuesday cut-off, but I doubt it was enough to put them net long again -- and it's still a very decent distance below any moving average that matters. But I will point out once more that five U.S. bullion banks have a very ugly short position in this precious metal.
As for palladium, its big rally on Thursday, along with its capped rally on Friday, will make no difference whatsoever, as the Managed Money traders in it are mega net short this precious metal -- and that's despite the fact that the palladium price is back above its 50-day moving average by a bit. Don't forget that world's bullion banks have little interest in driving palladium lower in price, as they're all net long this precious metal, like they are in copper -- and have been so for some time.
As Ted pointed out on the phone yesterday, it appears that the commercial traders have carefully crafted the current price bottoms in all these metals... precious, or otherwise -- and we'll find out soon enough if they've done all they're going to do.
A hint at the future may have come from the precious metal share price action yesterday, as the gold stocks closed nicely higher despite the fact that gold was closed lower in its current front month. The same can be said of the silver price in the September contract -- and the price action in their equities was even more impressive.
So we wait some more.
I was listening to Gregory Mannarino's rant with one ear on Friday afternoon as I was working away -- and I have to agree with his assessment that the world's financial system is the "most twisted freak show in the history of the world"...with the 800 lb. gorilla being the Federal Reserve and their ilk.
There is no free-market price discovery mechanism allowed to operate in any markets...stock, bond, or commodities. It's gone from Richard Russell's "print, or die"...to "print and die" in very short order. The yield in the 10-year U.S. Treasury is back above 4.0% by a goodly margin -- and unless the Fed et al. intervene in a big way, there's going to be 'big trouble in River City' real soon.
Of course hanging over that is the upcoming BRICS+ meeting in Johannesburg that starts ten day from now -- and what will come from that remains to be seen. There certainly lots of speculation -- and I'll refrain from adding to it. However, I am toying with the idea that this bullish set-up in the precious metals and copper might be somehow related to it.
But one things is certain -- and whether it comes out of this conference or not, there will be a new international payment currency at some point, most likely backed by gold if Sergey Glazyev has his way.
The other noteworthy change coming at some point will be the Gulf States, lead by Saudi Arabia most likely, announcing that they will be accepting payment for oil in currencies other than the U.S. dollar.
I'm still waiting for China to update its official gold reserve figures, as what they currently report is pure fiction. It's been many years since they've done so -- and I'm wondering if that announcement will come at this conference.
And lastly, Russia will start adding more gold to its reserves this month -- and we won't know how much that is until Wednesday, September 20th when The Central Bank of the Russian Federation updates its website with August's data.
As I've stated before in previous Saturday missives, there are a multitude of moving pieces in Zbigniew Brzezinski's 'Grand Chessboard" in central Asia...even more now than several years ago. Monumental changes are in our future -- and as Lenin correctly pointed out "There are decades where nothing happens; and there are weeks where decades happen."
We are approaching such a point in history now...which segues nicely into that Gandalf the White quote above..."Understand this. Things are now in motion that cannot be undone." -- and they are.
And, for all the reasons stated above in today's Wrap...I'm still 'all in' -- and will remain so, to whatever end.
See you on Tuesday.
Ed
About the author

SUBSCRIBE: https://edsteergoldsilver.com/

Ed Steer’s Daily Analysis of the Gold and Silver Markets
After eight years of writing about the precious metals for Casey Research, the folks at Stansberry & Associates—who just recently purchased controlling interest in the company—decided that my ‘niche market’ column didn’t fit into their plans.
Since the time that Casey Research was kind enough to offer me a stand-alone column, it became their most highly-rated blog almost from the outset—and has remained that way up to this date...