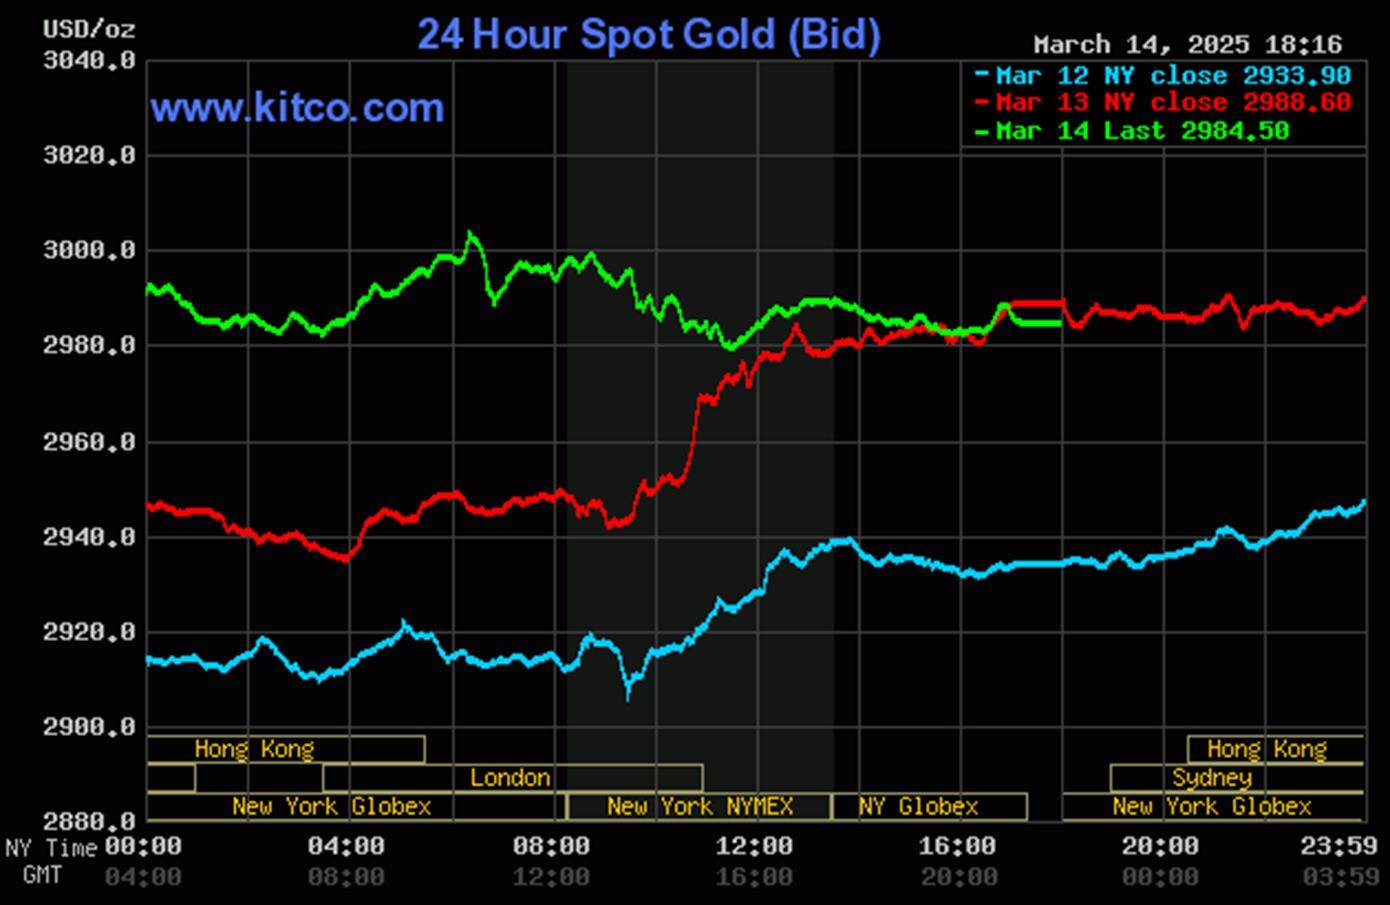
The gold price wasn't allowed to do much of anything until a quiet sell-off began around 12:20 p.m. China Standard Time in Globex trading on their Friday afternoon. That lasted until around 3:25 p.m. CST -- and its ensuing rally was capped and turned lower by 'da boyz' shortly after it broke above $3,000 spot at the 10:30 a.m. morning gold fix in London. They sold it quietly lower from that point until around 11:20 a.m. in COMEX trading in New York -- and it then had a quiet and slightly ascending up/down move that ended at 4:30 p.m. EDT. It began to head higher from that juncture, but the short sellers of last resort showed up fifteen minutes later and took care of business.
The high and low ticks in gold were reported as $3,017.10 and $2,988.60 in the April contract... and intraday move of $28.50 an ounce. The April/June price spread differential in gold at the close in New York yesterday was $27.80...June/August was $25.10...August/October was $24.00 -- and October/December was $23.40 an ounce.
Gold was closed in New York on Friday afternoon at $2,984.50 spot...down $4.10 on the day -- $9.40 off its Kitco-recorded high tick. Net volume was on the quieter side at a bit over 146,500 contracts -- and there were a bit over 36,500 contracts worth of roll-over/switch volume out of April and into future months...mostly June, but with noticeable amounts into August and December as well.
I saw that 1,800 gold, plus 191 silver contracts were traded in March yesterday -- and I look forward to what that translates into in tonight's Daily Delivery and Preliminary Reports.
![]()
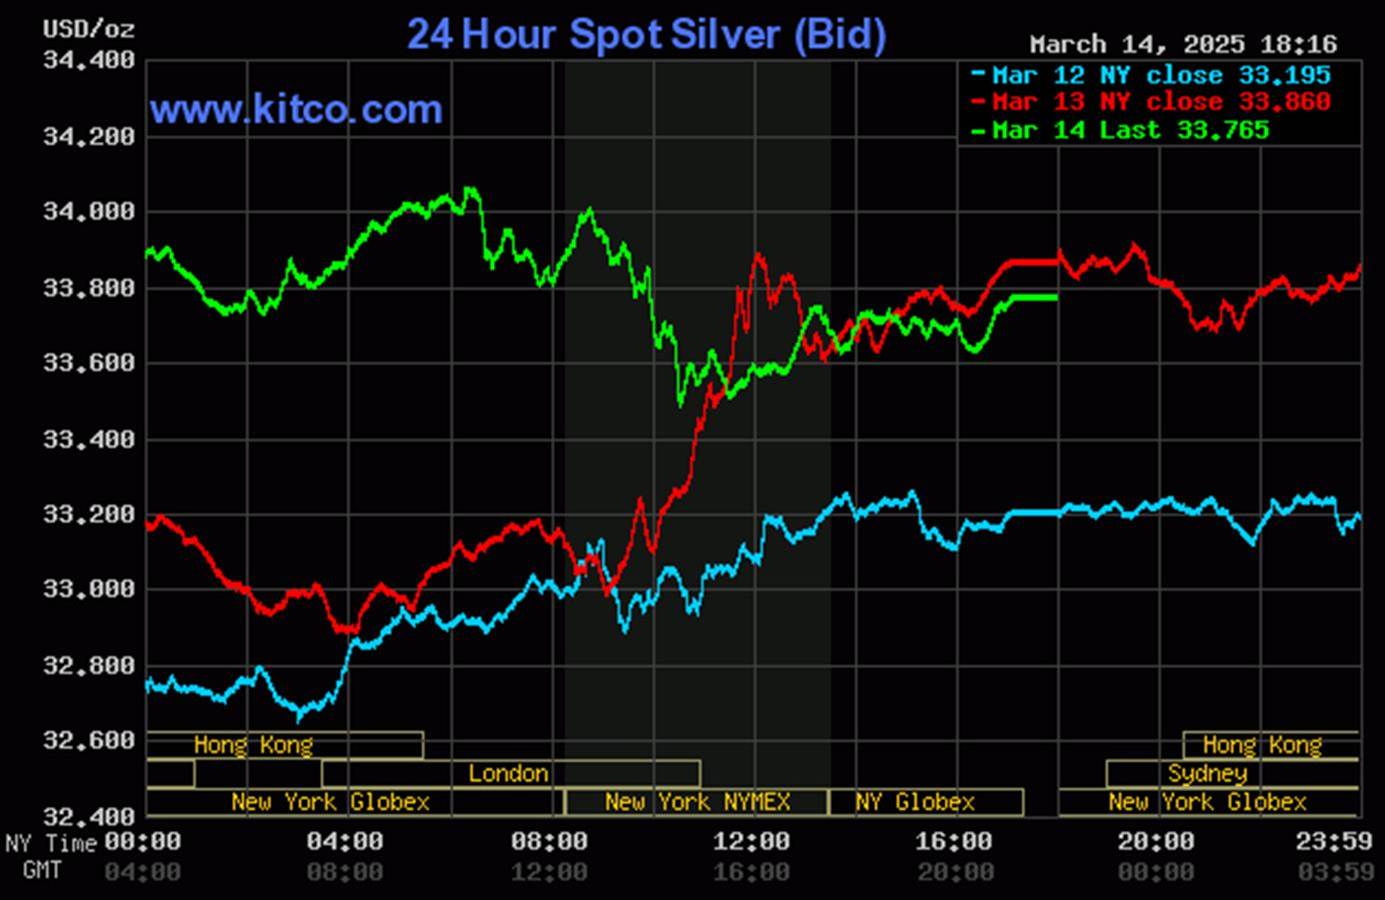
The silver price had a down/up/down move that started around 7:30 p.m. in Globex trading in New York on Thursday evening -- and ended at the 2:15 p.m. afternoon gold fix in Shanghai. Its ensuing rally that took it above $34 spot, was also capped and turned lower at or just before the 10:30 a.m. morning gold fix in London. 'Da boyz' set its low tick at precisely 10:30 a.m. in COMEX trading in New York...with its ensuing rally getting capped around 1:05 p.m. EDT. It was sold a tad lower from that point until 4:10 p.m. -- and then rallied a bit until the market closed at 5:00 p.m. EDT.
The high and low ticks in silver were reported by the CME Group as $34.86 and $34.14 in the May contract...an intraday move of 72 cents. The March/ May price spread differentials in silver at the close in New York was 24.6 cents ...May/July was 29.7 cents...July/September was 27.4 cents -- and September /December was 38.3 cents an ounce.
Silver was closed in New York on Friday afternoon at $33.765 spot...down 9.5 cents from Thursday -- and 31.5 cents off its Kitco-recorded high tick. Net volume was nothing special at 55,500 contracts -- and there were around 4,800 contracts worth of roll-over/switch volume in this precious metal... mostly into July and September.
![]()
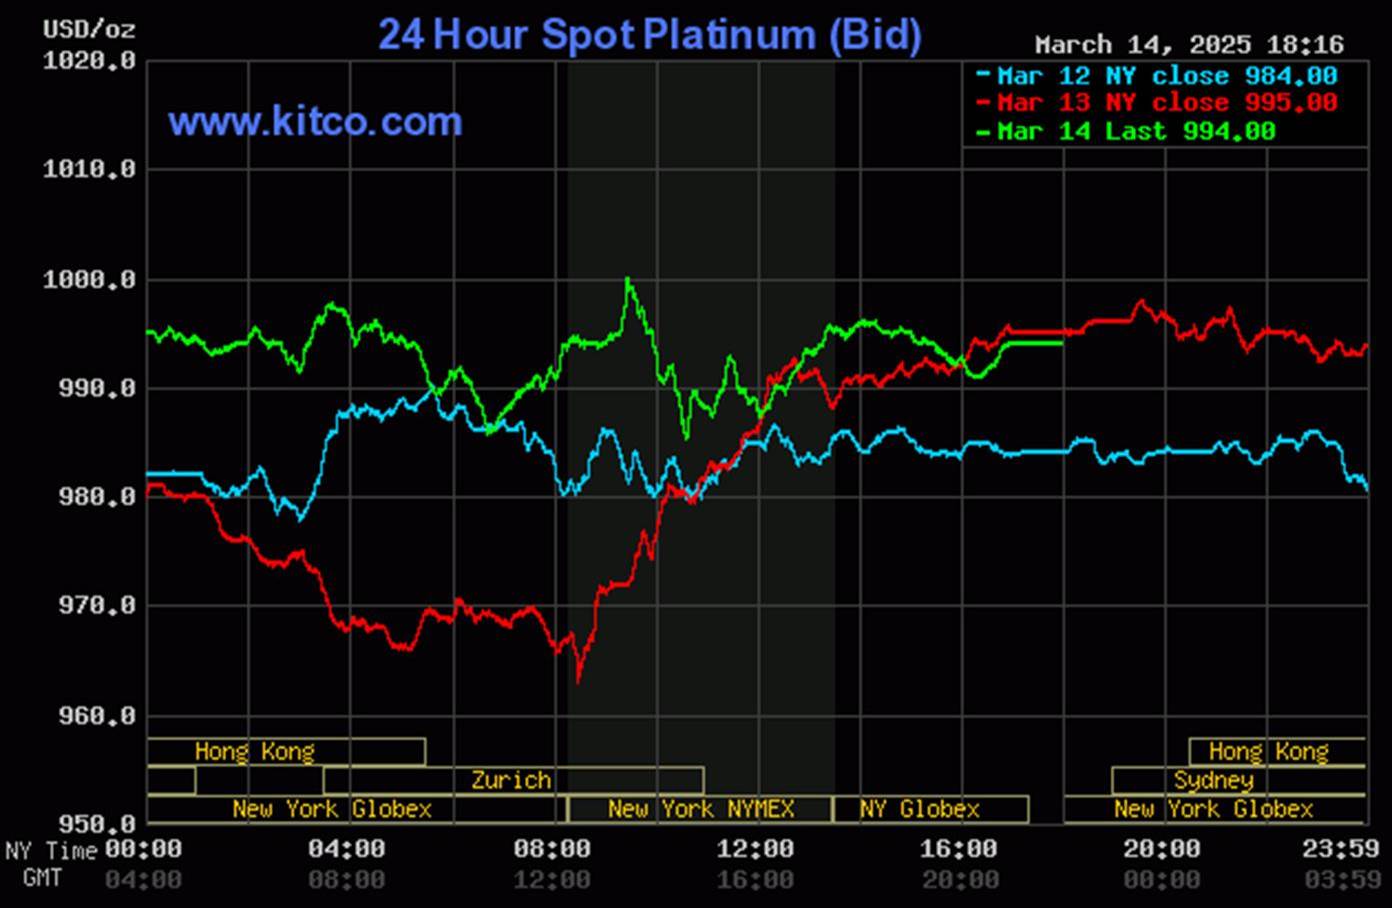
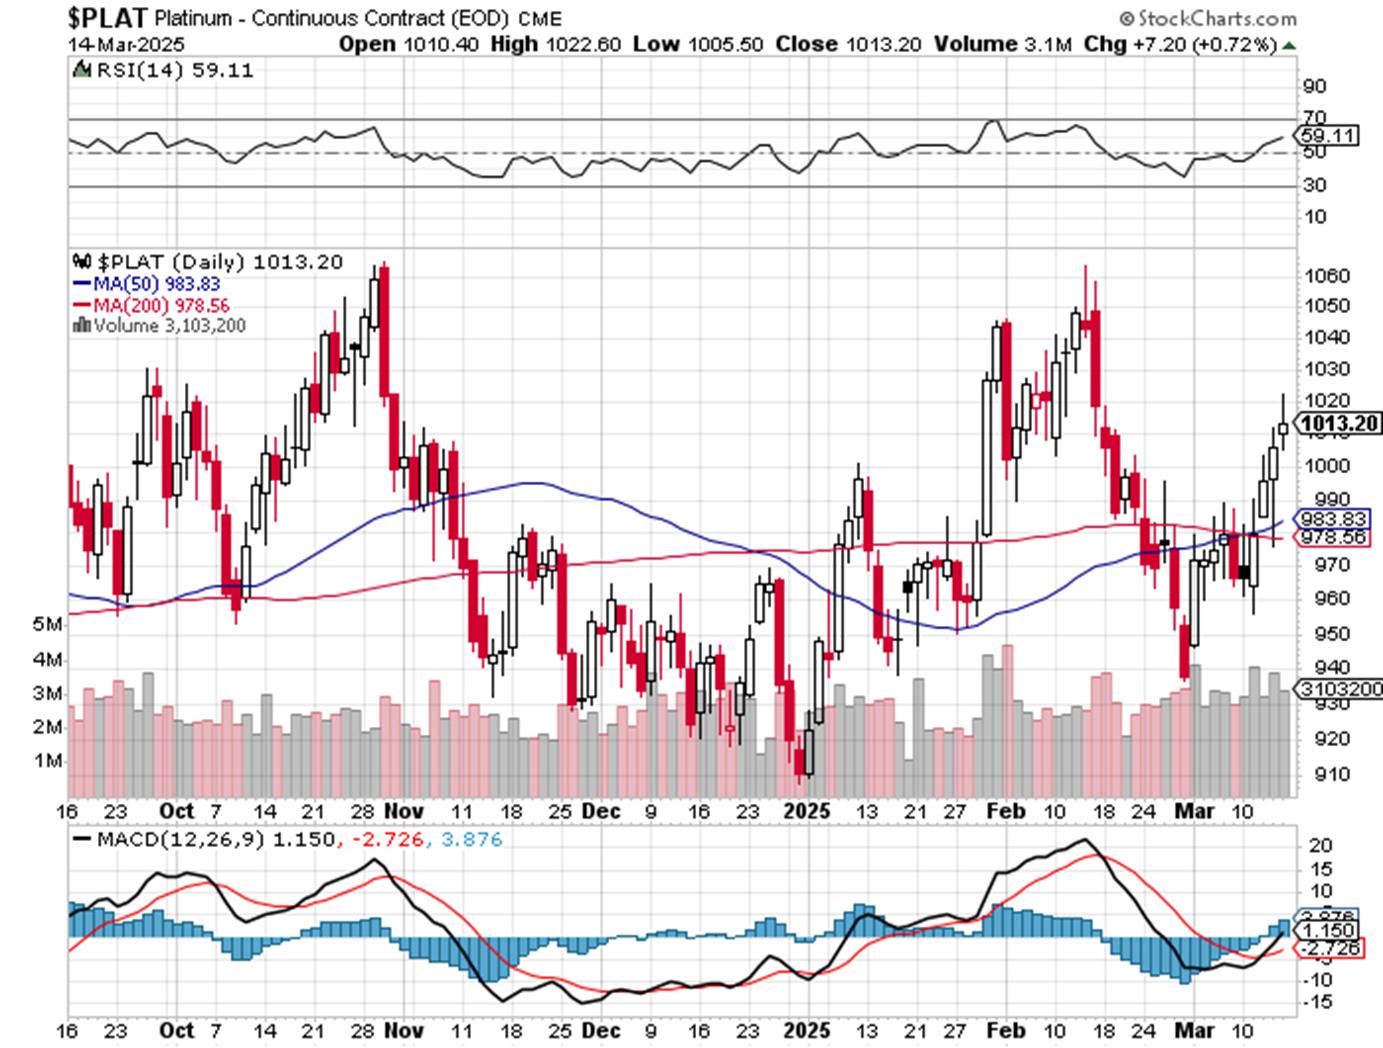
Platinum was sold quietly and broadly lower until around 10:45 a.m. CET in Zurich in Globex trading on their Friday morning -- and its ensuing rally ran into 'something' around 9:20 a.m. in COMEX trading in New York. It was engineered lower until around 10:40 a.m. EDT -- and then had an ascending up/down move that lasted until around 4:30 p.m. in after-hours trading. It then edged a bit higher until trading ended. Platinum was closed at $994 spot...down a dollar on the day -- and 6 bucks off its Kitco-recorded high tick.
![]()
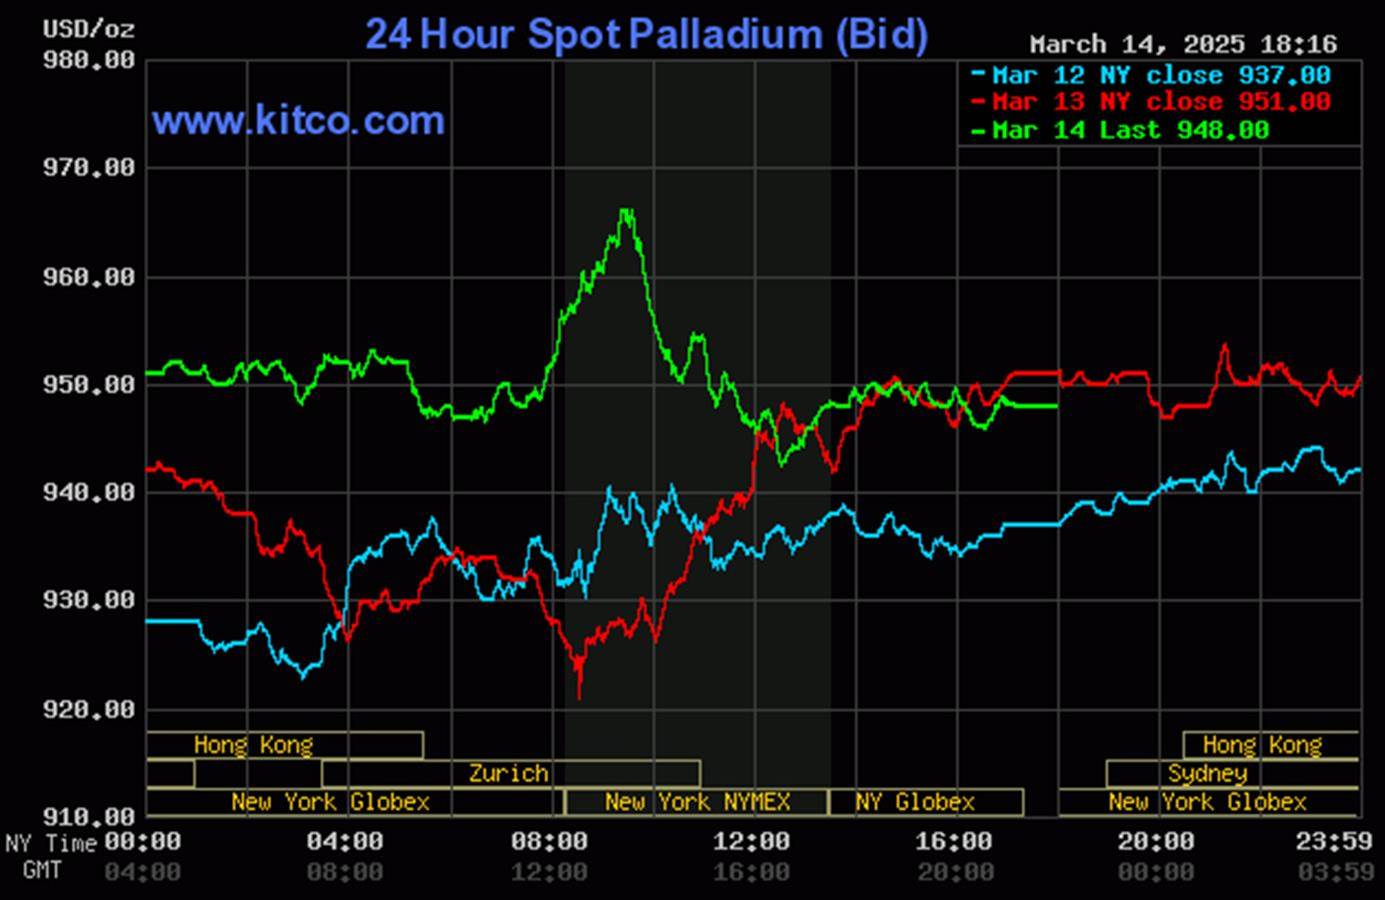
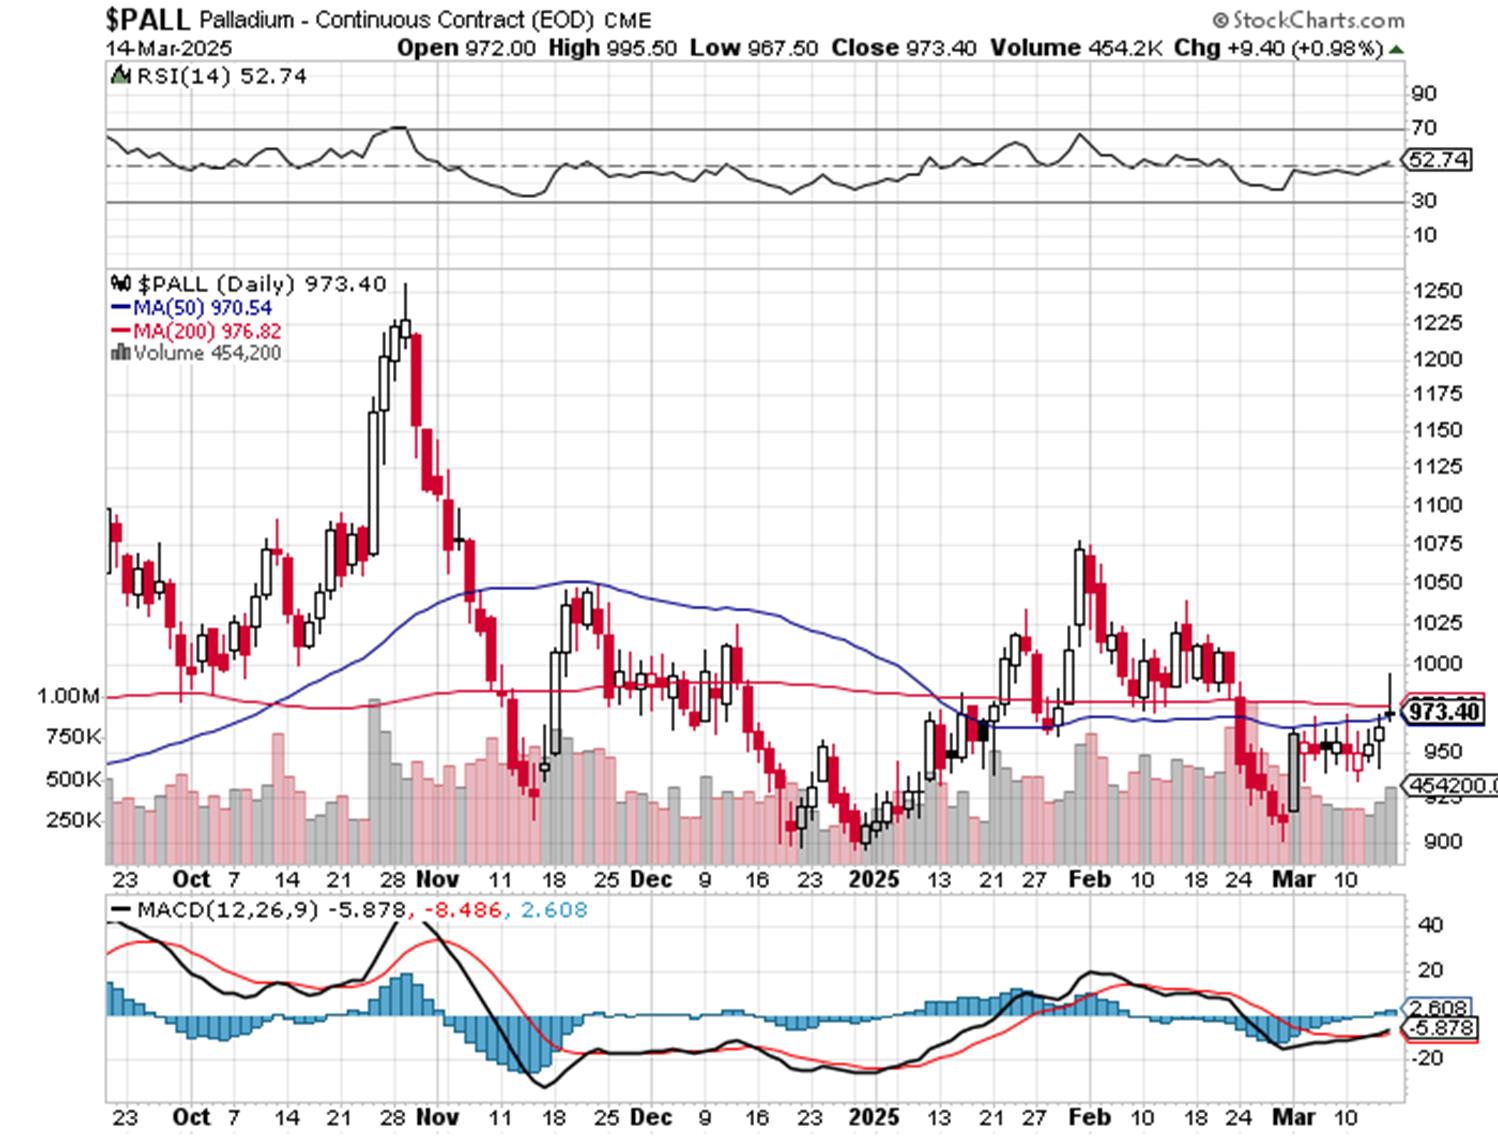
Palladium wandered/chopped very quietly sideways until a rally of some substance erupted minutes before 1 p.m. CET in Zurich. Like for platinum, that ran into 'something' at 9:20 a.m. in COMEX trading in New York -- and was sold lower until 12:40 p.m. EDT. It rallied a few dollars until the 1:30 p.m. COMEX close -- and didn't do much after that. Palladium was closed at $948 spot...down 3 bucks from Thursday -- and 19 dollars off its Kitco-recorded high tick.
Based on the kitco.com spot closing prices in silver and gold posted above, the gold/silver ratio worked out to 88.4 to 1 on Friday...compared to 88.3 to 1 on Thursday.
Here's the 1-year Gold/Silver Ratio Chart...courtesy of Nick Laird. Click to enlarge.

![]()
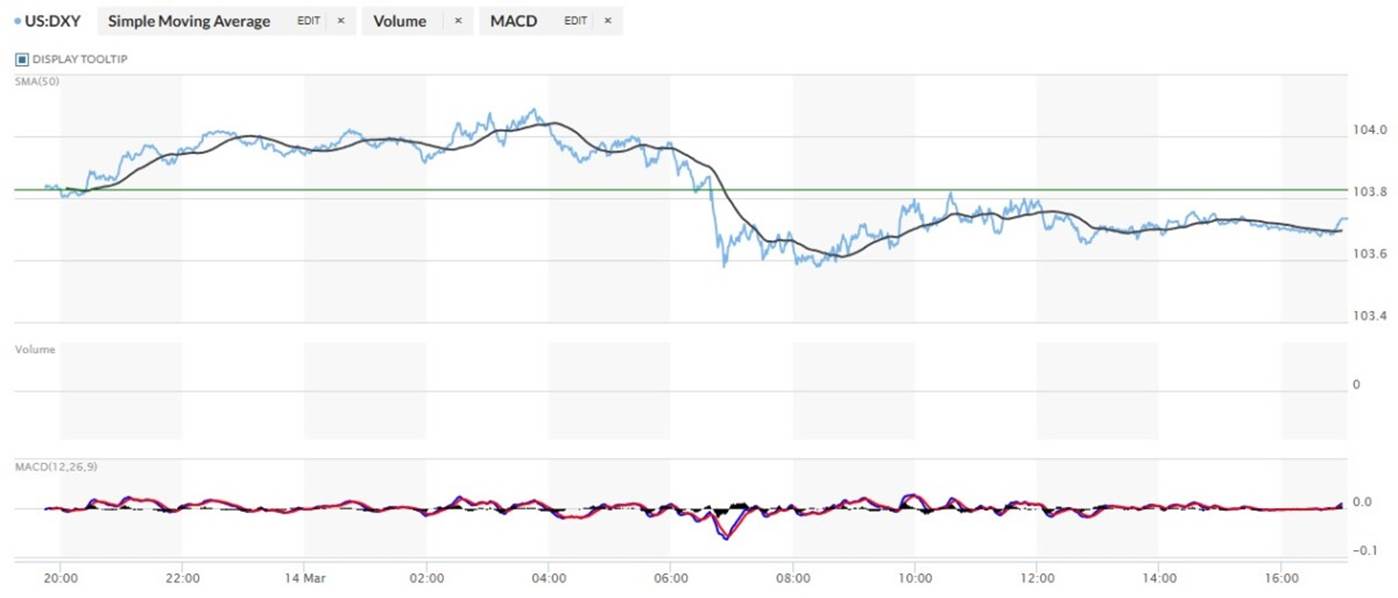
The dollar index finished the Thursday trading session in New York at 103.83 -- and then opened higher by 1 basis point once trading commenced at 7:45 p.m. EDT on Thursday evening ...which was 7:45 a.m. China Standard Time on their Friday morning. It then wandered/stair-stepped its way broadly and a bit higher from there until around 3:45 p.m. CST...its high tick of the day. It then began to head lower at an ever-increasing rate until around 10:52 a.m. in London -- and after a quiet up/down move, began to chop quietly higher starting minutes after the COMEX open in New York. That lasted until 10:35 a.m. EDT -- and it then proceeded to wander very quietly and broadly lower until the market closed at 5:00 p.m.
The dollar index finished the Friday trading session in New York at 103.72...down 11 basis points from Thursday.
Here's the DXY chart for Friday...thanks to marketwatch.com as usual. Click to enlarge.
![]()
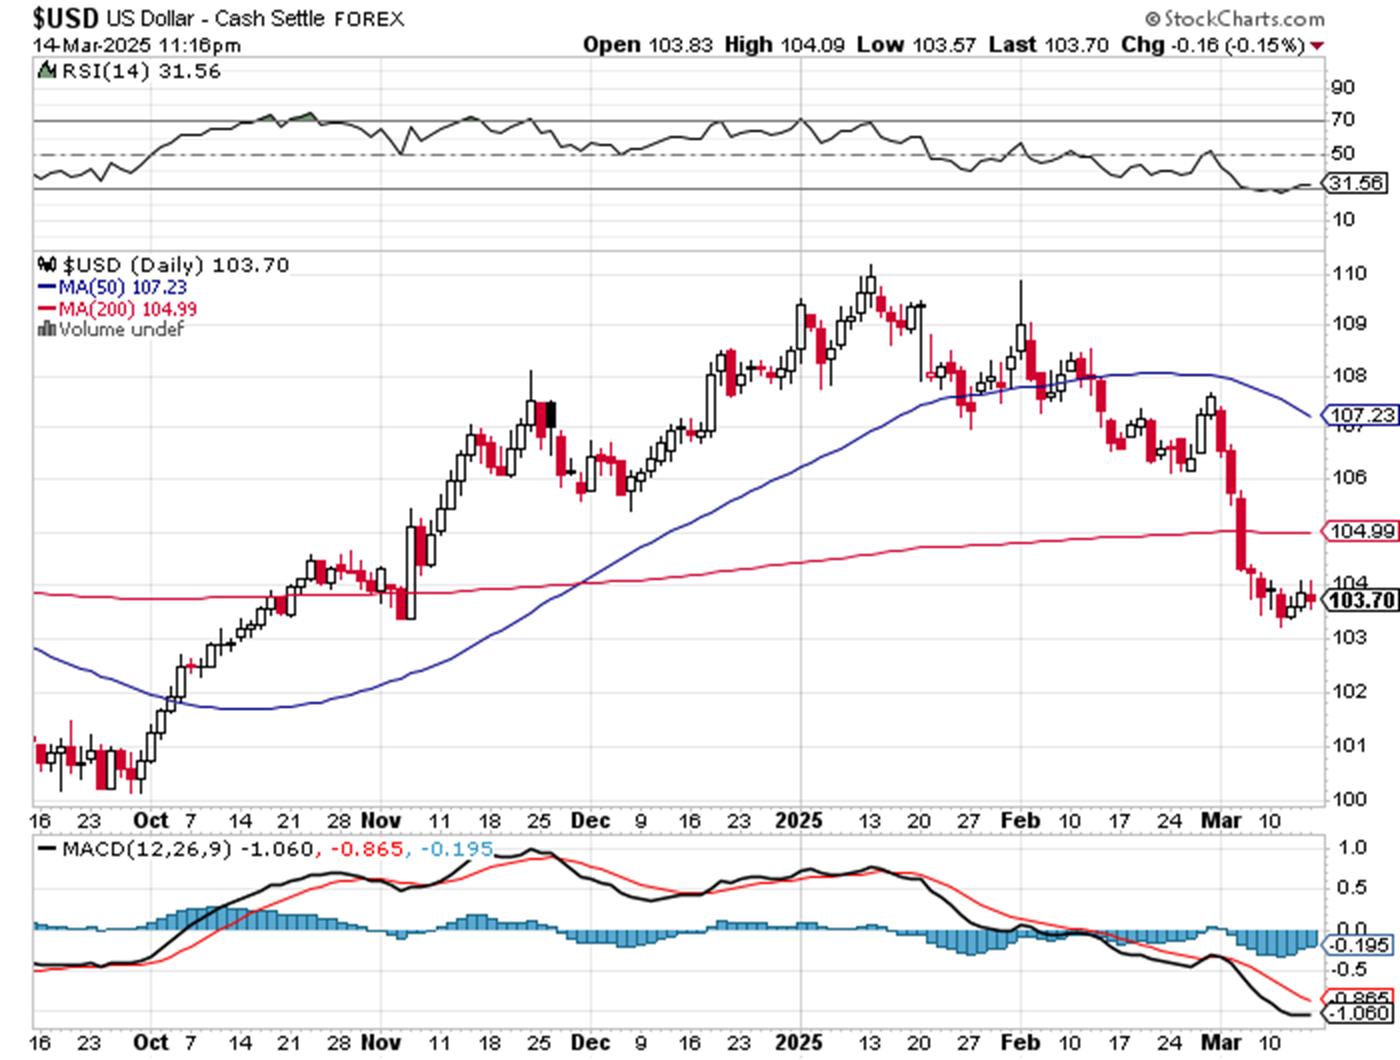
Here's the 6-month U.S. dollar index chart...courtesy of stockcharts.com as always. The delta between its close...103.70...and the close on DXY chart above, was 2 basis points below that. Click to enlarge.
![]()
The machinations in the dollar index had no effect on precious metal prices yesterday, as it was only what the collusive commercial traders were up to that mattered -- and was most obvious.
U.S. 10-year Treasury: 4.3080%...+0.0340/(+0.7955%)...as of the 1:59:52 p.m. CDT close
The ten-year closed down 0.09 basis points on the week.
Here's the 5-year 10-year U.S. Treasury chart from the yahoo.com Internet site -- which puts the yield curve into a somewhat longer-term perspective. Click to enlarge.

As I continue to point out in this spot every week, the 10-year hasn't been allowed to trade above its 4.92% high tick set back on October 15, 2023 -- and it's more than obvious from the above chart that it will he held at something under 5% until further notice, as yield-curve control is now the order of the day.
![]()
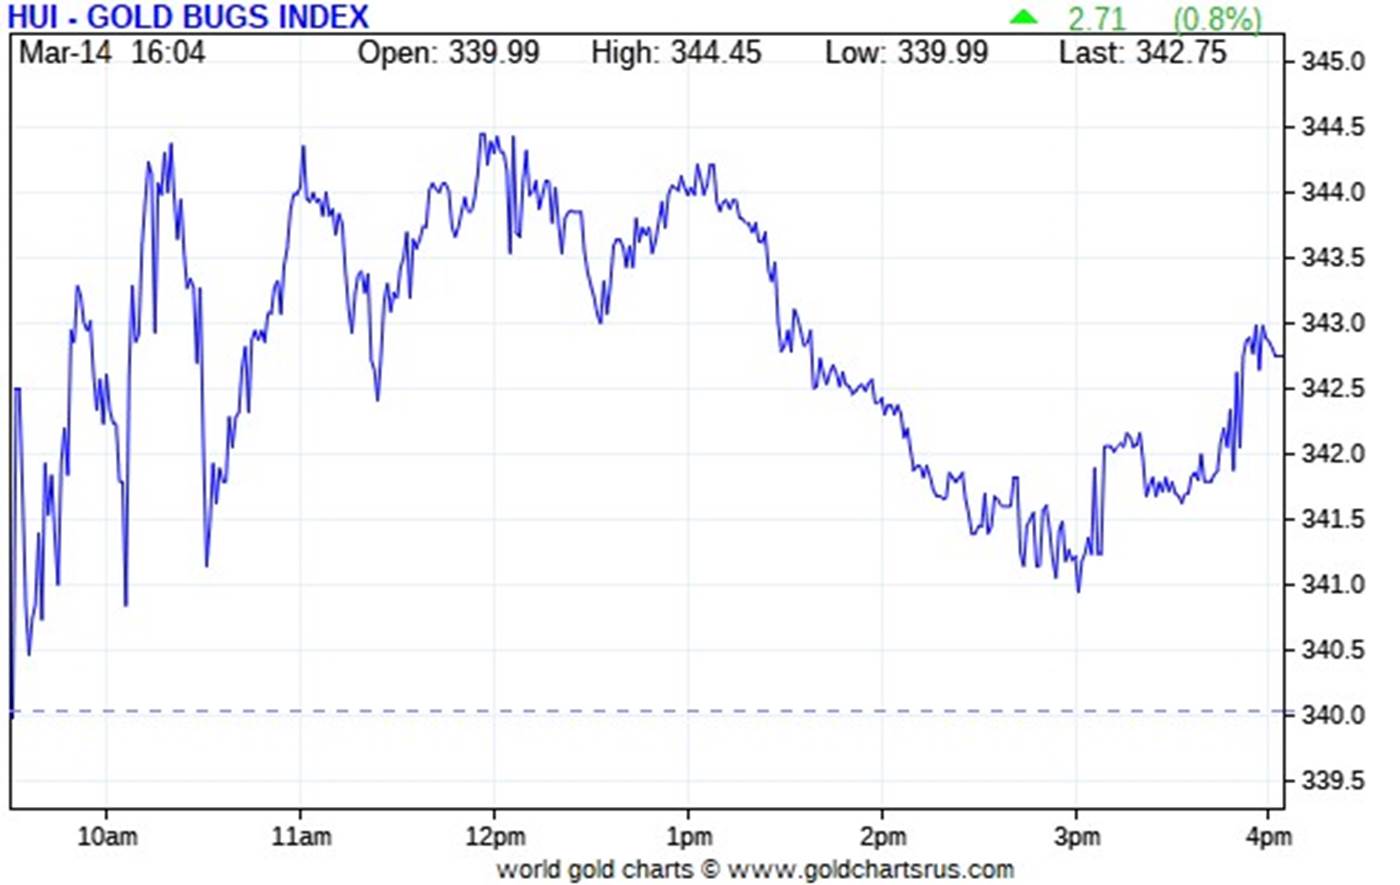
The gold shares began to chop broadly and erratically higher as soon the markets opened at 9:30 a.m. in New York on Friday morning -- and that lasted until minutes before 12 o'clock noon EDT. They were sold quietly lower from that juncture until exactly 3:00 p.m. -- and then rallied a bit until trading ended at 5:00 p.m. EDT. The HUI closed up 0.80 percent.
![]()
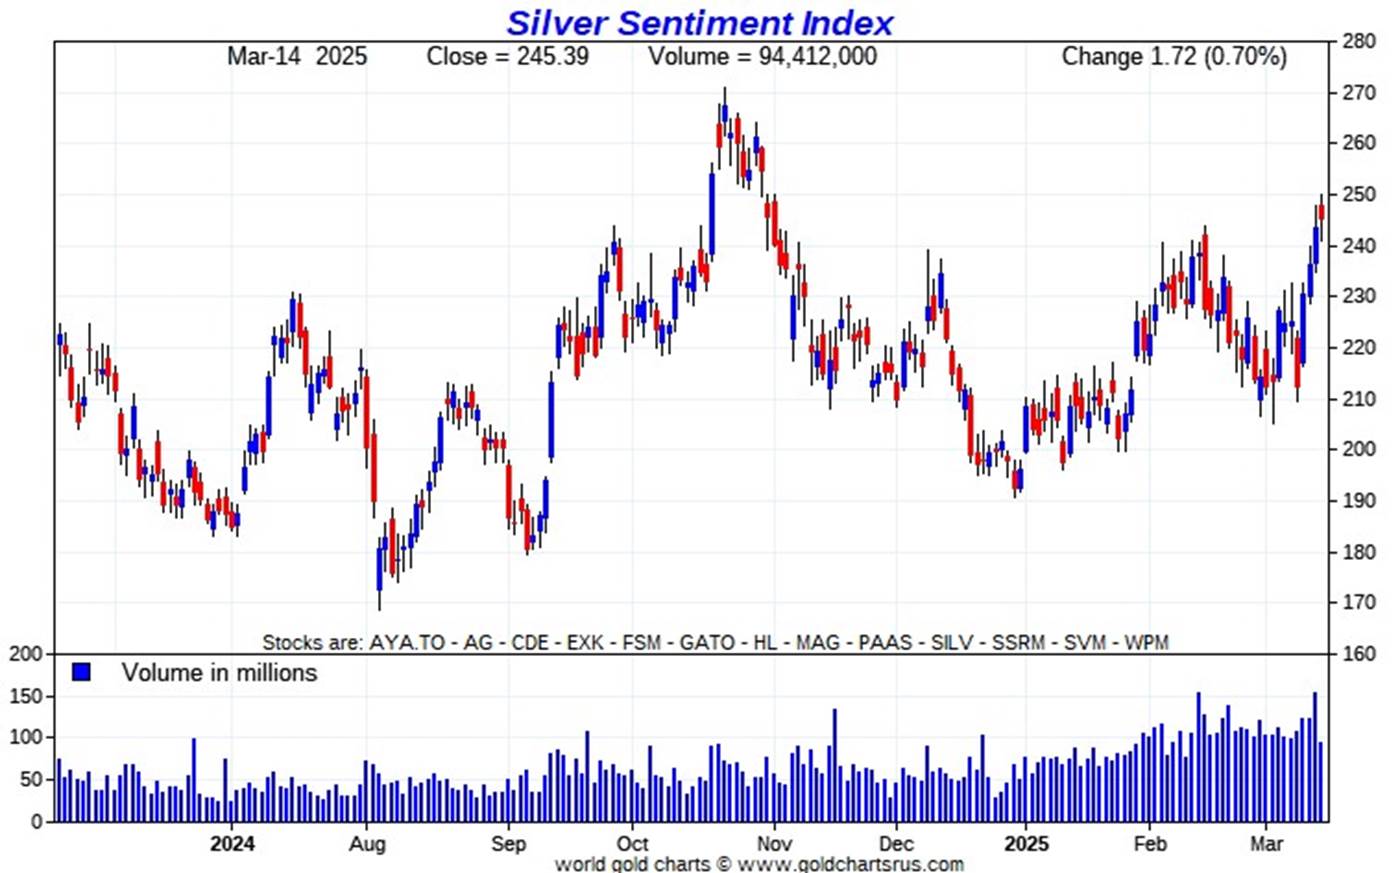
The silver equities also managed a slight positive close as well. Nick Laird's 1-year Silver Sentiment Index closed higher by 0.70 percent. Click to enlarge.
![]()
The absolute star was Fortuna Silver, closing higher by 4.43 percent on news that came out on Thursday -- and linked in yesterday's column. The biggest underperformer -- and the only one of the Silver Sentiment Index stocks that closed down on the day was Hecla Mining, as it closed lower by 0.52 percent.
I didn't see any news yesterday on any of the now [down to] eleven silver companies that comprise the above Silver Sentiment Index.
The silver price premium in Shanghai over the U.S. price on Friday was 5.81 percent.
The reddit.com/Wallstreetsilver website, now under 'new' and somewhat improved management, is linked here. The link to two other silver forums are here -- and here.
![]()
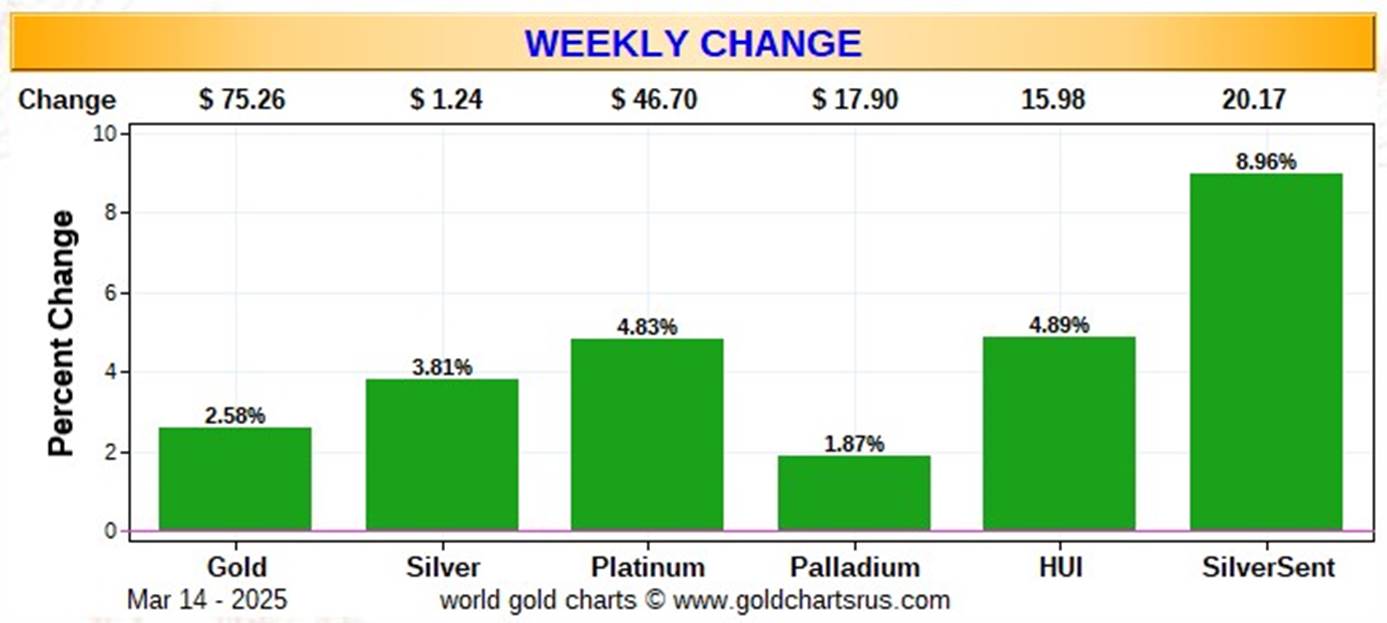
Here are the usual three charts that appear in this spot in every weekend missive. They show the changes in gold, silver, platinum and palladium in both percent and dollar and cents terms, as of their Friday closes in New York — along with the changes in the HUI and the Silver Sentiment Index.
Here's the weeklychart...and it's as green as grass across the board. The silver equities outperformed everything on both a relative and absolute basis by quite a bit -- and mainly because of the monster double-digit gains of three of the silver stocks on Tuesday. Click to enlarge.
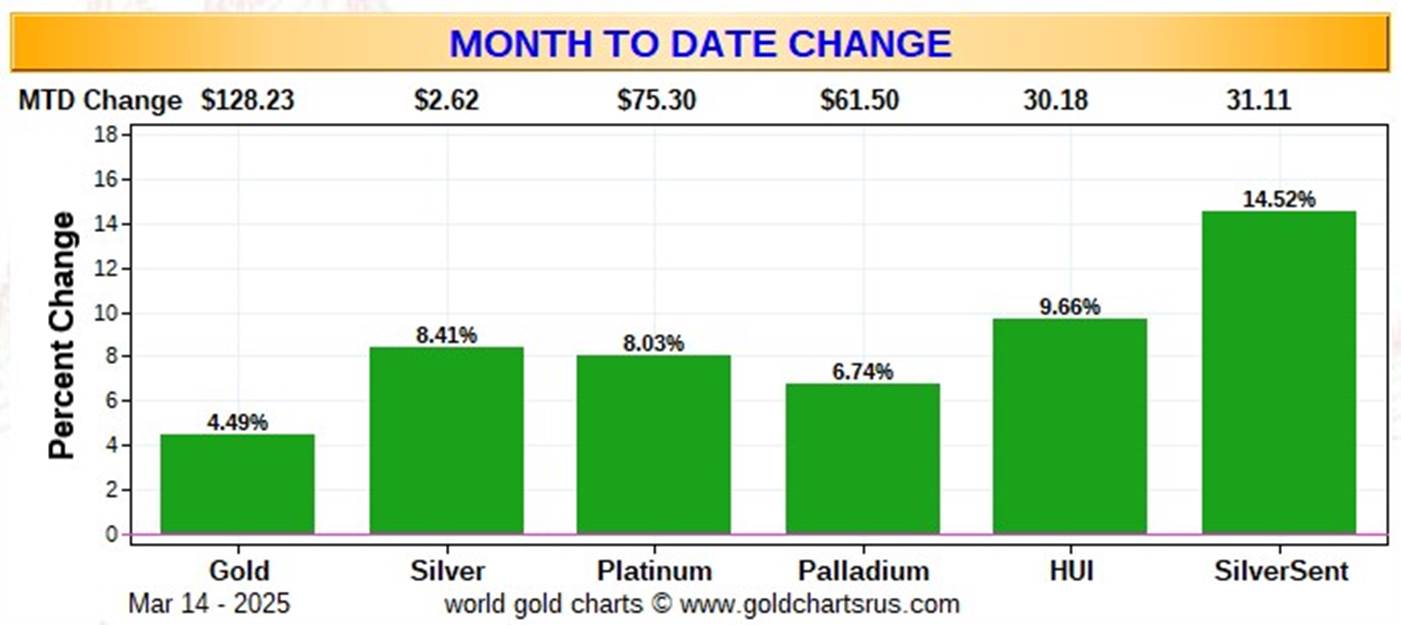
Here's the month-to-date chart. On a relative basis, the gold shares outperformed their golden cousins...but on an absolute basis, it wasn't even close. Click to enlarge.
Here's the year-to-date chart -- and it's green across the board as well... with the shares underperforming badly as usual. Everything silver-related is underperforming relative to gold, but only because of the the Big 8 commercial shorts just won't loosen their grip on it. Click to enlarge.
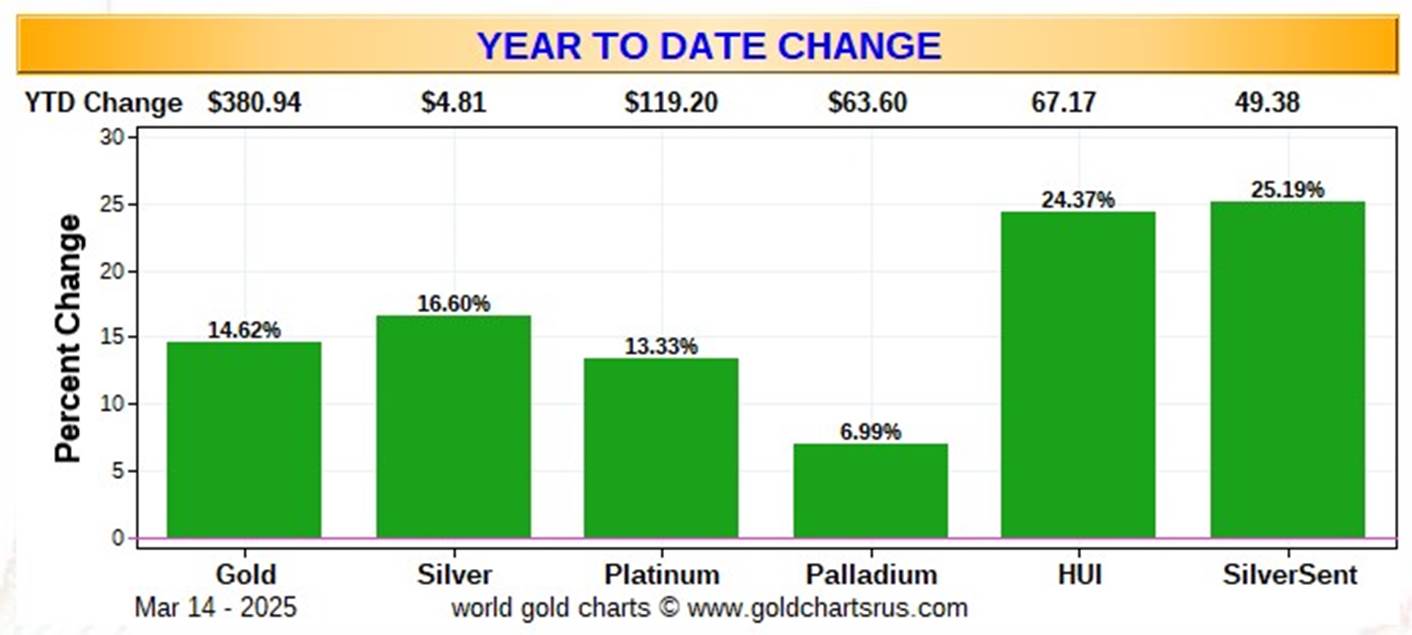
Of course -- and as I mention in this spot every Saturday -- and will continue to do so...is that if the silver price was sitting at a new all-time high of $50+ dollars an ounce, like gold is at a new all-time $3,000 high close yesterday... it's a given that the silver equities would be outperforming their golden cousins ...both on a relative and absolute basis -- and by a country mile.

The CME Daily Delivery Report for Day 12 of March deliveries showed that 964 gold -- plus 289 silver contracts were posted for delivery within the COMEX-approved depositories on Tuesday.
In gold, the three largest of the five short/issuers in total were Australia's Macquarie Futures, Canada's BMO [Bank of Montreal] Capital and British bank HSBC, issuing 333, 330 and 128 contracts respectively...BMO Capital from its house account.
There were nine long/stoppers on total -- and the three biggest there were Wells Fargo Securities, Australia's Macquarie Futures and BofA Securities, picking up 440, 215 and 169 contracts respectively -- and all for their respective house accounts.
In silver, there were six short/issuers in total -- and the four largest were Stonex Financial, JPMorgan, British bank HSBC and Canada's RBC Capital Markets...issuing 119, 60, 57 and 38 contracts -- and all from their respective client accounts. There was a big list of long/stoppers -- and the three largest were JPMorgan, Wells Fargo Securities and Australia's Macquarie Futures, picking up 96, 73 and 52 contracts respectively...JPMorgan for their client account.
The link to yesterday's Issuers and Stoppers Report is here -- and it's worth a look if you have the interest.
Month-to-date there have been 17,135 gold, plus 14,096 silver contracts issued/reissued and stopped. Those number in platinum and palladium are 365 and 95 contracts respectively.
And as I pointed out in this spot yesterday, you'd never know that it was a non-scheduled delivery month in gold looking at these numbers -- and there are still eight more delivery days left to go in March.
The Preliminary Report for the Friday trading session showed that gold open interest in March declined by 473 COMEX contracts, leaving 1,731 still open, minus the 964 contracts out for delivery mentioned a bunch of paragraphs ago in the above Daily Delivery Report. Thursday's Daily Delivery Report showed that 2,130 gold contracts were actually posted for delivery on Monday, so that means that a further 2,130-473=1,657 contracts were added to gold deliveries in March.
Silver o.i. in March fell by 77 contracts, leaving 2,075 still around...minus the 289 contracts mentioned a bunch of paragraphs ago. Thursday's Daily Delivery Report showed that 173 silver contracts were posted for delivery on Monday, so that means that 173-77=96 more silver contracts were added to the March delivery month.
Silver open interest in April increased by a further 185 contracts, leaving 2,199 still open. This number may be subject to some downward adjustment in the CME's final report later on Monday morning CDT.
Total gold open interest on Thursday rose by 6,669 COMEX contracts. Total silver o.i. also rose...it by 1,740 contracts -- and like Thursday's total open interest numbers, I wasn't at all amused [but not surprised] by either of them. It's still obvious that the collusive commercial traders of whatever stripe are going short again all new long contracts being put on...or short positions being covered.
[I checked Thursday's final total open interest numbers -- and the change from the Preliminary Report in gold showed a big downward revision, from +24,082 contracts...down to a still ugly 17,431 contracts -- and I'm hoping a bunch of that were those non-economic and market-neutral spread trades being put on. The final change in total silver o.i. showed only a bit of a decrease...from +5,677 contracts, down to +5,312 contracts.]
![]()
![]()
There was a smallish deposit into GLD on Friday, as an authorized participant added 19,271 troy ounces of gold -- and 1,711 troy ounces of gold were added to GLDM. But there was a monster deposit into SLV, as an o.i. added 4,095,333 troy ounces of silver...most likely from JPMorgan's stash.
Since that amount of silver was deposited on Friday, March 14...it made the cut-off for the next short report in SLV, which is due out on Tuesday, March 25. We'll know then if it was used to cover any of its grotesque short position.
The SLV borrow rate started the Friday session at 2.20%...and finished it at 2.27%...with 250,000 shares available. The GLD borrow rate started the day at 1.09% -- and closed at 0.95%...with 3.3 million shares available.
In other gold and silver ETFs and mutual funds on Planet Earth on Friday...net of any changes in COMEX, GLD, GLDM and SLV activity, there were a net and stunning 1,761,868 troy ounces of gold added -- and the simple reason for such a large number is that most gold ETFs and mutual funds only update their data once a week...Friday.
But a net 381,156 troy ounces of silver were removed -- and that was because of three really huge withdrawals...1,041,204 troy ounces from the Perth Mint...1,034,815 troy ounces from GoldMoney -- and 594,436 troy ounces from BullionVault.
The big sales report from U.S. Mint that I reported on yesterday was in error...as it appears that I read the wrong line item. There was no second sales report from them in March. Their month-to-date sales remain as reported last week...10,000 troy ounces of gold eagles -- 8,000 one-ounce 24K gold buffaloes -- and 509,500 silver eagles.
![]()
![]()
There was pretty decent activity in gold over at the COMEX-approved depositories on the U.S. east coast on Thursday, as 192,790 troy ounces were received -- and a hefty 320,780 troy ounces were shipped out of the exchange. One has to wonder where that was going.
In the 'in' category, the largest amount were the 160,639 troy ounces that arrived at Brink's, Inc...with the remaining 32,151.000 troy ounces/1,000 kilobars ending up at JPMorgan -- and I'm now thoroughly convinced that JPMorgan is now only dealing in kilobars in its regular gold depository.
All of the 'out' activity took place over at Brink's, Inc.
There was big paper activity -- and that happened at Brink's, Inc. as well. They transferred 160,787.151 troy ounces/5,001 kilobars from the Eligible category and into Registered...all going out for immediate delivery I'm sure.
The link to all of Thursday's big COMEX-related gold action is here.
The action in silver continued without a break on Thursday, as 2,877,607 troy ounces were received -- and nothing was shipped out.
There were four different depositories involved in the 'in' category -- and the largest two amounts were the two truckloads/1,230,877 troy ounces that arrived at JPMorgan...followed by the 724,011 troy ounces dropped off at Brink's, Inc.
In the paper category, there were 756,313 troy ounces transferred from the Eligible category and into Registered...also over at Brink's, Inc. -- and going out for immediate delivery.
The link to all of Thursday's considerable COMEX silver action is here.
There was decent activity over at the COMEX-approved gold kilobar depositories in Hong Kong on their Thursday...all of it at Brink's, Inc. as usual. There were 1,935 kilobars received -- and 25 were shipped out. The link to this, in troy ounces, is here.
The Shanghai Futures Exchange reported that a net 437,735 troy ounces of silver were removed from their inventories on Friday, which now stands at 37.944 million troy ounces.
![]()
Here are the usual 20-year charts that show up in this space in every weekend column. They show the total amounts of physical gold and silver held in all known depositories, ETFs and mutual funds as of the close of business on Friday.
During the week just past, there were a net 3.116 million troy ounces of gold added...with the lion's share being COMEX related -- plus a net 22.921 million troy ounces of silver were were also added during that same time period, with virtually all of it going into the COMEX. Click to enlarge.
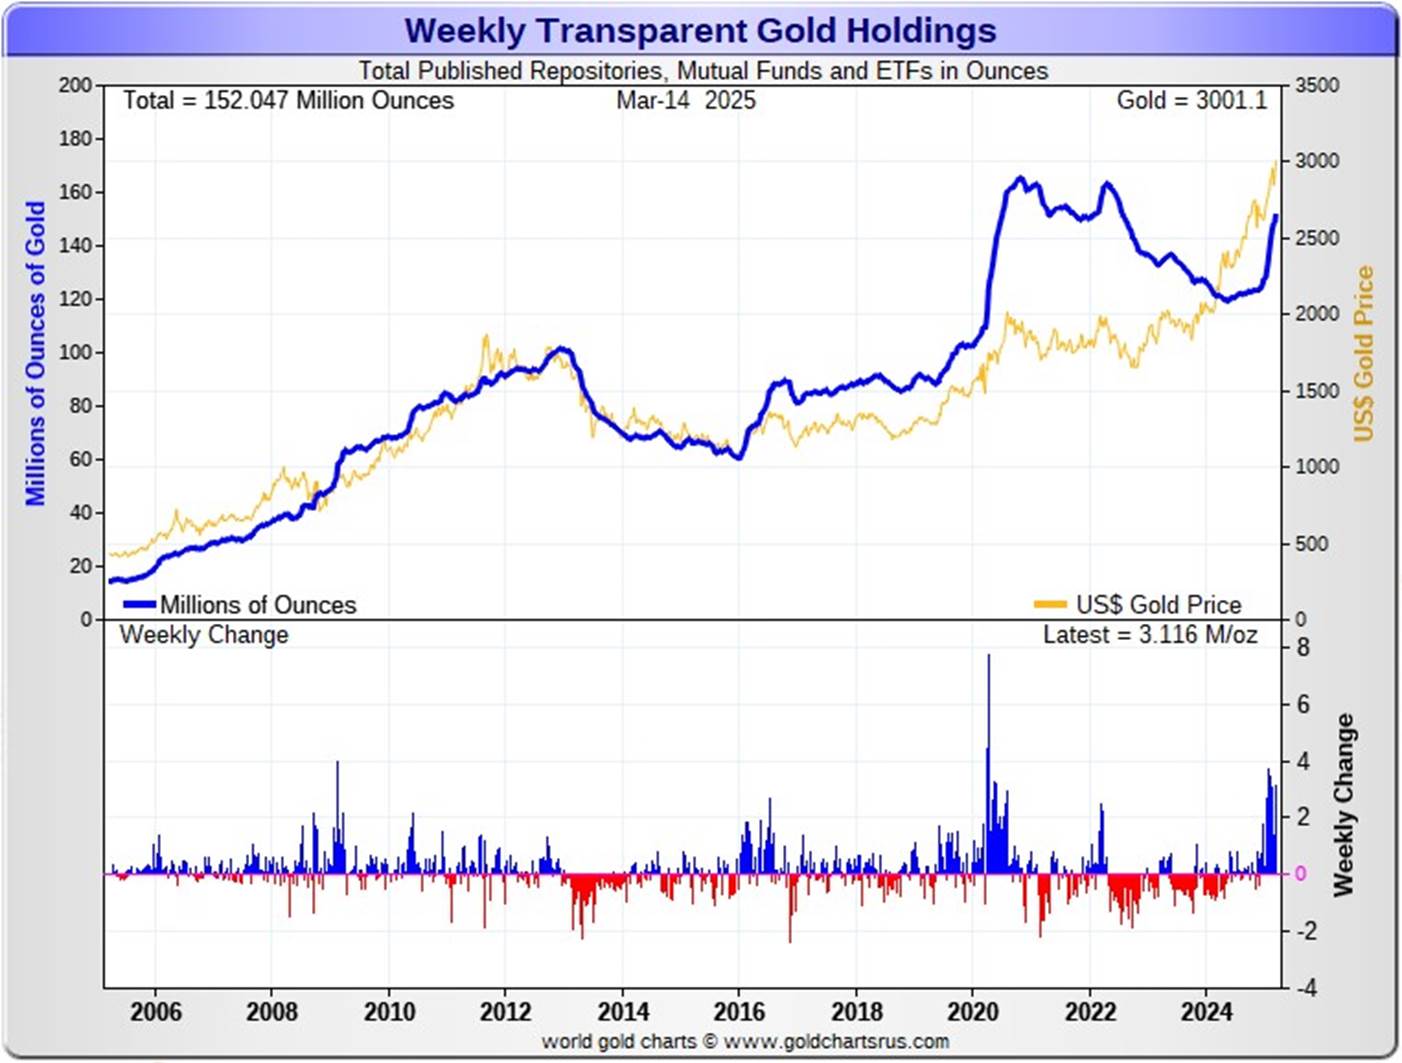
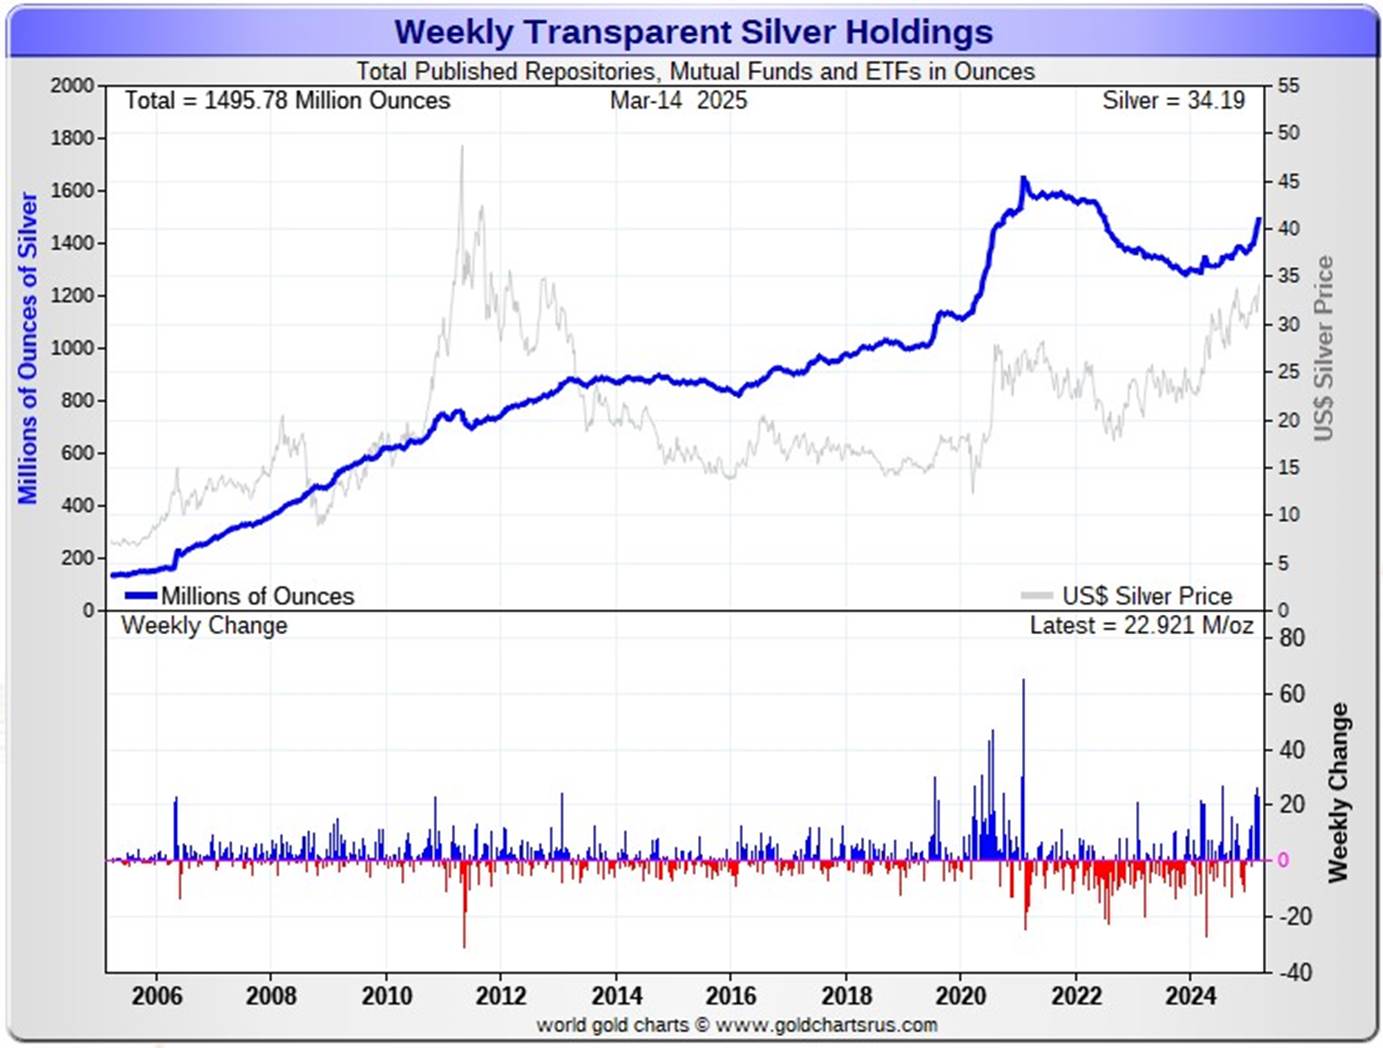
According to Nick Laird's data on his website, a net 7.672 million troy ounces of gold were added to all the world's known depositories, mutual funds and ETFs during the last four weeks -- with a net 4.713 million oz. of it going into either the COMEX or GLD...mostly the former. And a net 77.202 million troy ounces of silver were were also added during that same time period, with a net 65.810 million oz. of that amount going into the COMEX.
Retail bullion sales, from what I've heard from my sources, are not all that bad. Premiums remain at rock bottom -- and I haven't seen any sign that they've been raising them at all. It remains a buyer's market for physical at the retail level, but now for a very limited time only I'm sure...judging by what's happening elsewhere.
At some point there will be large quantities of silver required by all the ETFs and mutual funds once serious institutional buying really kicks in -- and there were big signs of that, both this week and last. But the really big buying lies ahead of us when the silver price is finally allowed to rise substantially, which I'm sure is something that the powers-that-be in the silver world are keenly aware of -- and why they're desperate in their attempts to keep it from rising any faster than it already is. Their efforts were on full display once again yesterday...but can't last forever.
And as Ted stated a while ago now, it stands to reason that JPMorgan has parted with most of the at least one billion troy ounces that they'd accumulated since the drive-by shooting that commenced at the Globex open at 6:00 p.m. EDT on Sunday, April 30, 2011.
They had to supply huge amounts to both India and China in 2024 -- and one has to suspect that this amount of demand will continue in 2025 as well...if not increase further. I also suspect that most of the silver flown into the COMEX from London so far this month and last...over 100 million ounces...came from their stash.
The physical demand in silver at the wholesale level continues unabated -- and was off-the-charts ginormous again this past week. The amount of silver being physically moved, withdrawn, or changing ownership remains breath-taking -- and intensified even further this past week...including March deliveries. That was on prominent display during the December delivery month, as 40.435 million troy ounces of physical silver were delivered/changed hands -- and the 11.85 million troy ounces of silver in January. In February, there were 23.94 million troy ounces issued and stopped...4,788 COMEX contracts -- and 70.5 million ounces have already been delivered in March so far.
New silver has to be brought in from other sources [JPMorgan in London] and elsewhere to meet the ongoing demand for physical metal...as the metal currently sitting in New York is already spoken for and not for sale. That's been more than obvious on the COMEX in the past month or so -- and as mentioned a bit further up, at least 77 million oz. have been flow in from London in the last four weeks. This demand will continue until available supplies are depleted ...which will most likely be the moment that JPMorgan & Friends stop providing silver to feed this deepening structural deficit, now in its fifth year.
The vast majority of precious metals being held in these depositories are by those who won't be selling until the silver price is many multiples of what it is today.
Sprott's PSLV is the third largest depository of silver on Planet Earth with 180.9 million troy ounces...up 300,000 ounces this past week -- but a great distance behind the COMEX, now the largest silver depository, where there are 443.7 million troy ounces being held...up another 18.8 million troy ounces this past week...but minus the 103 million troy ounces being held in trust for SLV by JPMorgan.
That 103 million ounce amount brings JPMorgan's actual silver warehouse stocks down to around the 73.5 million troy ounce mark...quite a bit different than the 176.6 million they indicate they have...up another 7.5 million ounces on the week.
PSLV remains a very long way behind SLV as well...however, they are now the second largest silver depository after the COMEX, with 439.6 million troy ounces as of Friday's close...up 4.0 million troy ounces on the week.
The latest short report from this past Tuesday [for positions held at the close of business on Friday, February 28] showed that the short position in SLV declined by 15.98%...from the 58.50 million shares sold short in the prior report...down to 49.15 million shares in this latest report...a bit over 10% of total SLV shares outstanding. This amount remains grotesque, obscene -- and fraudulent beyond description...as there is no physical silver backing any of it.
BlackRock issued a warning several years ago to all those short SLV, that there might come a time when there wouldn't be enough metal for them to cover. That would only be true if JPMorgan decides not to supply it to whatever entity requires it...which is most certainly a U.S. bullion bank, or perhaps more than one.
The next short report...for positions held at the close of trading on Friday, March 14, yesterday...will be posted on The Wall Street Journal's website on Tuesday evening EDT on March 25.
Then there's that other little matter of the 1-billion ounce short position in silver held by Bank of America in the OTC market...with JPMorgan & Friends on the long side. Ted said it hadn't gone away -- and he'd also come to the conclusion that they're short around 25 million ounces of gold with these same parties as well.
The latest report for the end of Q3/2024 from the OCC came out about two and a half months ago now -- and after careful scrutiny, I noted that the dollar value of their derivative positions were up just under 20 percent on average over the last quarter...the same percentage increase as Q2/2024. I suspect that it was entirely due to the price increases in both gold and silver since the Q2 report came out.
And as I keep pointing out in this spot, the OCC indicator is flawed for two very important reasons, as way back 10-15 years ago, this report used to include the top dozen or so U.S. banks -- and included the likes of Wells Fargo and Morgan Stanley, amongst others...that are card-carrying members of the Big 8 shorts. Now the list is down to just four banks...so a lot of data is hidden ...which is certainly the reason why the list was shortened. On top of that, the list doesn't include the non-U.S. banks that are members of the Big 8 shorts: British, French, German and Canadian banks.
![]()
The Commitment of Traders Report, for positions held at the close of COMEX trading on Tuesday, showed a big increase in the Commercial net short position in silver...mostly because of Ted's raptors selling long positions -- and there was decrease in the commercial net short position in gold.
In silver, the Commercial net short position increased by a hefty 6,412 contracts...or 32.060 million troy ounces of the stuff.
They arrived at that number by reducing their long position by 1,427 COMEX contracts -- and also sold 4,985 short contracts. It's the sum of those two numbers that represents their change for the reporting week.
Under the hood in the Disaggregated COT Report, it was all Managed Money traders, plus a whole bunch more, as the increased their net long position by a further 7,879 COMEX contracts. They accomplished this through the purchase of 6,862 long contracts -- and also bought back 1,017 shorts. It's the sum of those two numbers that represents their change for the reporting week.
The Nonreportable/small traders were also buyers, increasing their net long position by 202 contracts...which meant that the Other Reportables decreased their net long position, which they did to the tune of 1,669 COMEX contracts.
Doing the math: 7,879 plus 202 minus 1,669 equals 6,412 COMEX contracts ...the change in the Commercial net short position.
The Commercial net short positionin silver now stands at 77,356 COMEX contracts/386.780 million troy ounces...up those 6,412 contracts from the 70,944 COMEX contracts/354.720 million troy ounces that they were short in last Friday's COT Report.
The Big 4 shorts [most likely the Big 1 or 2] increased their net short position by 1,108 COMEX contracts...from 56,184 contracts, up to 57,292 contracts -- and monstrously bearish.
The Big '5 through 8' shorts also increased their net short position, them by 520 COMEX contracts...from the 20,285 contracts in last Friday's COT Report, up to 20,805 contracts in yesterday's COT Report -- still hugely bearish.
The Big 8 shorts in total increased their overall net short position from 76,469 contracts, up to 78,097 COMEX contracts week-over-week...an increase of 1,628 COMEX contracts.
But since the Commercial net short position rose by 6,412 contracts in yesterday's COT Report -- and the Big 8 increased their short position by only 1,628 contracts, this meant that Ted's raptors...the small commercial traders other than the Big 8...had to have been big sellers during the reporting week...for huge profits I might add -- and they were...decreasing their long position by 6,412-1,628=4,784 COMEX contracts.
That decreased the raptor's long position from 5,525 COMEX contracts, down to only 741 contracts. In the very bullish October 25, 2024 COT Report, they were net short silver by 7,356 COMEX contracts -- and it's a given that they're now back on the short side considering the price action since the Tuesday cut-off.
Here's Nick's 9-year COT chart for silver -- and updated with the above data. Click to enlarge.

Of course I was not all amused that the Big 8 shorts added to their short positions...but in the overall, the Big 8 really haven't done much since the January 21 COT Report, as most of the heavy lifting has been done by Ted's raptors, the small commercial traders other than the Big 8. They have reduced their net long position from 16,492 contracts back on that date...down to only 741 contracts that they hold long in yesterday's COT Report.
It has been their selling of long contracts which has the mathematical effect of increasing the Commercial net short position...which is not an increase at all. The Big 8, as I just pointed out, have pretty much sat on their hands for the last seven weeks...especially the Big 4. Their increase in yesterday's report was their first increase in three weeks. The Big '5 through 8' shorts haven't done much since very early January.
But make no mistake about it, during silver's rally this week, it's a given that not only have the Big 8 increased their short position...but Ted's raptors have sold what's left of their long position -- and are now back on the short side.
The Big 8 collusive commercial traders are net short 50.3 percent of the total open interest in silver in this week's COT Report, compared to the 52.4 percent they were net short in the last COT Report.
The reason that the above percentage decreased, was because of the 9,328 contract increase in total silver open interest, which obviously affects the percentage calculation.
But from a COMEX futures market perspective, the set-up remains very bearish -- and is even more bearish since Tuesday's cut-off.
As I've been saying recently, I've come to the conclusion that the Big 8 collusive commercial shorts have no intention of ever covering all of their short positions, or even a significant portions of them -- and it's now strictly a price management tool to prevent a silver price explosion. It's always been that way, of course...but is now institutionalized -- and it's for that reason I've lost most of my fear of it...especially considering the record demand for immediate delivery in the physical market.
And nothing has changed with regards to that ongoing and deepening structural deficit in the physical market...which is now in its fifth consecutive year.
As it's been for decades, it only matters what the collusive Big 8 commercial traders do... especially the Big 1 or 2...both of which are U.S. bullion banks, I'm sure.
Of course not to be forgotten -- and which also has a huge and negative impact on the silver price, is the still outrageous short position in SLV...49.15 million shares/troy ounces...as of last short report that came out this past Tuesday.
![]()
![]()
In gold, the commercial net short position fell by 5,927 COMEX contracts... 592,700 troy ounces of the stuff.
They arrived at that number by increasing their long position by 18,832 COMEX contracts -- but also sold 12,905 short contracts. It's the difference between those two numbers that represents their change for the reporting week.
Under the hood in the Disaggregated COT Report I was surprised to see that the Managed Money traders did virtually nothing...increasing their net long position by a paltry 918 COMEX contracts, on almost zero net volume.
It was the traders in the Other Reportables category that did all the selling, decreasing their net long position by 8,079 contracts...while the Nonreportable /small traders increased their net long position by 1,234 COMEX contracts.
Doing the math: 8,079 minus 918 minus 1,234 equals 5,927 COMEX contracts...the change in the commercial net short position.
The commercial net short position in gold now sits at 265,188 COMEX contracts/26.519 million troy ounces of the stuff...down those 5,927 contracts from the 271,115 COMEX contracts/27.112 million troy ounces they were short in last Friday's COT Report -- but still bearish.
The Big 4 shorts in gold decreased their net short position for the seventh week in a row, them by 5,444 contracts...from 140,420 contracts they were short in the last COT report, down to 134,976 contracts in yesterday's report. This is their lowest short position since March 15 of last year...still on the bearish side by a bit, but vastly improved from the 198,271 contracts there were net short in the January 21 COT Report.
The Big '5 through 8' shorts also reduced their net short position by a bit in yesterday's report...from 68,987 contracts they were short in last Friday's COT Report, down to 68,511 contracts held short in the current report...a decline of a further 476 COMEX contracts -- and still on the bearish side by a bit.
The Big 8 short position decreased from 209,407 contracts/20.407 million troy ounces in last Friday's COT Report...down to 203,487 contracts/20.349 million troy ounces in yesterday's...a drop of a further 5,920 COMEX contracts.
But since the commercial net short position fell by 5,927 COMEX contracts during the reporting week -- and the Big 8 commercial short position decreased by 5,920 COMEX contracts, that meant that Ted's raptors...the small commercial traders other than the Big 8 had to have been buyers during the reporting week -- and they were. They decreased their grotesque short position by a meaningless 5,927-5,920=7 COMEX contracts. Their short position is now 61,701 contracts...down from the 61,708 contract record short position they held in last Friday's COT Report. This number obviously remains obscene and grotesque beyond description.
As I mentioned last week, it's now a given that there's a managed money trader, or maybe more than one, with a large enough short position to be somewhere in the Big '5 through 8' commercial category.
Here's Nick's 9-year COT chart for gold -- and updated with the above data. Click to enlarge.

What makes the set up so bearish in gold from a COMEX futures market perspective is the grotesque short position still held by Ted's raptors...those small commercial traders other than the Big 8. And whether they matter or not anymore in the grand scheme of things, is unknown.
However, from a Big 8 short perspective, the set-up for them is bordering on bullish...as their collective short position is down to just about what it was back at the end of October 2023.
But if you remove the influence of the one or two Managed Money traders that currently contaminate that Big 8 commercial net short position, the set-up in gold is ever more bullish than just stated in the previous paragraph.
The Big 8 collusive commercial traders are short 39.8 percent of total open interest in gold in the COMEX futures market...down from the 42.8 percent they were short in the prior COT Report. That 39.8% number would have been a lot bigger if it hadn't been for the 22,006 contract increase in total open interest...which was all spread trade related -- and obviously affects the percentage calculation.
But once you add in the 61,701 contracts currently held short by Ted's raptors, the commercial net short position in gold works out to 51.9 percent of total open interest, down from the 55.4 percent they were short in the prior COT Report...which is still grotesque and obscene beyond description.
That 51.9% number would have also been higher, if total open interest hadn't increased by those aforesaid mentioned 22,006 contracts.
Can gold rally big from here? Of course...as can silver -- and as they did this past week. The only reason they aren't rallying more, is because these collusive commercial traders of whatever stripe always step in as not-for-profit sellers/short sellers of last resort when they do attempt to blow higher. That scenario is on full display multiple times a day -- and certainly was yesterday, as gold would have handily blown above $3,0000 if 'da boyz' hadn't been active.
But the eye-opening dichotomy between the raptor long position in silver...741 contracts vs. the monster short position held by the raptors in gold...61,701 contracts...remains unprecedented. For the most part, these small traders are all the same players in both these precious metals -- and why they're configured at odds with each other like this at the moment, is anyone's guess.
To sum up, from a COMEX futures market perspective, the set-up in gold remains bearish in the overall...but now mildly bullish in the Big 8 short category. However, as said about silver...at some point, as Ted mentioned repeatedly over the years, what the numbers in the COT Report show, won't matter, as they will be trumped by factors beyond the control of the paper hangers in New York.
That process may be in progress now, but it's not being allowed to fully manifest itself in the prices of either of these precious metals at the moment...as the commercial traders of whatever stripe continue to step in when required. Yesterday's price action was yet another poster child for that.
However, since the Tuesday cut-off -- the rallies in both silver and gold since have been met by a wave of short selling by the commercial traders, as the big increases in total open interest in both silver and gold attest to.
![]()
![]()
In the other metals, the Managed Money traders in palladium increased their net short position by a further 397 COMEX contracts -- and are net short palladium by 11,847 contracts...58.7 percent of total open interest. The commercial traders in the Producer/ Merchant category are now back on the short side by a tiny 197 COMEX contracts...but the commercial traders in the Swap Dealers category remain mega net long palladium by 7,723 contracts. The traders in the Other Reportables and Nonreportable/small trader categories remain net long by decent amounts as well.
And it shouldn't be forgotten that the world's banks are net long 14.1 percent of the total open interest in palladium in the COMEX futures market as of last Friday's Bank Participation Report.
In platinum, the Managed Money trader increased their net long position by 744 COMEX contracts during the reporting week -- and remain net long platinum by 3,704 COMEX contracts.
The commercial traders in the Producer/Merchant category in platinum are meganet short a knee-wobbling 25,352 COMEX contracts -- but the Swap Dealers in the commercial category are net long 4,010 contracts. The traders in both the Other Reportables and Nonreportable/small traders categories remain net long platinum by very hefty amounts...especially the Other Reportables.
It's mostly the world's banks in the Producer/Merchant category that are 'The Big Shorts' in platinum in the COMEX futures market, as per March's Bank Participation Report that came out a week ago -- and have decreased their short position in platinum by a bit since the February report.
In copper, the Managed Money traders increased their net long position by 5,314 contracts -- and are net long copper by 14,216 COMEX contracts...about 355 million pounds of the stuff as of yesterday's COT Report...up from the 222 million pounds they were net long copper in last Friday's COT report.
Copper, like platinum, continues to be a wildly bifurcated market in the commercial category. The Producer/Merchant category is net short 41,722 copper contracts/1.043 billion pounds -- while the Swap Dealers are net long 19,666 COMEX contracts/491 million pounds of the stuff.
Whether this means anything or not, will only be known in the fullness of time. Ted said it didn't mean anything as far as he was concerned, as they're all commercial traders in the commercial category. However, this bifurcation has been in place for as many years as I can remember -- and that's a lot.
In this vital industrial commodity, the world's banks...both U.S. and foreign... are net long 9.2 percent of the total open interest in copper in the COMEX futures market as shown in the March Bank Participation Report that came out last Friday -- and up a decent amount from the 6.9 percent they were net long in February's.
At the moment it's the commodity trading houses such as Glencore and Trafigura et al., along with some hedge funds, that are net short copper in the Producer/Merchant category, as the Swap Dealers are net long, as pointed out above.
The next Bank Participation Report is due out on Friday, April 4.
![]()
Here’s Nick Laird’s “Days to Cover” chart, updated with the COT data for positions held at the close of COMEX trading on Tuesday, March 11. It shows the days of world production that it would take to cover the short positions of the Big 4 — and Big '5 through 8' traders in every physically traded commodity on the COMEX. Click to enlarge..
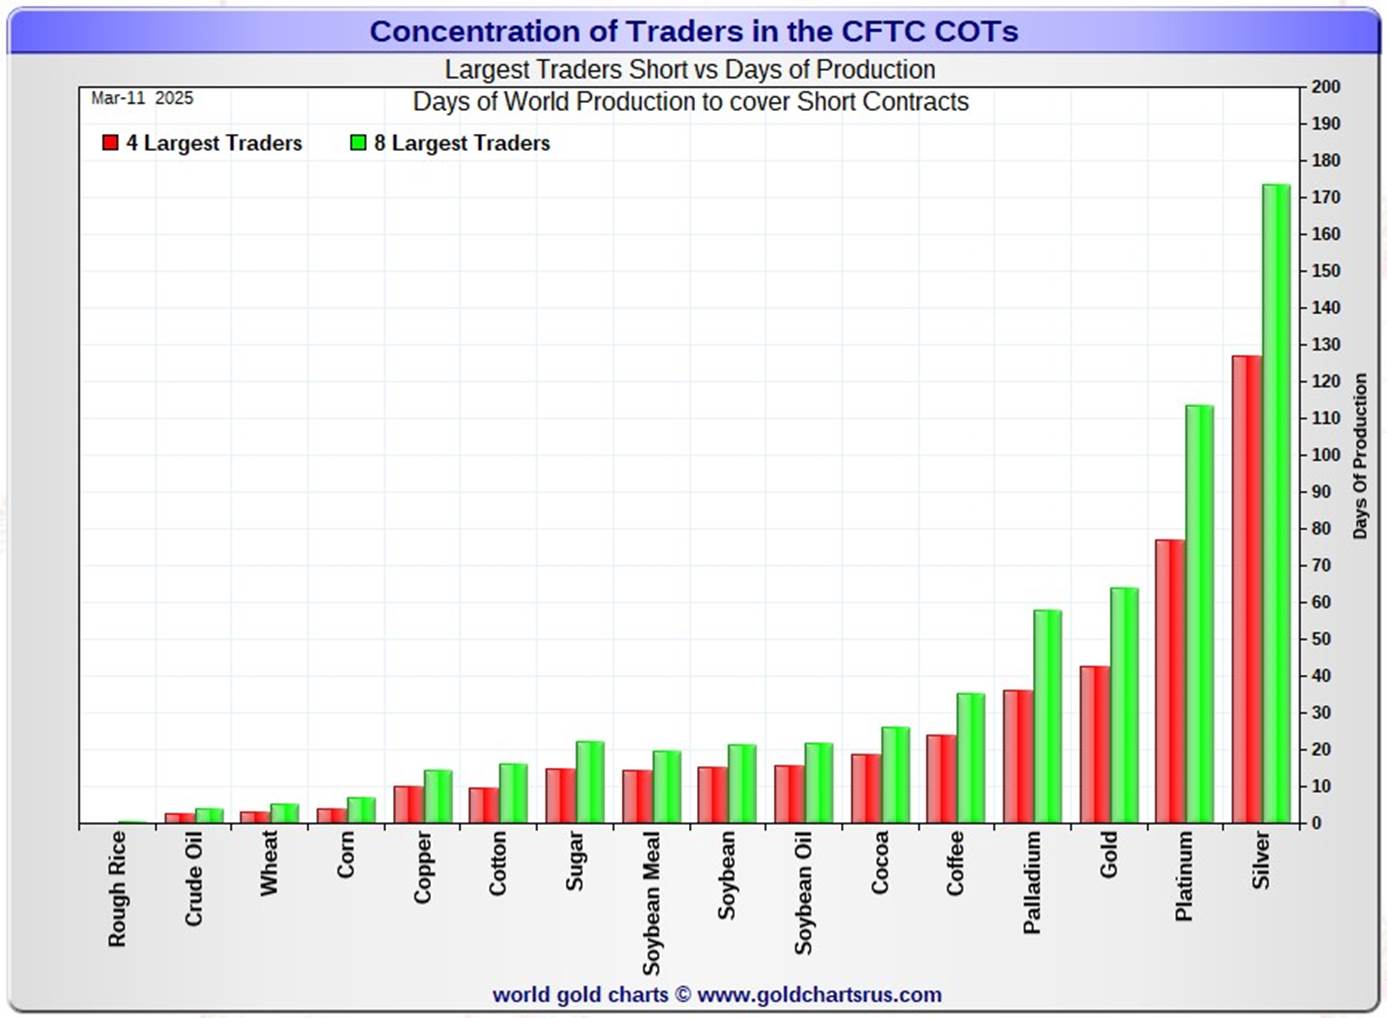
In this week's data, the Big 4 traders are short 127 days of world silver production... up about 2 days from the prior COT report. The ‘5 through 8’ large traders are short an additional 46 days of world silver production ...up about 1 day from the last COT Report, for a total of about 173 days that the Big 8 are short -- and up 3 days from last Friday's COT report.
Those 173 days that the Big 8 traders are short, represents around 5.8 months of world silver production, or 390.485 million troy ounces/78,097 COMEX contracts of paper silver held short by these eight commercial traders. Several of the largest of these are now non-banking entities, as per Ted's discovery a year or so ago. March's Bank Participation Report continued to confirm that this is still the case -- and not just in silver, either.
As mentioned further up, the small commercial traders other than the Big 8 shorts, Ted's raptors, are now only net long silver by 741 COMEX contracts... down from the 5,525 contracts they were net long in last Friday's COT Report. Since the cut-off on Tuesday, it's now a given that they are now net short silver.
In gold, the Big 4 are short about 42 days of world gold production...down about 2 days from the prior COT Report. The Big '5 through 8' are short an additional 22 days of world production, unchanged from last the last report... for a total of 64 days of world gold production held short by the Big 8 -- and obviously down 2 days from last Friday's COT Report.
As mentioned further up, the Big 8 commercial traders are net short 50.3 percent of the entire open interest in silver in the COMEX futures market as of yesterday's COT Report, down from the 52.4 percent they were net short in last Friday's report. The reason that the percentage number fell was because of that 9,328 contract increase in total open interest, which obviously affects the percentage calculation.
In gold, it's 39.8 percent of the total COMEX open interest that the Big 8 are net short, down from the 42.8 percent they were net short in the last COT Report -- and would have been higher, except for the monstrous 22,006 contract increase in total open interest during the reporting week, which obviously affects the calculation in it as well.
But the total commercial net short position in gold is 51.9 percent of total open interest once you add in what Ted's raptors [the small commercial traders other than the Big 8] are short on top of that...a further 61,701 COMEX contracts. That number would have also been higher except for that increase in total open interest.
Ted was of the opinion that Bank of America is short about one billion ounces of silver in the OTC market, courtesy of JPMorgan & Friends. He was also of the opinion that they're short 25 million ounces of gold as well. And the latest report from late December [for Q3/2024] shows that their positions are up 20 percent from what they were holding at the end of Q2/2024...with most of that increase most likely being price related. One wonders if Mr. Buffet is done dumping the rest of the stock he has in that company. There was this story about it on Zero Hedge about a month ago.
The short position in SLV now sits at 49.15 million shares as of Tuesday's short report, for positions held at the close of COMEX trading on Friday, February 28...down 15.98 percent from the 58.50 million shares sold short on the NYSE in the prior report. This number remains off-the-charts grotesque and obscene -- but yet another way that 'da boyz' are controlling the silver price.
The next short report is due out next Tuesday, March 25...for positions held at the close of COMEX trading yesterday...Friday, March 14.
The situation regarding the Big 4/8 commercial short positions in the COMEX futures market in silver remains very bearish...but is now mildly bullish in gold. However, since the Tuesday cut-off, its a guarantee that their short positions have increased further in both.
As Ted had been pointing out ad nauseam, the resolution of the Big 4/8 short positions will be the sole determinant of precious metal prices going forward -- although the monster short position held by his raptors in gold is still of some concern.
I have a fairly decent number of stories, articles and videos for you today.
![]()
CRITICAL READS
Panicking Democrats Send UMich Inflation Expectations to Highest in 32 Years
UMich inflation expectations exploded even higher in preliminary March data with medium-term views spiking to +3.9% -- the highest since 1993...
There's just one thing... it's all Democrats...
Republicans expect very little inflation over the next five years but Democrats expect a surge to +4.6%...
Short-term expectations are even more divided with Democrats expecting inflation to explode to 6.5% this year while Republicans expect no inflation...
Overall, consumer sentiment declined significantly...
According to Democrats, this is the apocalypse, folks.
Finally, the UMich (inflation expectations) data is dramatically different from all the other inflation surveys - including the New York Fed's...which makes us wonder who exactly are UMich surveyors asking these questions to?
This multi-chart Zero Hedge article showed up on their Internet site at 11:11 a.m. on Friday morning EDT -- and another link to it is here.
![]()
![]()
Will the Fed Ride to the Rescue? -- Jim Rickards
The stock market has topped out and is headed down.
The Dow Jones Industrial Average peaked at 45,014 on December 4, 2024, and was at 41,911 by March 10, 2025, down 3,101 points or 6.9% in just over three months.
The S&P 500 Index peaked at 6,130 on February 18, 2025, and was at 5,614 on March 10, 2025, down 516 points or 8.4% in less than one month.
The NASDAQ Composite Index peaked at 20,174 on December 16, 2024, and was at 17,468 on March 7, 2025, down 2,706 points or 13.4% in less than three months and technically a market “correction” (defined as a 10% or more decline from a previous peak).
None of those index performances is a full-blown crash nor do they represent a market panic. Stock market indices are volatile, and they may partially bounce back by the time you read this. Still, down is down. We have to look at the reasons for this and use our predictive analytical techniques to see where the markets go from here.
This interesting commentary from Jim was posted on the dailyreckoning.com Internet site on Friday -- and another link to it is here. Gregory Mannarino's post market close rant for Friday is linked here -- and this one runs for 30 minutes.
![]()
![]()
Q4 2024 Z.1 and the Start of Deleveraging -- Doug Noland
The thesis holds that a multi-decade super cycle Credit Bubble - over recent years succumbing to “terminal phase excess” - has turned increasingly fragile. Q4 2024 Z.1 data from the Federal Reserve corroborate the analysis.
Non-Financial Debt (NFD) expanded $3.467 TN during 2024, to a record $76.731 TN. Debt growth was down slightly from 2023’s $3.594 TN – while still about 90% above the two-decade (2000-2019) annual average of $1.836 TN. NFD inflated $21.583 TN, or 39%, over the past 20 quarters. For comparison, NFD expanded $11.074 TN, or 25%, over the preceding 20 quarters (Q4 ’14 to Q4 ’19). Since 2008, NFD has inflated $40.851 TN, or 114%.
As has been the case throughout this late-super cycle phase, government finance dominates the Credit system.
Treasury Securities increased (nominal) $589 billion during Q4, with one-year growth of $2.040 TN. Over the past five years, Treasury Securities has inflated $12.316 TN, or 57.1%. Since 2007, Treasuries have ballooned $25.837 TN, or 321%. After ending 2007 at 55.5%, Treasury Securities as a percentage of GDP inflated to 96.4% to end 2024.
Agency Securities rose $111 billion to a record $12.249 TN, the strongest quarterly growth since the banking crisis Q1 2023. Agency Securities inflated $2.906 TN, or 31.1%, over 21 quarters. Why do the agencies continue such rapid expansion? Treasury and Agency Securities combined to expand $2.186 TN over the past year to a record $40.389 TN – or 136% of GDP – with historic five-year growth of $14.576 TN, or 58%.
Risk aversion and waning liquidity erupted (as it does) this week at the “periphery.” High yield bond spreads surged 22 bps Thursday, the largest daily increase since global deleveraging day, August 5th, 2024. Prior to Friday’s 14 bps narrowing, high yield spreads were 44 wider w-t-d at Thursday’s close.
This was the largest widening move since the 55 bps increase for the week of August 2nd (preceding August 5th instability). At Thursday’s close, high yield spreads had widened 79 bps since February 18th – to the high since August 14th.
Tariff, inflation, and recession risks weigh on market confidence. But I also believe there is escalating fear of four years of erratic and incoherent policymaking. It’s worth repeating: This is no environment for aggressive leveraging. And I don’t see history’s greatest speculative Bubble, which succumbed to manic “blow off” excess in 2024, surviving a major deleveraging dynamic. At this point, the Trump “put” looks like a big, beautifully overhyped dud.
Hamstrung by elevated inflation and trade war risks, the Fed “put” is also suspect. It likely comes lower and later than markets anticipate. I doubt the Fed appreciates the amount of QE that will be required to stabilize a major deleveraging event. And listening to the President’s speech this afternoon at the Justice Department only reinforced the darkness that is enveloping our nation.
This unhappy commentary from Doug appeared on his website sometime after midnight PDT on Saturday morning -- and another link to it is here.
![]()
![]()
The Enemy’s Plan to Seize Your Money “Is right on Schedule” -- G. Edward Griffin
This 33-minute video interview with Ed Griffin -- and hosted by Daniela Cambone, was posted on the youtube.com Internet site on Wednesday. For content reasons, I though it best to save it for Saturday's column. I must admit that I haven't had the time to watch it yet...but will make amends over the weekend. I thank Guido Tricot for pointing it out -- and another link to it is here.
![]()
![]()
INTEL Round Table -- with/Larry Johnson & Ray McGovern : Weekly Wrap
This worthwhile 33-minute video interview with Johnson and McGovern was hosted by Judge Andrew Napolitano -- and was posted on the youtube.com Internet site on Friday afternoon. I thank Guido Tricot for this one as well -- and another link to it is here.
![]()
![]()
Gold’s going to reach $4,000, says Gundlach. He also puts recession probability at 60%
The so-called bond king has been a gold bull for a while, and he says the yellow metal will get to $4,000.
“Gold continues its bull market that we’ve been talking about really now for a couple of years ever since gold was down to $1,800,” DoubleLine Chief Executive and Chief Investment Officer Jeffrey Gundlach told investors on a call he hosted that was held this week, but before gold futures reached the $3,000 per ounce milestone for the first time.
“I’d be so bold to say I think gold will make it to $4,000. I’m not sure that’ll happen this year, but I feel like that’s the measured move anticipated by the long consolidation at around $1,800 on gold,” he said.
Gundlach said central-bank purchases of gold have increased at a “very sharp, steep trajectory. And I don’t expect this to stop.”
“I think that that’s in recognition of gold as a storehouse of value that’s more outside of the financial system, which seems to be in a state of flux at this point in time,” he added.
This gold-related story was posted on the marketwatch.com Internet site at 6:46 a.m. EDT on Friday morning -- and it thank Judy Sturgis for sharing it with us. Another link to it is here.
![]()
![]()
A Monster Run on Gold -- Sean Ring
Yesterday, for the first time in history, gold futures traded above $3,000/oz. Gold bugs who’ve waited a generation for this deserve their celebration.
Here at the Rude, we’ve been jumping up and down over gold since it first bumped its head on the $2,000 level—that was 50% ago. And if you’ve been in the miners, congratulations—you’ve had an incredible run. That run is still in its early stages.
While less exciting, silver futures hit $34.75 in overnight trading, setting the stage for a move over $35 and then over $50. Once we get out of the 30s, the excitement will be palpable.
What’s driving all this?
Central banks have been buying for years, and retail investors have yet to enter the market. As a story, inflation is getting old. No, I’ll let you in on a little secret. Something seismic is happening under the pavement of the markets that will change our economic system as we know it. Strap yourself in.
This interesting gold-related commentary put in an appearance on the rudeawakening.info Internet site on Friday -- and I thank Gordon Foreman for pointing it out. Another link to it is here.
![]()
![]()
The Great Gold Leasing Conspiracy -- Adam Sharp
For decades, we gold bugs have whispered about a grand conspiracy.
The theory is that governments and central banks have suppressed the price of gold and silver. The purpose of this manipulation would be to prop up fiat currencies by limiting the gains in precious metals.
After all, if gold and silver are flying higher, it makes fiat currencies look bad by comparison.
The best evidence of such a scheme is arguably Fed Chairman Alan Greenspan’s statement to Congress that, “central banks stand ready to lease gold in increasing quantities should the price rise.”
Gold Leasing
Jim Rickards wrote about gold leasing in his book, The New Case for Gold. Here’s an excerpt from the chapter titled “Paper Manipulation”:
“A central bank can lease gold to one of the London Bullion Market Association banks, which include large players like Goldman Sachs, Citibank, JPMorgan Chase, and HSBC. Gold leasing is often conducted through an unaccountable intermediary called the Bank for International Settlements.
Historically, the BIS has been used as a major channel for manipulating the gold market and for conducting sales of gold between central banks and commercial banks. … The BIS is the most nontransparent institution in the world. … The BIS is the ideal venue for central banks to manipulate the global financial markets, including gold, with complete non-transparency.”
Why would central banks lease their gold out? Officially, so they can get a small amount of income. But some of us believe it also helps suppress prices.
Well, better 25 years late, than never, one has to suppose. What planet has this guy been on for the last generation or so? This commentary put in an appearance on the dailyreckoning.com Internet site on Friday -- and I found it embedded in a GATA dispatch. Another link to it is here.
![]()
![]()
From London to New York via Switzerland: the booming trade in gold bars -- Financial Times
The furnaces are roaring 24 hours a day at the Argor-Heraeus refinery in southern Switzerland, punctuated by the occasional plunk of a freshly poured gold bar falling out of its mould.
The refinery has never been busier, according to co-chief executive Robin Kolvenbach, and the foundry has been working around the clock since December to keep up with massive demand for 1kg gold bars in New York.
“Demand has increased quite a bit,” said Kolvenbach. “Typically a period of peak demand would last for one or two weeks. But peak demand like we have at the moment, which has lasted more than three months, is quite unusual.”
Since December, fears that U.S. President Donald Trump could slap tariffs on gold imports have upended the market — and helped the gold price to a record high of more than $3,000 per troy ounce on Friday. More than $61bn of bullion poured into the U.S. as traders scrambled to avoid the potential levies, distorting the country’s trade data and sparking a shortage in London, the world’s biggest gold trading hub.
Another interesting gold-related story...this one from the Financial Times of London on Thursday -- and it comes to us courtesy of Hugh Thomas. Another link to it is here.
![]()
QUOTE of the DAY

![]()
The WRAP
"Understand this. Things are now in motion that cannot be undone." -- Gandalf the White
![]()
Today's pop 'blast from the past' needs no introduction whatsoever...nor does the group that sings it. Recorded in 1979...it has never grown old. Cash Box called it "another exercise of sparkling euro-pop, with the slightest hint of boogie bottom to give the song an edge." That it does -- and the youtube.com video has been viewed over 535 million times. The link is here. The bass cover to this has been viewed 3.1 million times -- and that's linked here.
Today's classical 'blast from the past' is a monster composition from Johannes Brahms.
His Piano Concerto No. 2 in B♭ major, Op. 83, is separated by a gap of 22 years from his first piano concerto. Brahms began work on the piece in 1878 and completed it in 1881 while in Pressbaum near Vienna. It took him three years to work on this concerto, which indicates that he was always self-critical. He wrote to Clara Schumann: "I want to tell you that I have written a very small piano concerto with a very small and pretty scherzo."
Ironically, he was describing a huge piece. This concerto was dedicated to his teacher, Eduard Marxsen. The public premiere of the concerto was given in Budapest on 9 November 1881, with Brahms as soloist and the Budapest Philharmonic Orchestra, and was an immediate success.
And the work is still performed today to sell-out crowds in any concert hall in which it is performed. The reason it's featured today is because I ran across a performance of the work by a Russian concert pianist I'd not heard of before -- and it was a tour de force. He just attacks this thing -- and it is an absolutely amazing performance.
It's an old recording from way back on 11 November 1987 -- and the video quality isn't all that great...plus there's time burn in it as well. But the audio is terrific -- and that's all that matters. The pianist is Grigory Sokolov -- and a very young [relatively speaking] Maestro Jukka-Pekka Saraste conducts the Finnish Radio Symphony Orchestra. The link to it is here.
![]()
![]()
I saw the high ticks in both gold and silver printed at the morning gold fix in London on their Friday before I went to bed on my Friday morning PDT -- and I was just hoping that they weren't going to beat the living snot out of them by the 11 a.m. EDT afternoon gold fix in London -- and they didn't.
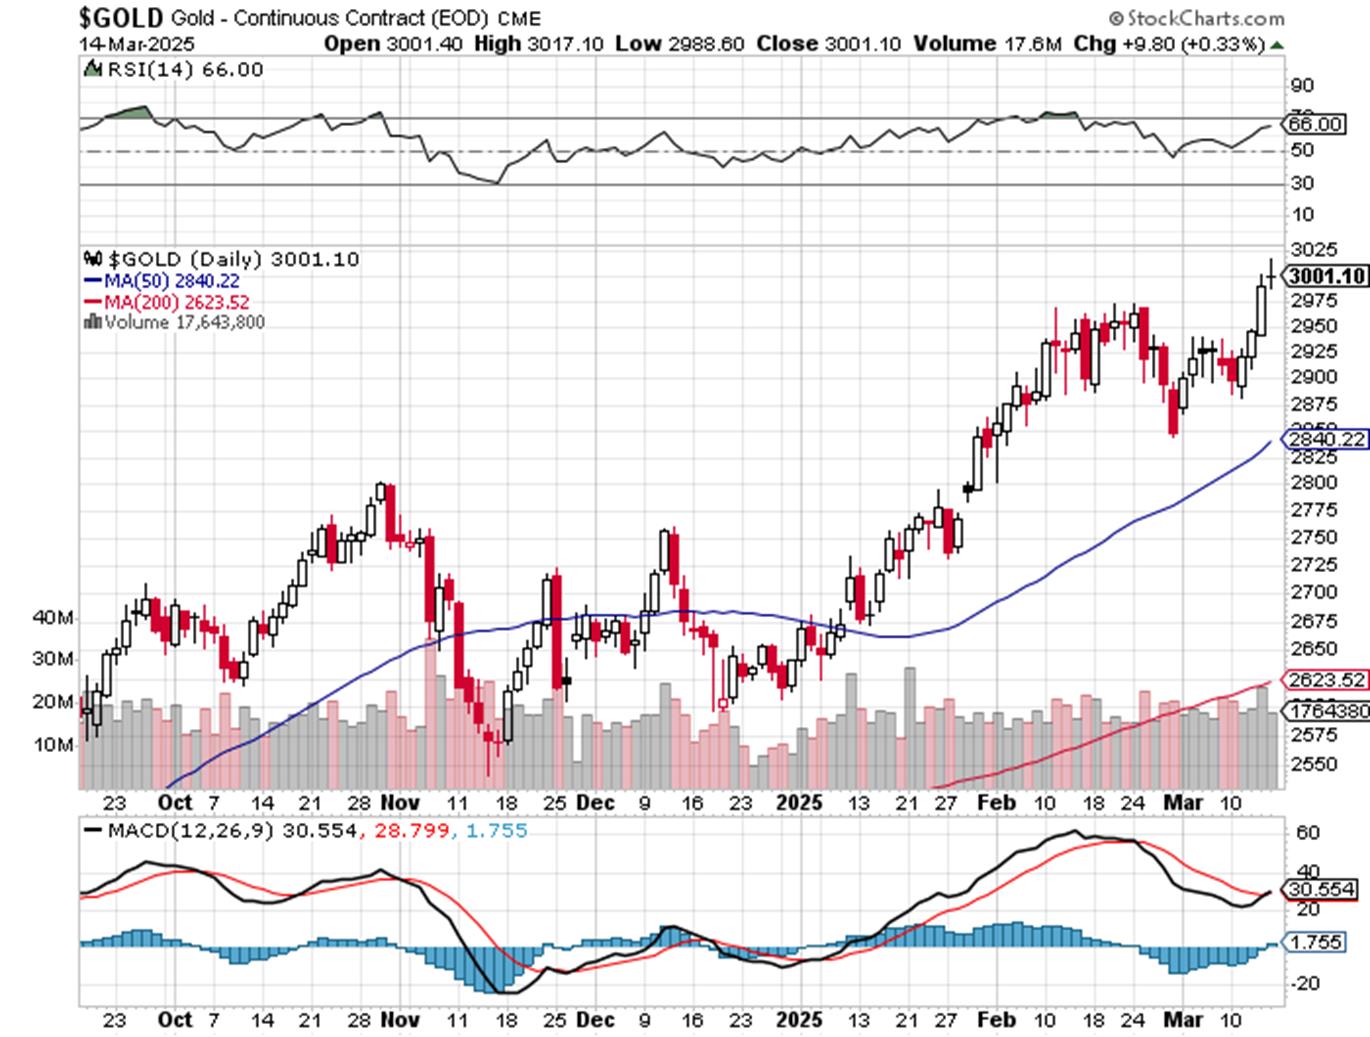
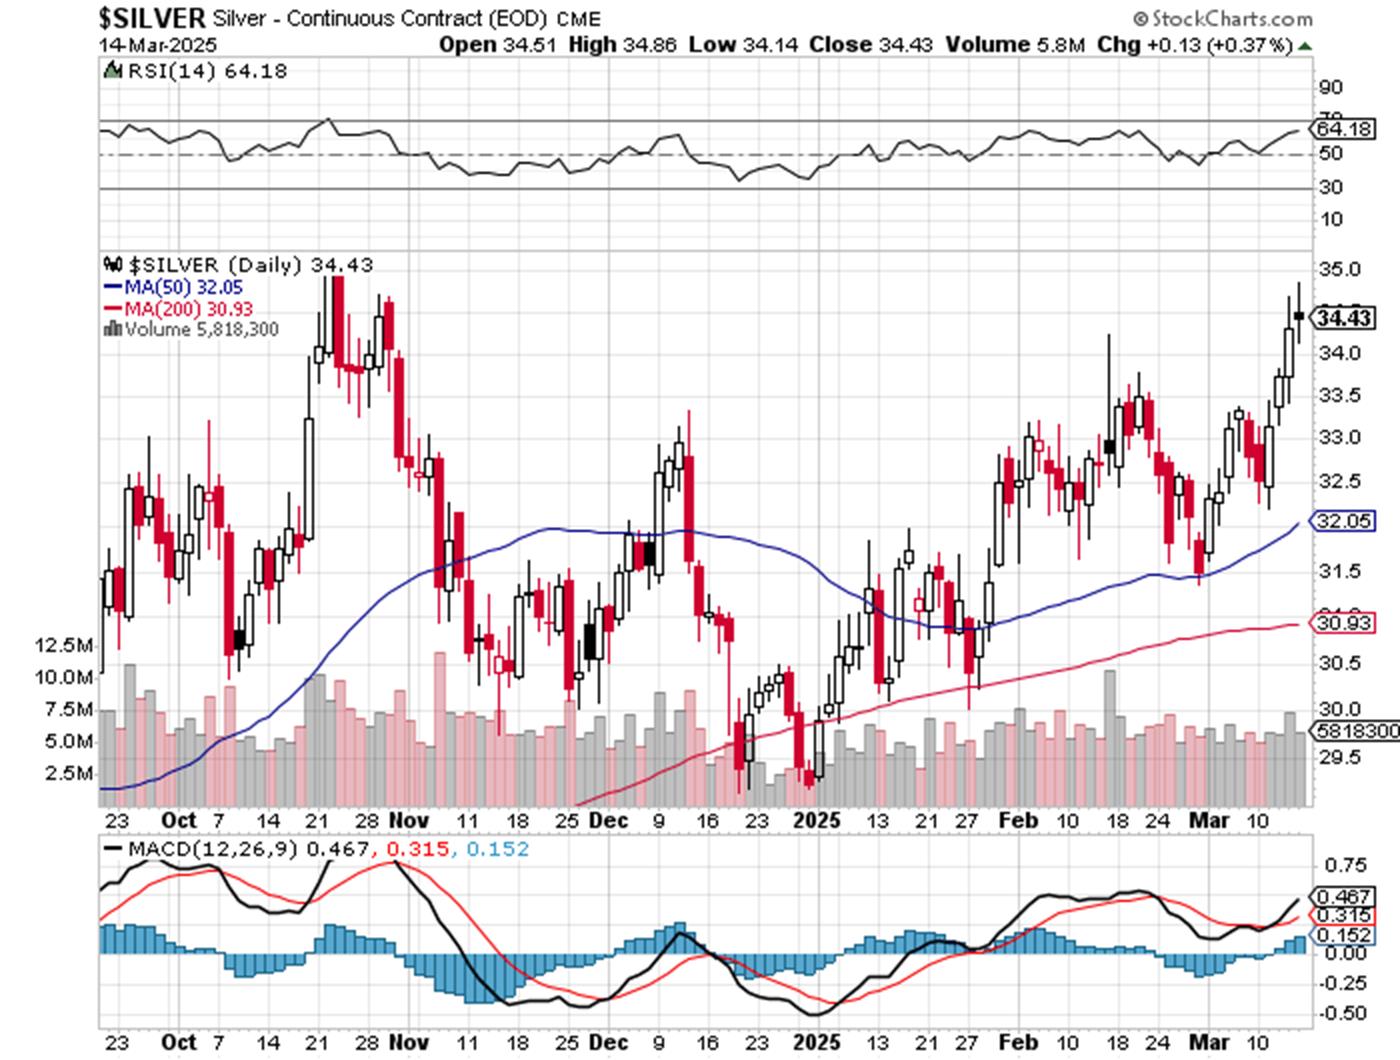
They were just content to close gold below $3,000 -- and silver below $34 the ounce in the spot market...but both closed above those prices by a bit in their current front months.
But it was certainly obvious that both would have closed materially above both those prices if left to their own devices...as it appears that neither of those round-number figures were going to be any sort of psychological price barriers...especially in silver. Both are still hovering below the overbought marks on their respective RSI traces.
Volumes in both weren't overly heavy, so they had a pretty easy time of it.
Although platinum was closed down a dollar in the spot market, it closed higher by $7.20 in its current front -- and palladium, down 3 bucks in the spot market, closed up $9.40 in its current front month. Both were closed well off their respective high ticks -- and in the case of palladium...22 bucks off its.
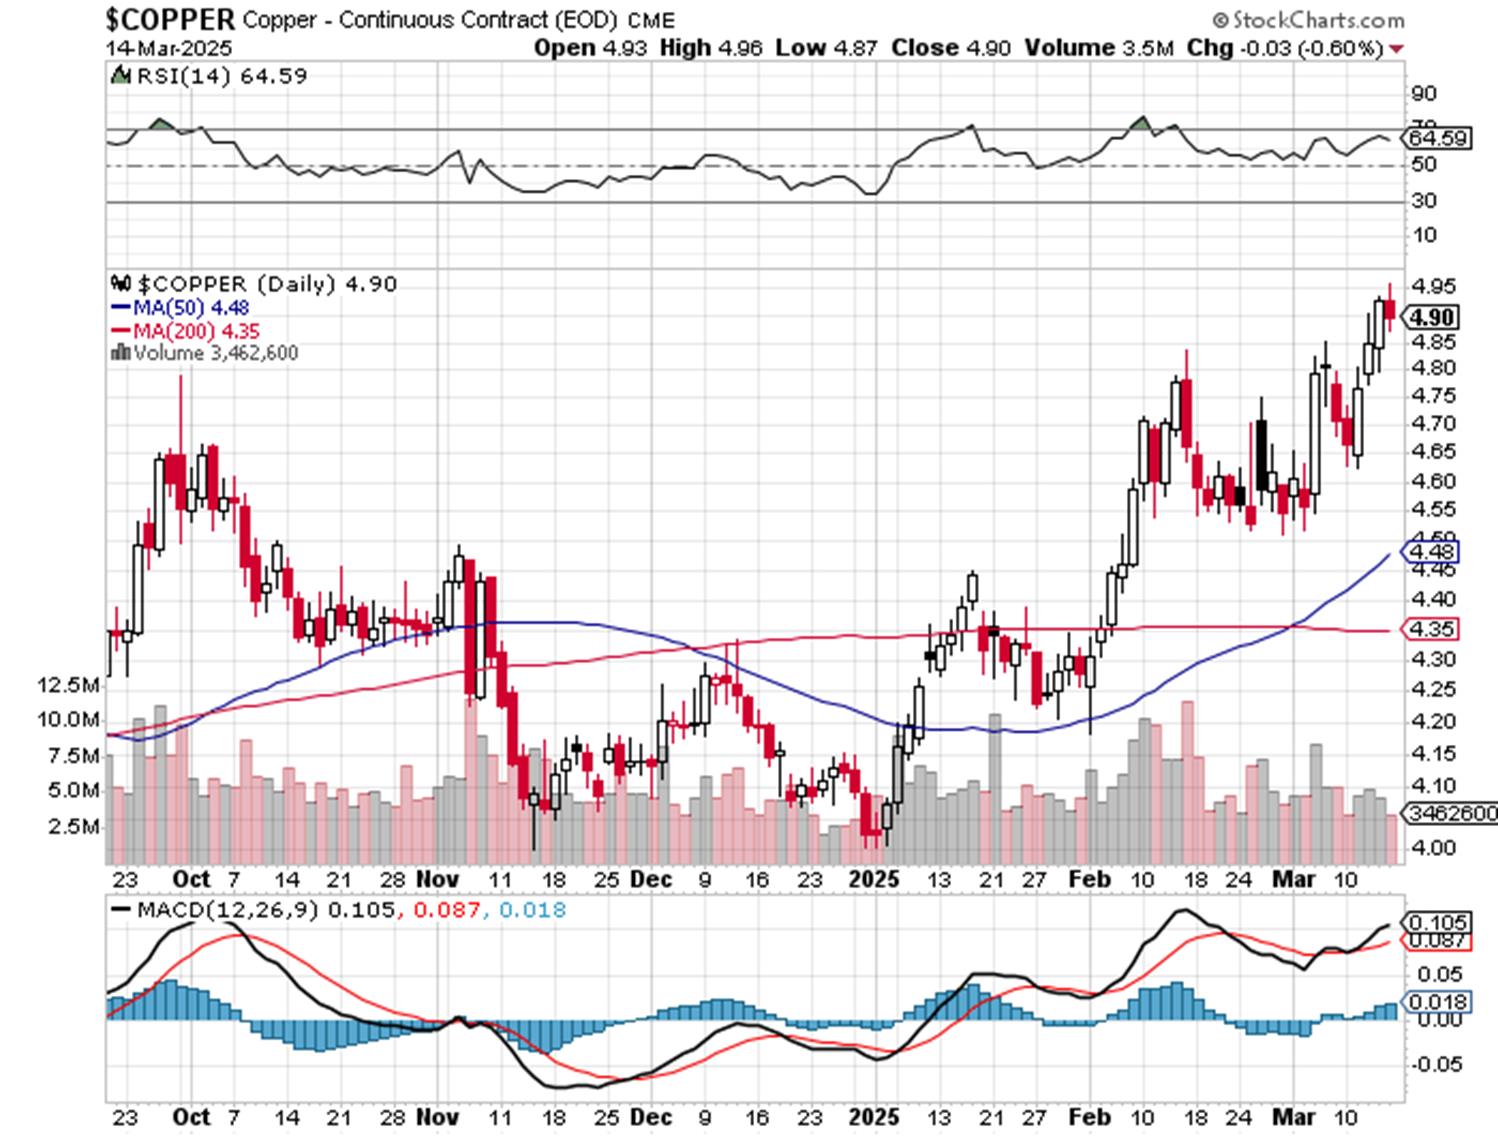
'Da boyz' weren't going to allow copper to close higher four days in a row -- and they didn't... closing it down 3 cents at $4.90/pound -- and 6 cents off its high.
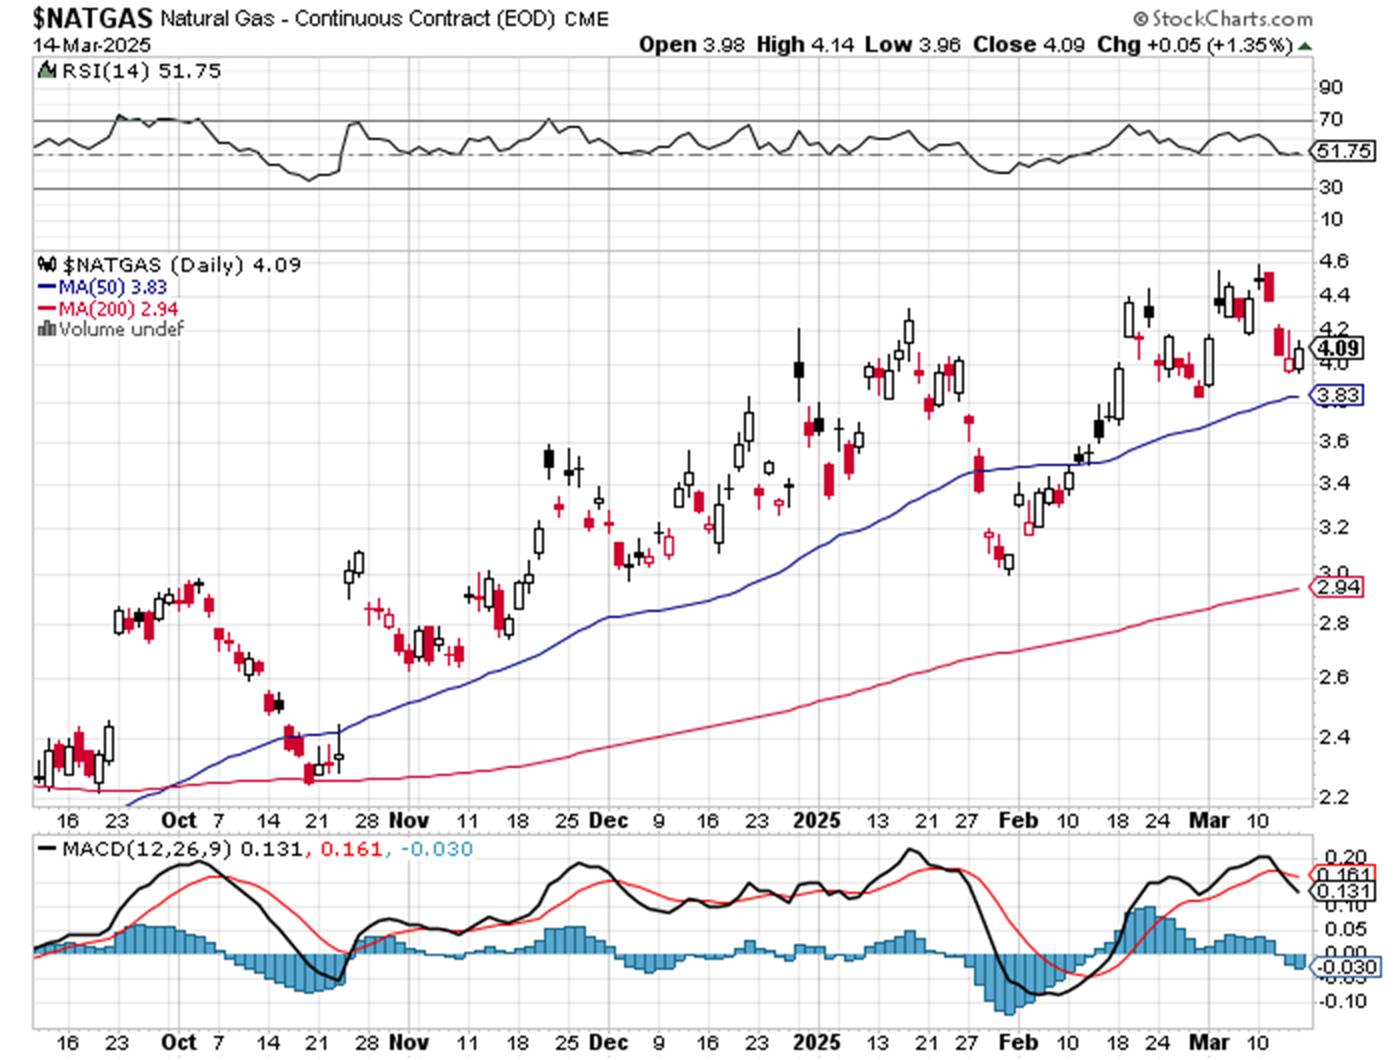
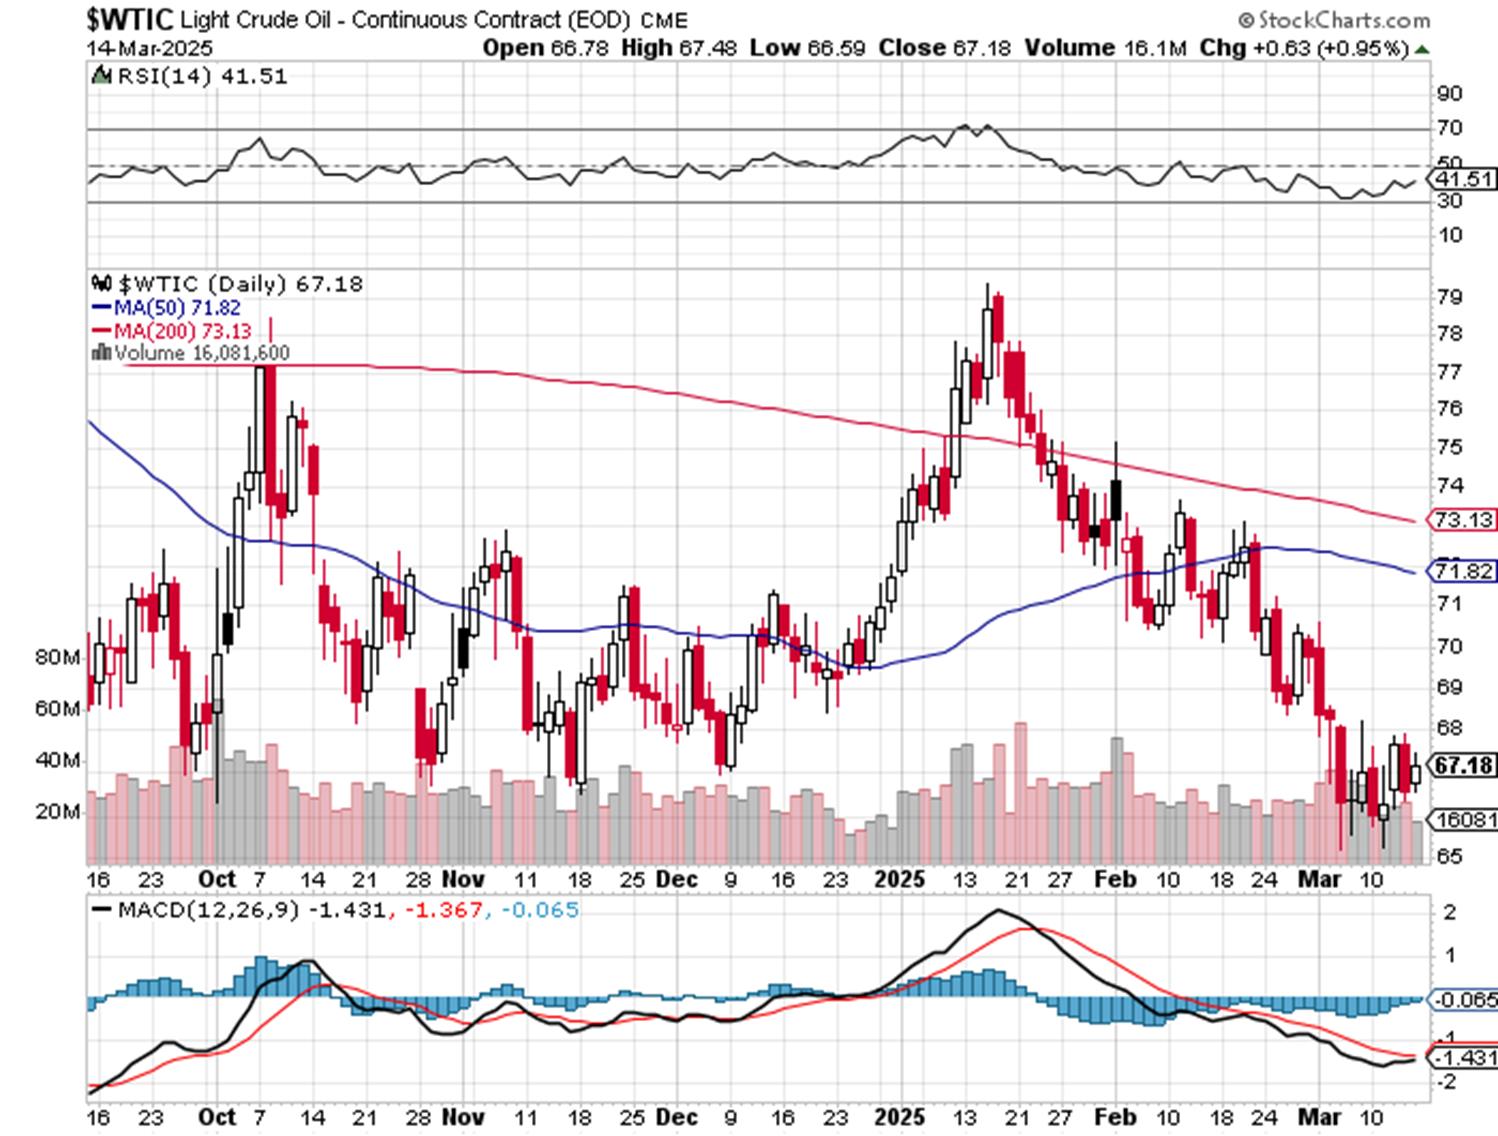
Natural gas [chart included] closed up an inconsequential 5 cents at $4.09/1,000 cubic feet -- and WTIC closed up 63 cents at $67.18/barrel.
Here are the 6-month charts for the Big 6+1 commodities...courtesy of stockcharts.com as always and, if interested, their COMEX closing prices in their current front months on Friday should be noted. Click to enlarge.
"There's something happening here. What it is ain't exactly clear." -- Buffalo Springfield, "For What It's Worth"...1967
All the gold [and silver] flying across the Atlantic this year so far is getting more press with each passing week -- and you just have to know that it's a really big deal when even the Financial Times of London has a photo essay about it on their website...which is included in the Critical Reads section above.
These two precious metals are obviously now in play in a major way -- and as I pointed out above the 6-month charts, both gold and silver would have handily blown through $3,000 and $34 respectively if those pesky commercial traders of whatever stripe hadn't showed up to ensure that they didn't. However, it is the first Friday in a month where they haven't bombed the precious metals going into the weekend -- and we'll see what happens after the FOMC meeting is over at 2 p.m. on Wednesday.
Gold and silver continue to pour into New York from various parts of the world...2.210 million troy ounces of gold, plus 36.873 million ounce of silver during the first nine business days of March.
And those number don't include the 7.135 million troy ounces of silver added to SLV...or the 479,615 troy ounces of gold added to GLD over the same time period...nor does it include what's been added to other ETFs and mutual funds...2.960 million troy ounces in the last four weeks.
There are still around 1,700 silver contracts/8.5 million troy ounces open for delivery in March ...with more being added every day -- and the same for gold. As you already know, the demand for immediate delivery in gold as per the Daily Delivery and Preliminary Reports has picked up substantially over the last few days...with demand in silver not far behind.
Since the beginning of the month, I've also been keeping religious track of April open interest in silver, which is now 2,200 COMEX contracts...11 million troy ounces worth...with more contracts being added to that non-scheduled delivery month every day as well.
The gold and silver mines of Planet Earth only churn out 2.2532 million troy ounces of silver, plus a bit over 318,000 troy ounces of gold every day of the year. Silver is acknowledged to be entering the fifth year of its structural deficit -- and based on the demand for gold, a structural deficit in it looms larger with each passing day.
There's a growing sense in the precious metals world that some sort of denouement is in our future -- and I fully endorse those sentiments. This unprecedented rush for delivery...bordering on panic...can't go on forever, as the 'float' at the LBMA -- and perhaps elsewhere, is finite. This is particularly true of silver.
The only question remaining in my mind, is how this denouement will manifest itself. Will it be by design...or circumstance? Will the powers-that-be control, or attempt to control, a repricing of both silver and gold...or will they let the free markets prevail?
The unbooked/unrealized margin call losses of the shorts in both gold and silver in the COMEX futures market is already north of $30 billion -- and that doesn't include losses in options, or in the OTC market. An uncontrolled rise in both would send that number to the hundreds of billions in days, if not hours...bankrupting the lot. Read Ted Butler's "Take It To the Limit" -- and "The Bonfire of the Silver Shorts."
So the question has to be asked...will the CME Group, LBMA and COMEX allow it?...with another question being...can they prevent it? As Ted Butler pointed out on many occasions over the years, the sole purpose of these organizations is to protect the big shorts...with the blow-up in nickel on the LME a couple of years back being the poster child for that, as 'The Big Short' got bailed -- and the longs got screwed out of all their profits. The credibility of the exchange was severely damaged -- and it barely survived.
But nickel is a dinky little market compared to either silver or gold...which are both enormous and global in scope...at both the wholesale and retail levels. It is my opinion, as it is of many others, that silver should be priced at around ten times what it is today -- and gold at whatever. But the past 50+ years of price management has kept a lid on their prices [and all other commodities] since.
Nobody knows what the true prices of gold and silver really are, as they've never been allowed to trade freely in our lifetimes...or even over the last several hundred years. This is the Gordian Knot that the globalist financial power elite either have to unravel...or cut -- and are now forced to deal with as they watch their inventories in both dwindle down to nothing.
Whatever form this [most likely draconian] resolution takes, it will certainly shake, if not destroy, the world's current financial and fiat currency system. Maybe this is the much talked about 'Great Reset'...or part of it...that's most certainly in our future.
Alan Greenspan, speaking to the U.S. Congress in 1999, said: "Gold still represents the ultimate form of payment in the world. Fiat money, in extremis, is accepted by nobody. Gold is always accepted."
I suspect that when the dust finally settles from the smouldering ruins of whatever financial fate awaits the world...Alan will be proven correct.
Those are all the reasons that I need to be "all in" -- and, as always, will remain so to whatever end.
See you here on Tuesday.
Ed
About the author

SUBSCRIBE: https://edsteergoldsilver.com/

Ed Steer’s Daily Analysis of the Gold and Silver Markets
After eight years of writing about the precious metals for Casey Research, the folks at Stansberry & Associates—who just recently purchased controlling interest in the company—decided that my ‘niche market’ column didn’t fit into their plans.
Since the time that Casey Research was kind enough to offer me a stand-alone column, it became their most highly-rated blog almost from the outset—and has remained that way up to this date...