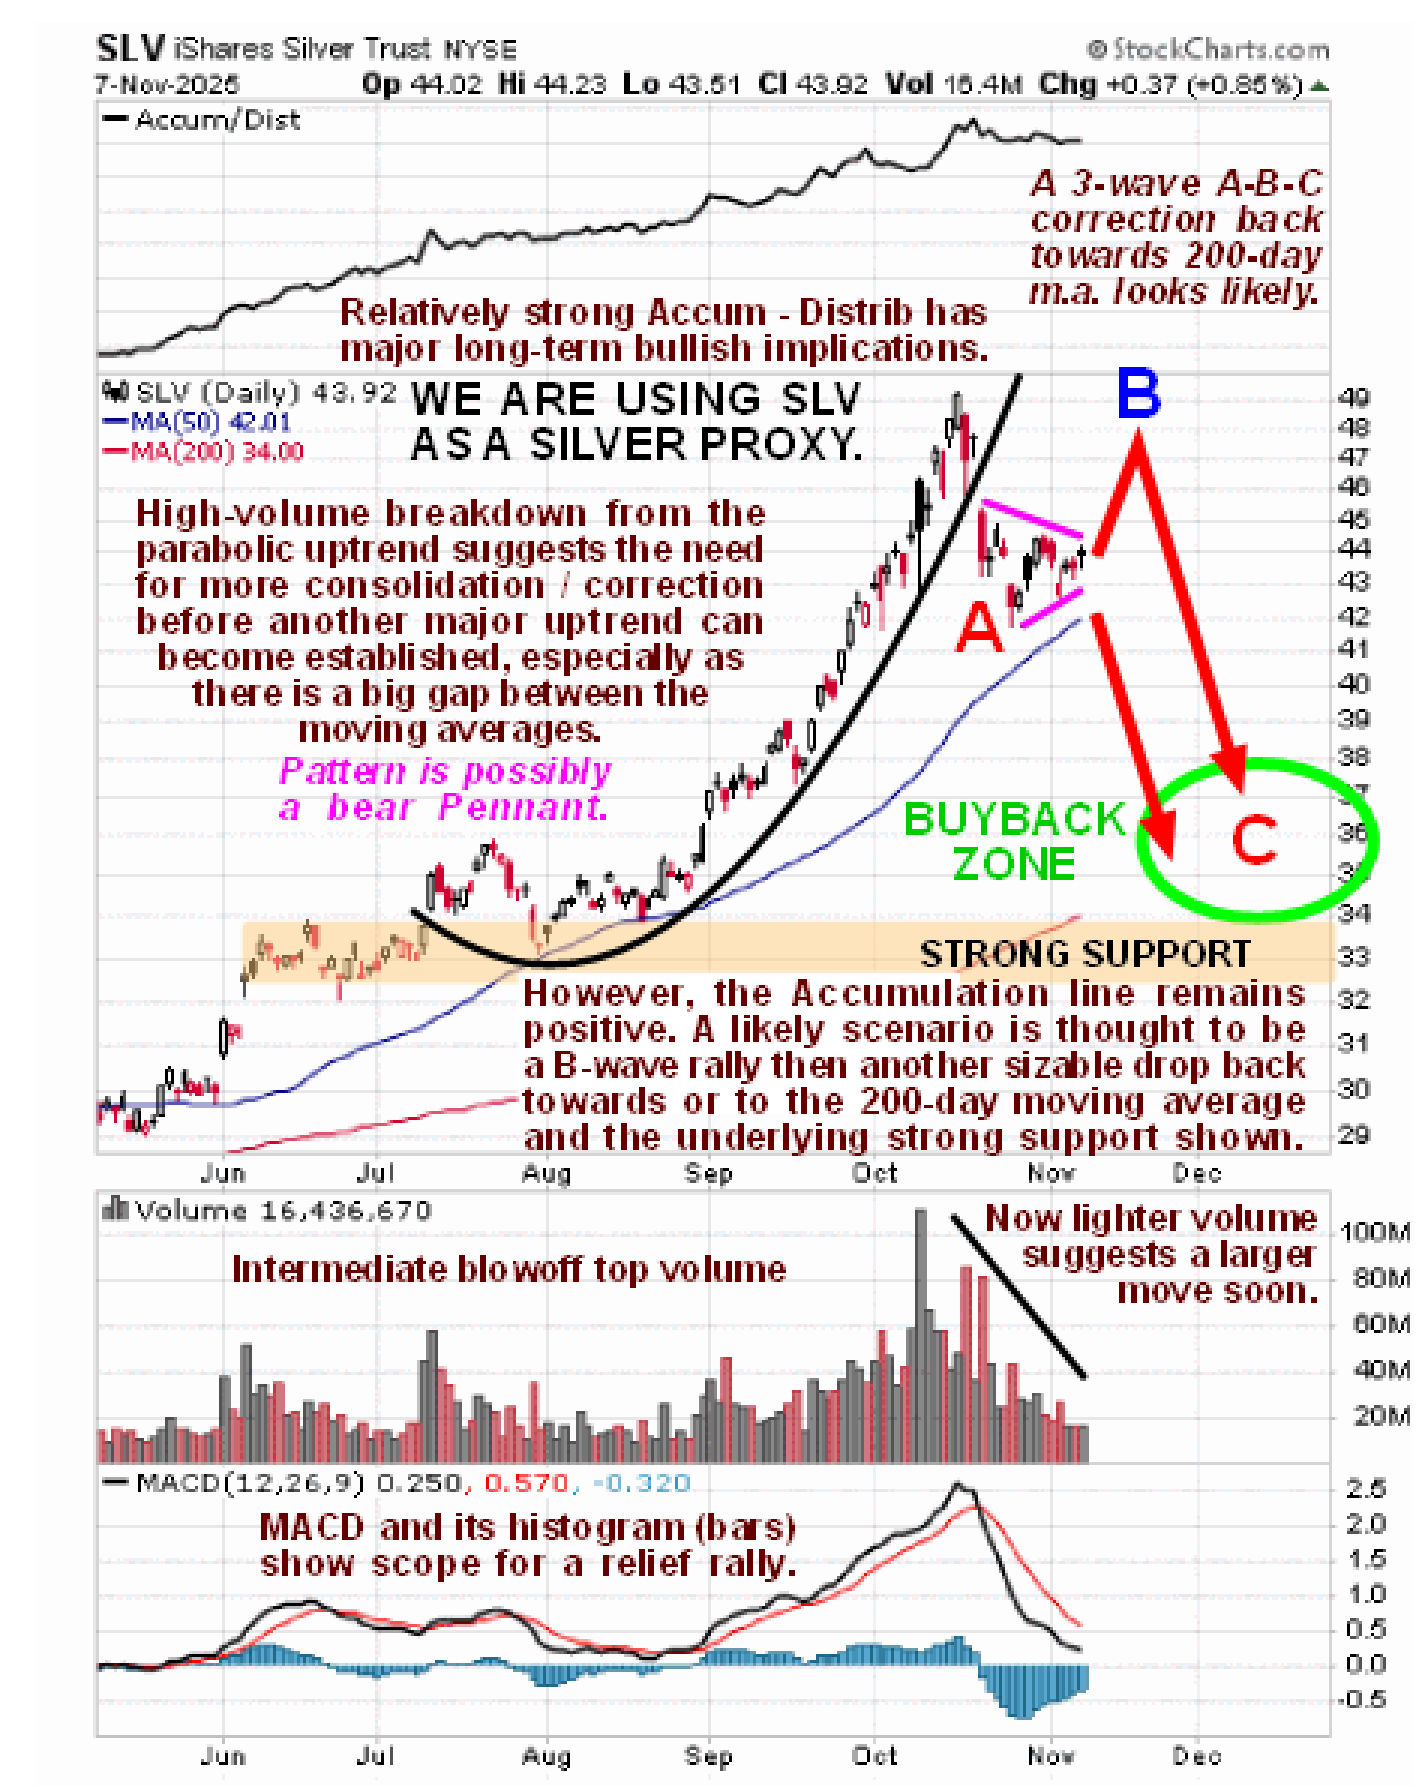
The Precious Metals sector has followed the script set out for it in the article posted on the site at the end of last month entitled PM SECTOR CORRECTION ROADMAP with SLV dropping back to $42.5 early this month as predicted before the expected B-wave countertrend rally started. However, the B-wave rally was somewhat larger than expected and the Accumulation lines of GLD, GDX and SLV have all shown strength relative to price, making new highs in the case of GDX and SLV, which is viewed as a bullish divergence which suggests that the C-wave of the corrective phase, which started this past Thursday, will probably be shallower than we earlier expected and could abort at any time, which we need to bear in mind. This is why we are “putting our best foot forward” and buying some stronger stocks even during the corrective phase. Here is the chart from the November 9th PM SECTOR OUTLOOK and we now know that it decided to do the B-wave…
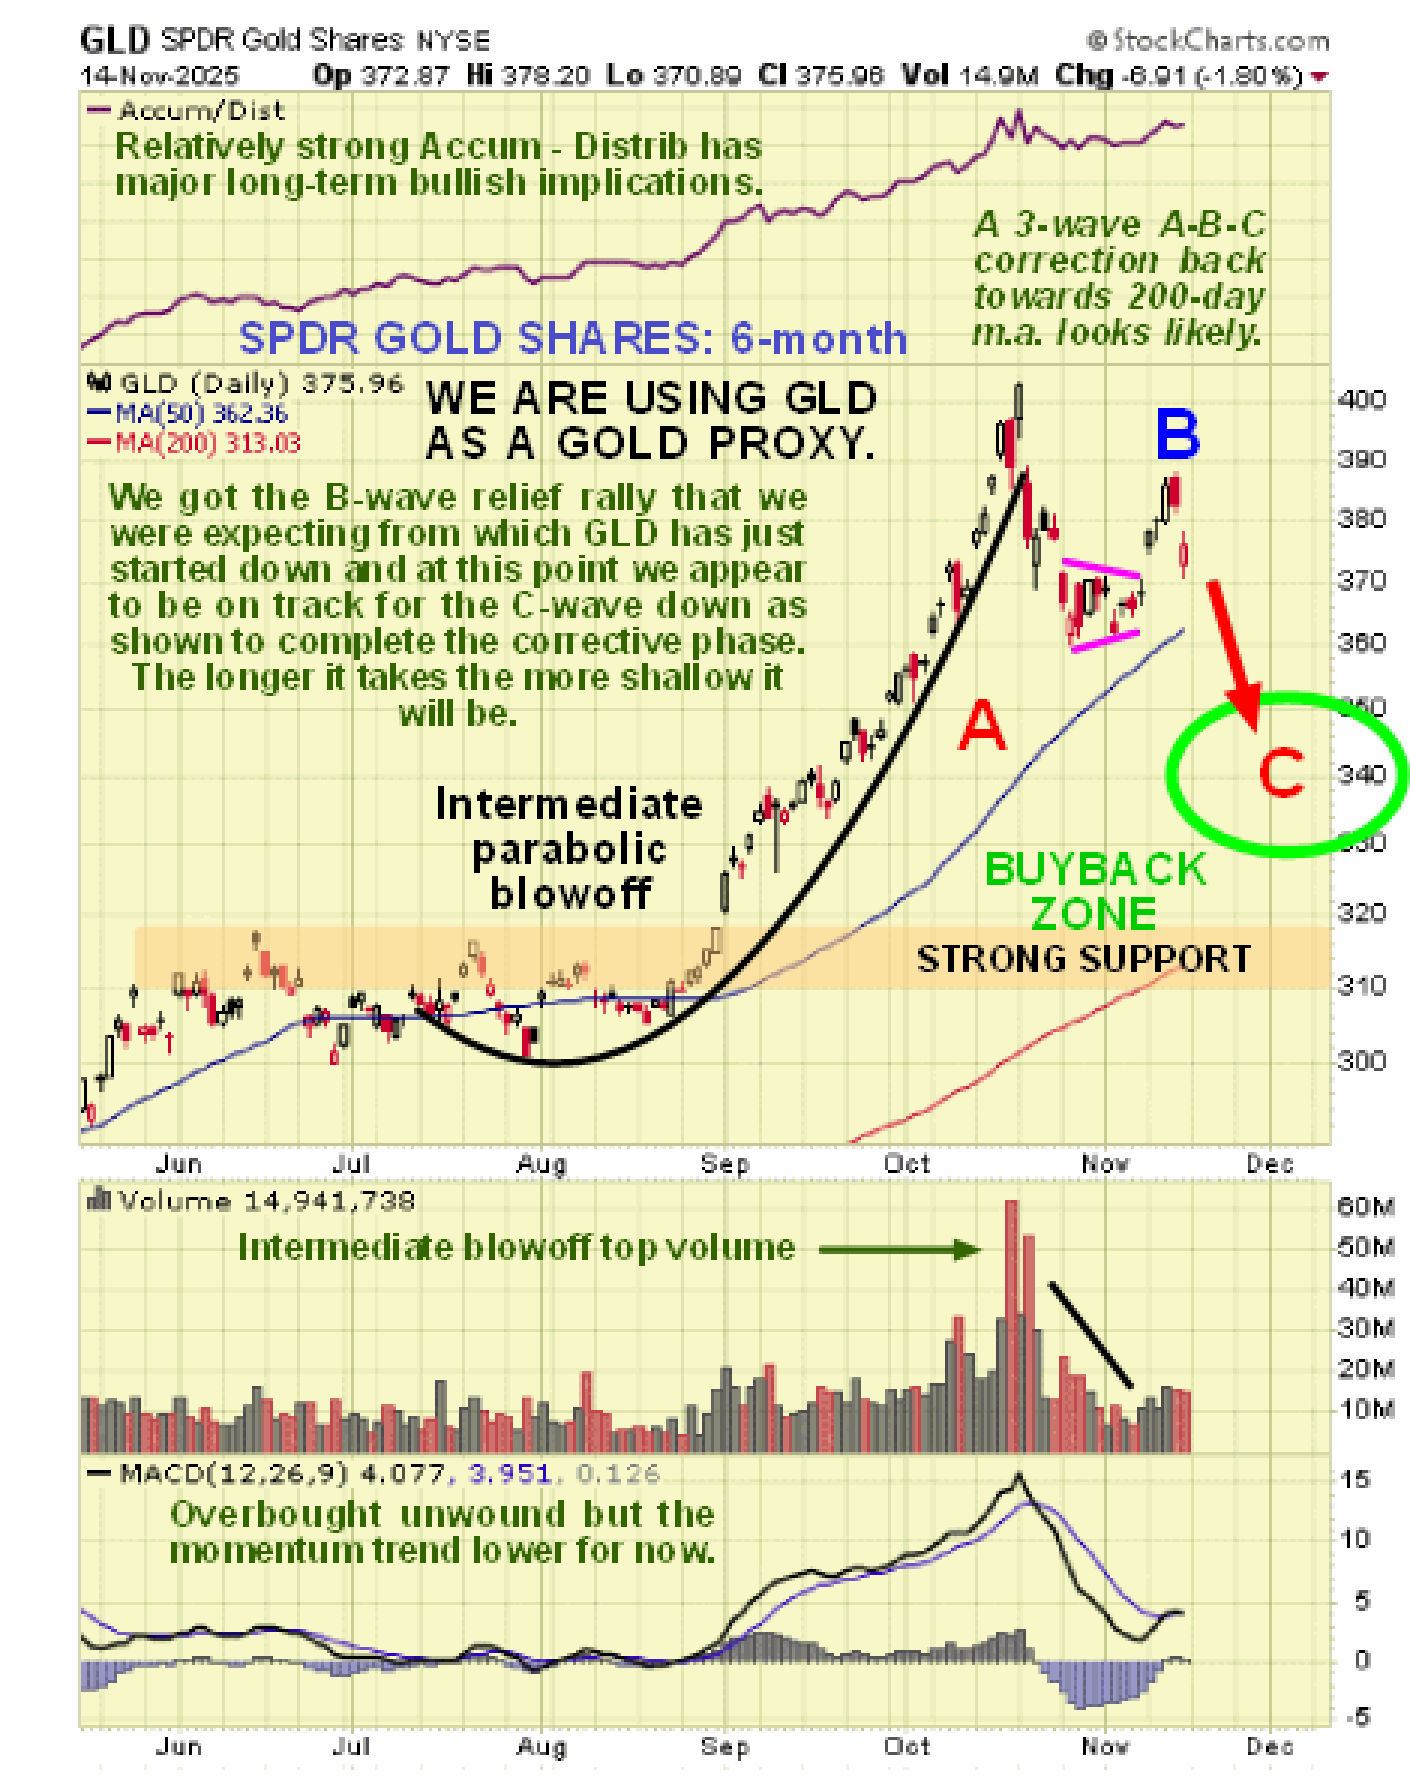
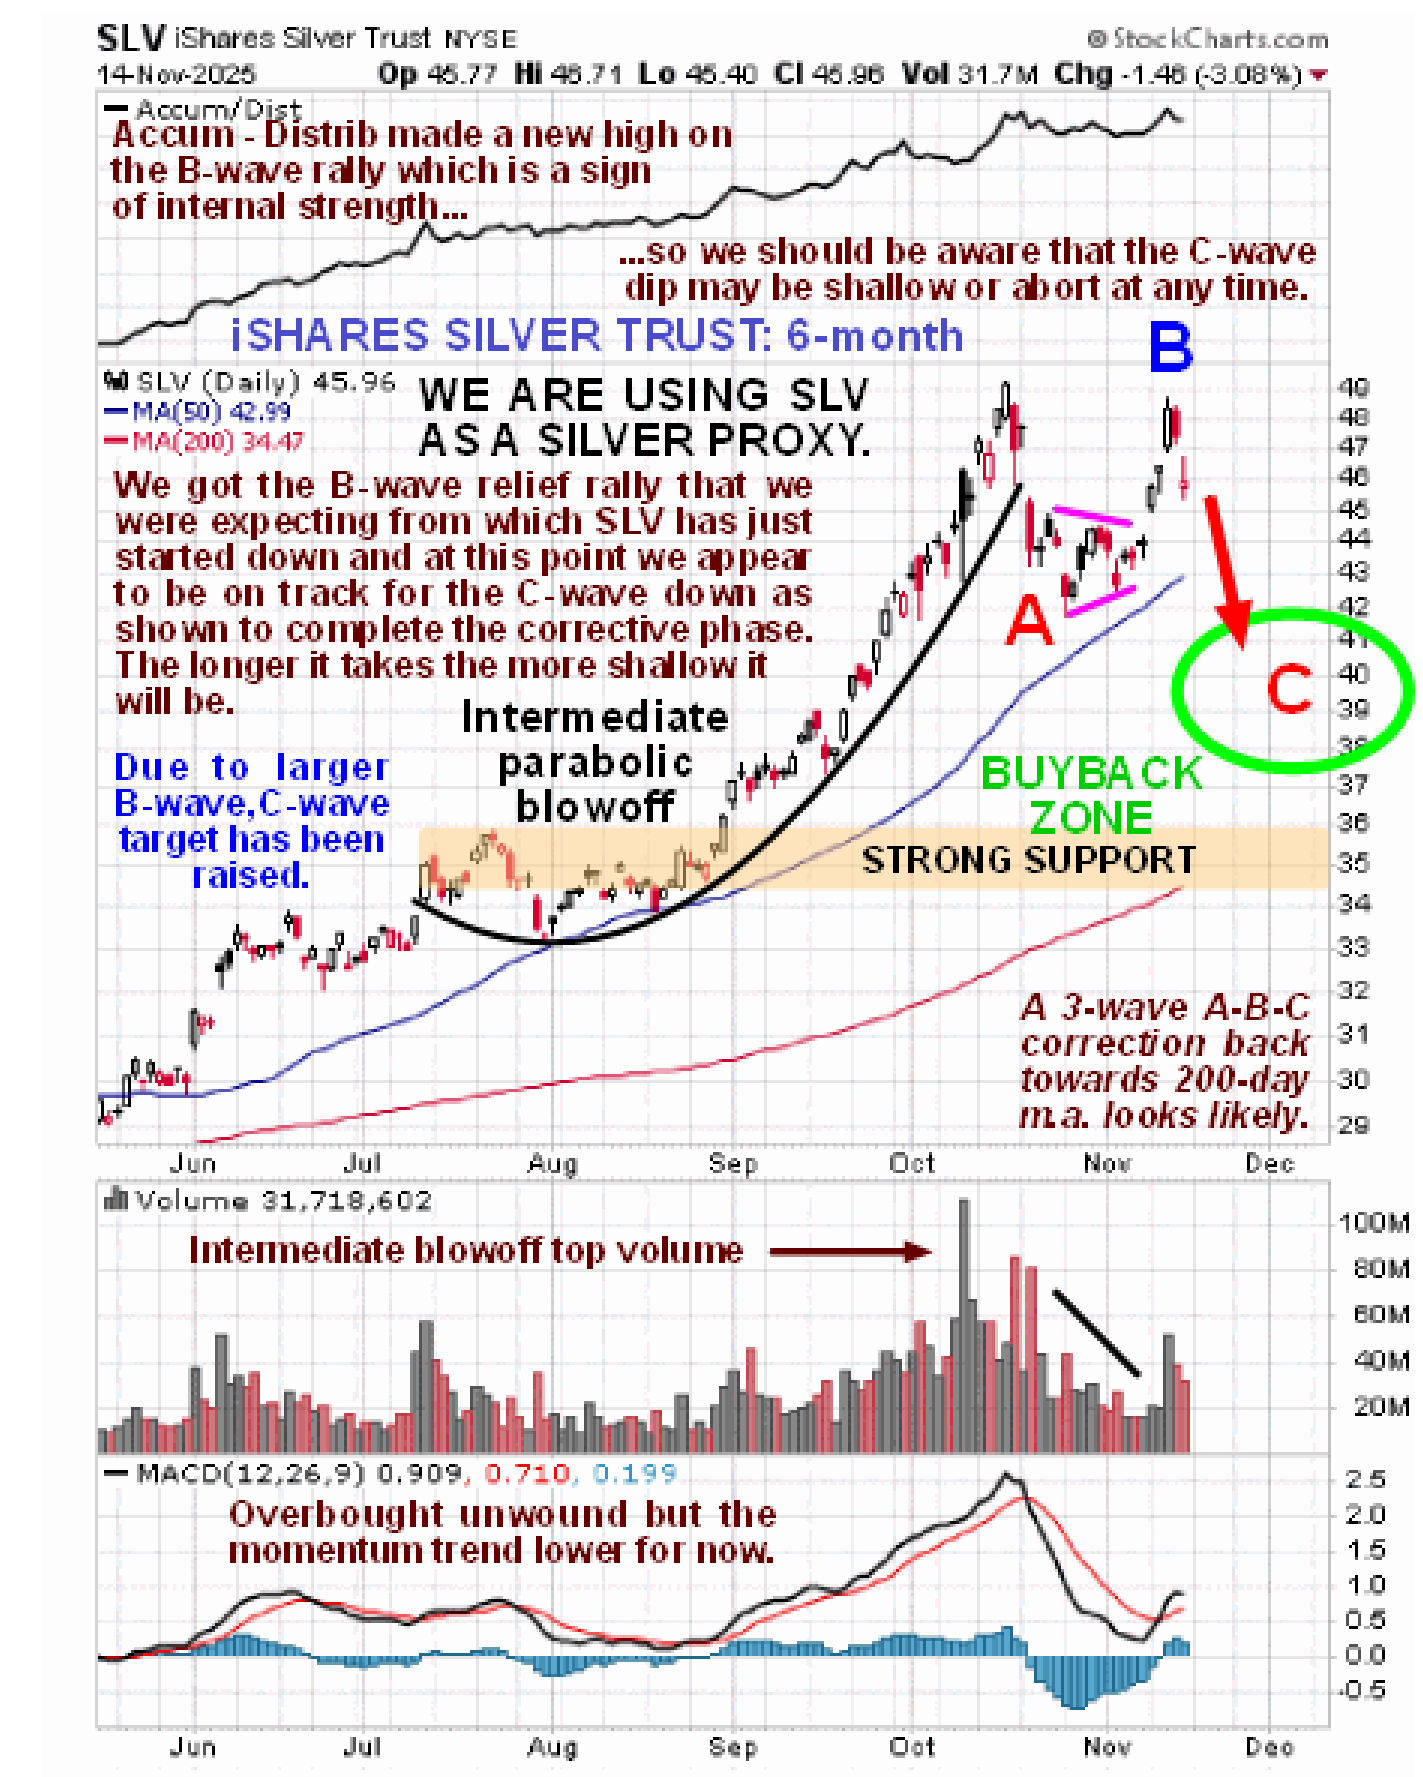
So now we will look at the latest 6-month charts for GDX, GLD and SLV which are all marking out the same wave pattern with SLV (and silver) showing notable strength – silver cam within a whisker of making news highs this past Thursday which is hardly surprising as silver has a lot of catching up to do relative to gold and is poised to embark on a major parabolic acceleration once its current corrective phase is done.
The following annotated charts do not require commentary…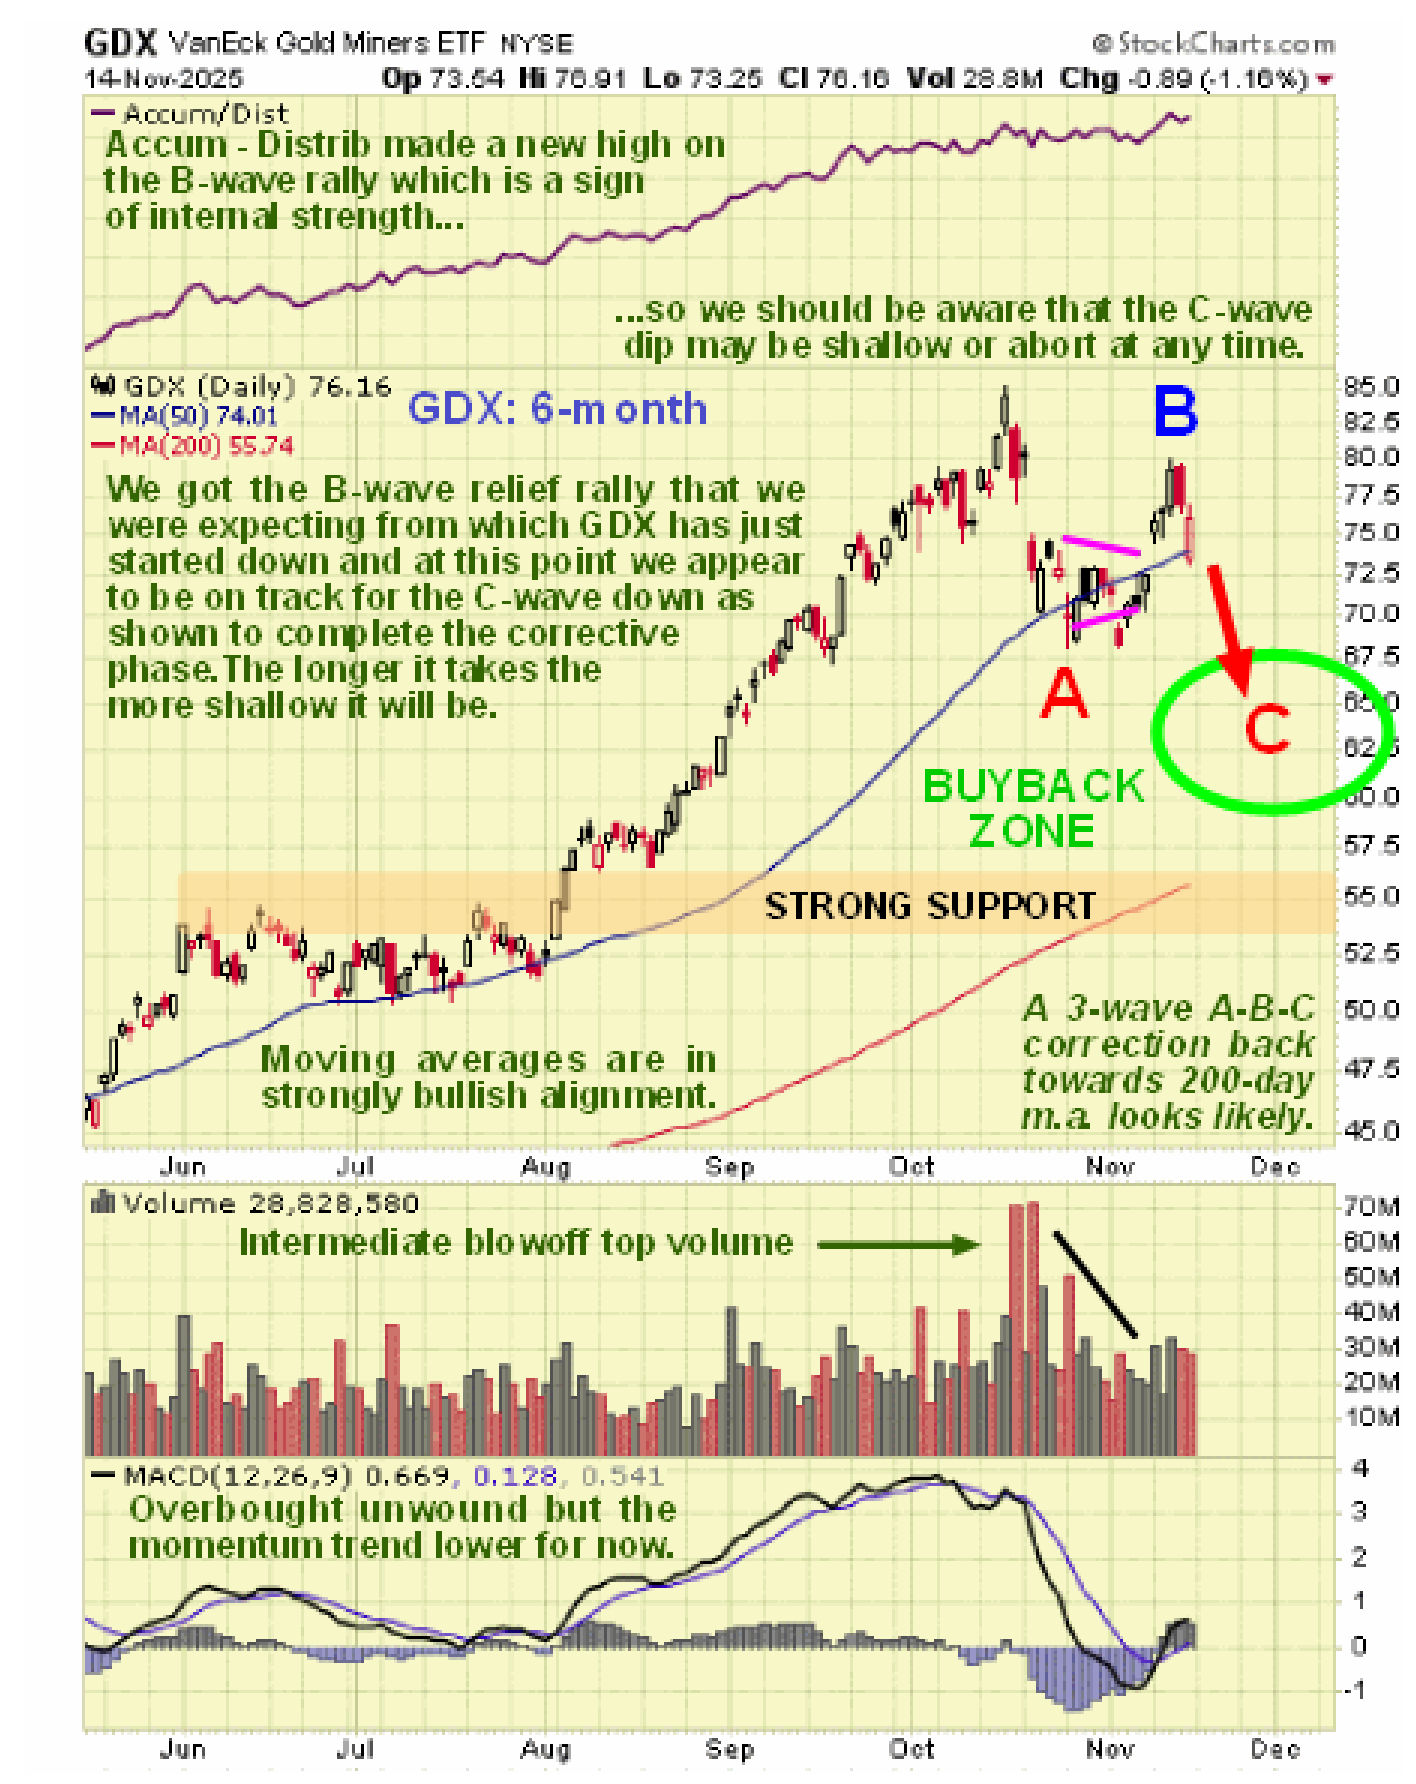
About the author