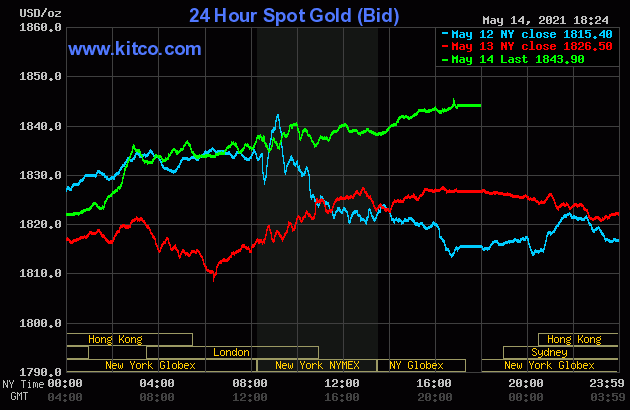
The gold price was sold quietly lower in morning trading in the Far East -- and the low tick of the day was set a few minutes after 11 a.m. China Standard Time on their Friday morning. From that point it rallied rather smartly until it ran into 'something' about five minutes before the London open. Then, after being sold a bit lower, it crept quietly and unevenly higher until the 10 a.m. EDT afternoon gold fix in London -- and then didn't do much until the 1:30 p.m. COMEX close in New York. It then crept a bit higher until trading ended at 5:00 p.m. EDT.
The low and high ticks in gold were recorded by the CME Group as $1,819.00 and $1,847.10 in the June contract. The June/August price spread differential at the close yesterday was $1.90...August/October was $1.80 -- and October/December was $2.10.
With these extremely tiny price spread differentials, the Big 4/8 shorts are doing everything in their power to get as many June gold contracts holder to roll, rather than stand for physical delivery next month.
Gold finished the Friday session in New York at $1,843.90 spot, up $17.40 from Thursday's close. Net volume was fairly decent at 196,000 contracts -- and there was a bit over 29,000 contracts worth of roll-over/switch volume out of June and into future months...mostly August and December.
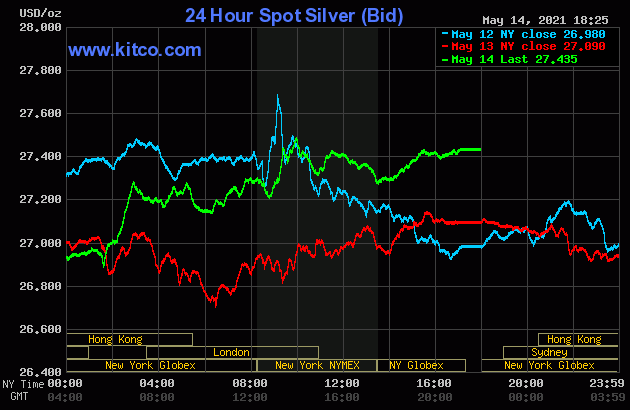
The silver price activity in Far East trading was about the same as it was for gold -- and its afternoon rally also ran into 'something' about five minutes before the London open. It was sold a bit lower until around 11:20 a.m. BST -- and then rallied nicely until the 10 a.m. EDT afternoon gold fix in London. It was sold a bit lower from that juncture until the COMEX close in New York -- and then like gold, crept higher in after-hours trading.
The low and high ticks in silver were reported as $26.92 and $27.595 in the July contract. The July/September price spread differential in silver at the close on Friday was only 2.5 cents...September/December was 3.8 cents -- and December/March was 4.4 cents.
Silver was closed in New York on Friday afternoon at $27.435 spot, up 34.5 cents on the day. Net volume was nothing special at a bit under 56,500 contracts -- and there was only about 2,830 contracts worth of roll-over/switch volume out of July and into future months...mostly September, with a bit into December.
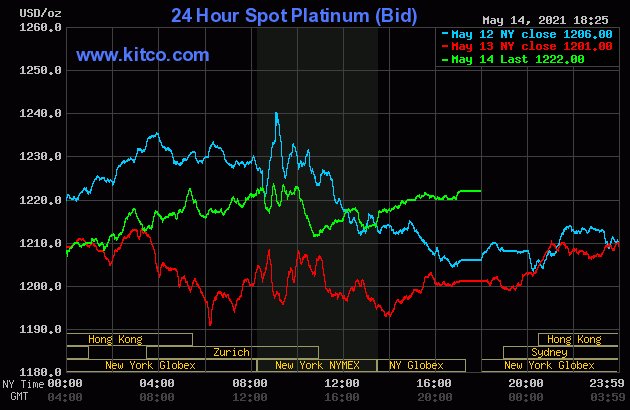
The platinum price rallied a bit in early morning trading in the Far East on their Friday morning -- and that ended at 9 a.m. China Standard Time. It crawled sideways from there until around 1:40 p.m. CST -- and then began to head unevenly higher. Like the silver and gold, it also got hit at the 10 a.m. EDT afternoon gold fix -- and that lasted until shortly before Zurich closed at 11 a.m. EDT. From that point it crawled quietly and somewhat unevenly higher until around 3:30 p.m. in after-hours trading -- and didn't do much after that. Platinum was closed at $1,222 spot, up 21 bucks on the day.
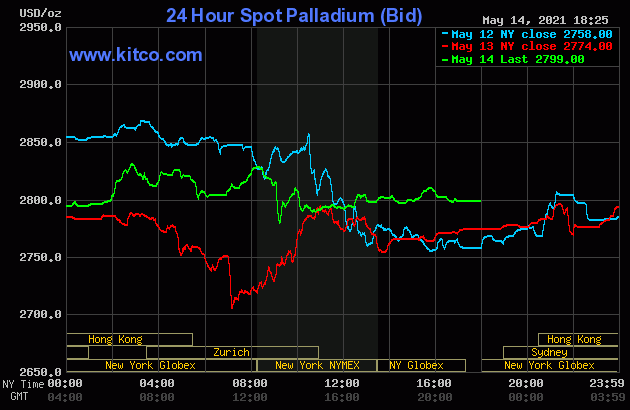
The palladium price worked its way unevenly higher until it also ran into 'something' about five minutes before the Zurich open. It had a quiet down/up move between then and the COMEX open in New York. It was sold lower at that point, recovered a bit in short order -- and then didn't do much for the remainder of the day. Palladium was closed at $2,799 spot, up 25 dollars from Thursday, but obviously some distance off its high tick -- and also back below $2,800 spot.
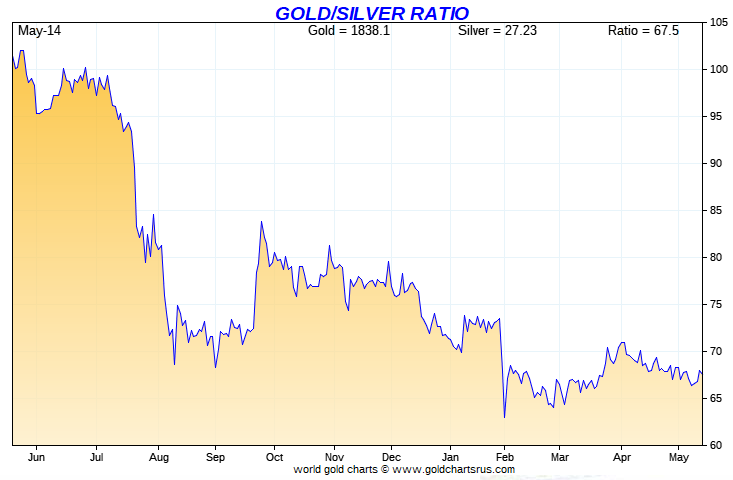
Based on the kitco.com-recorded spot closing prices in silver and gold posted above, the gold/silver ratio worked out to 67.2 to 1 on Friday...compared to 67.4 to 1 on Thursday.
And here's Nick Laird's 1-year Gold/Silver Ratio chart, updated with the last five trading days worth of data. Click to enlarge.
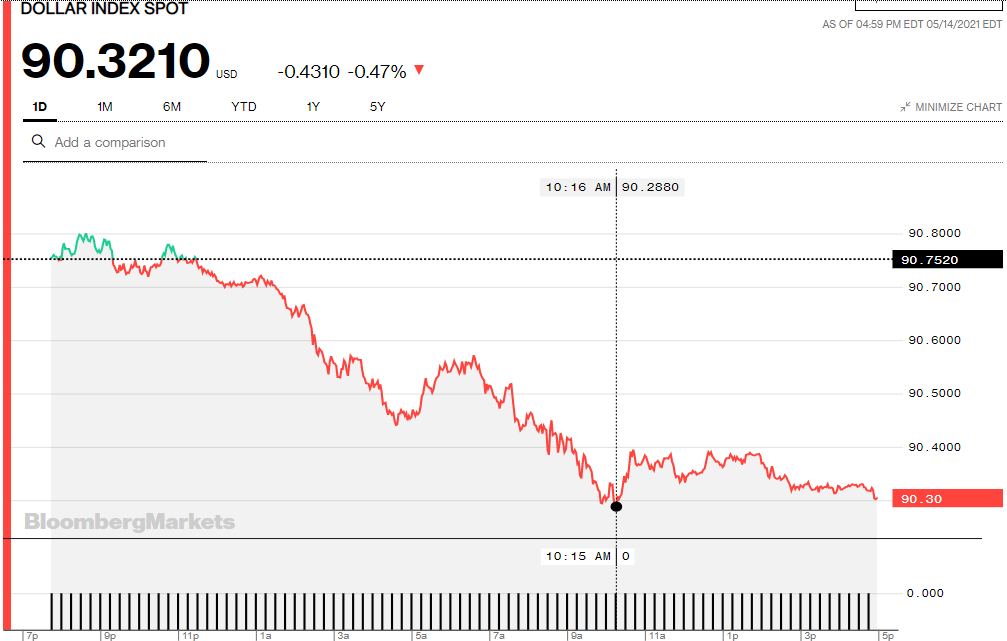
The dollar index closed very late on Thursday afternoon in New York at 90.752 -- and opened higher by less than half a basis point once trading commenced around 7:45 p.m. EDT on Thursday evening, which was 7:45 a.m. China Standard Time on their Friday morning. Its high tick of the day, such as it was, came about an hour later -- and its fall from grace began. The 90.28 low tick was set around 10:15 a.m. in New York -- and after a brief and tiny rally that lasted all of half an hour, it crept lower until the market closed at 5:00 p.m. EDT.
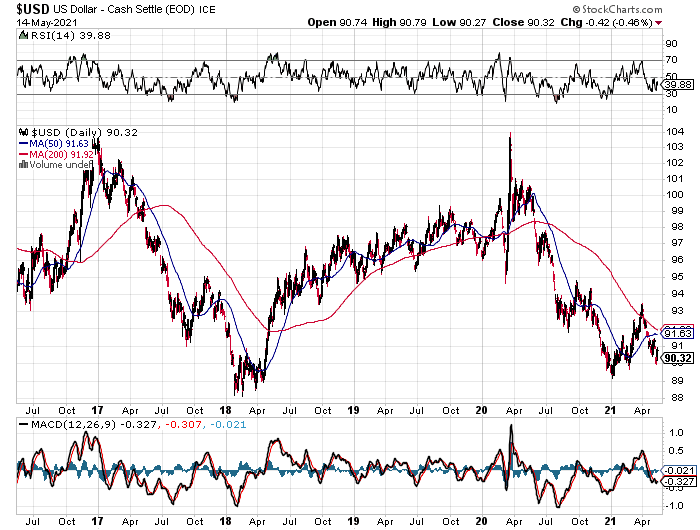
The dollar index finished the Friday session in New York at 90.321...down 43 basis points from its close on Thursday -- and a couple of basis points higher than its indicated spot close on the DXY chart below.
Here's the DXY chart for Friday, courtesy of Bloomberg as always. Click to enlarge.
And here's the 5-year U.S. dollar index chart that appears in this spot in every Saturday column, thanks to stockcharts.com as usual -- and it doesn't look all that healthy, does it? The delta between its close...90.32...and the close on the DXY chart above, was well under 1 basis point on Friday. Click to enlarge as well.
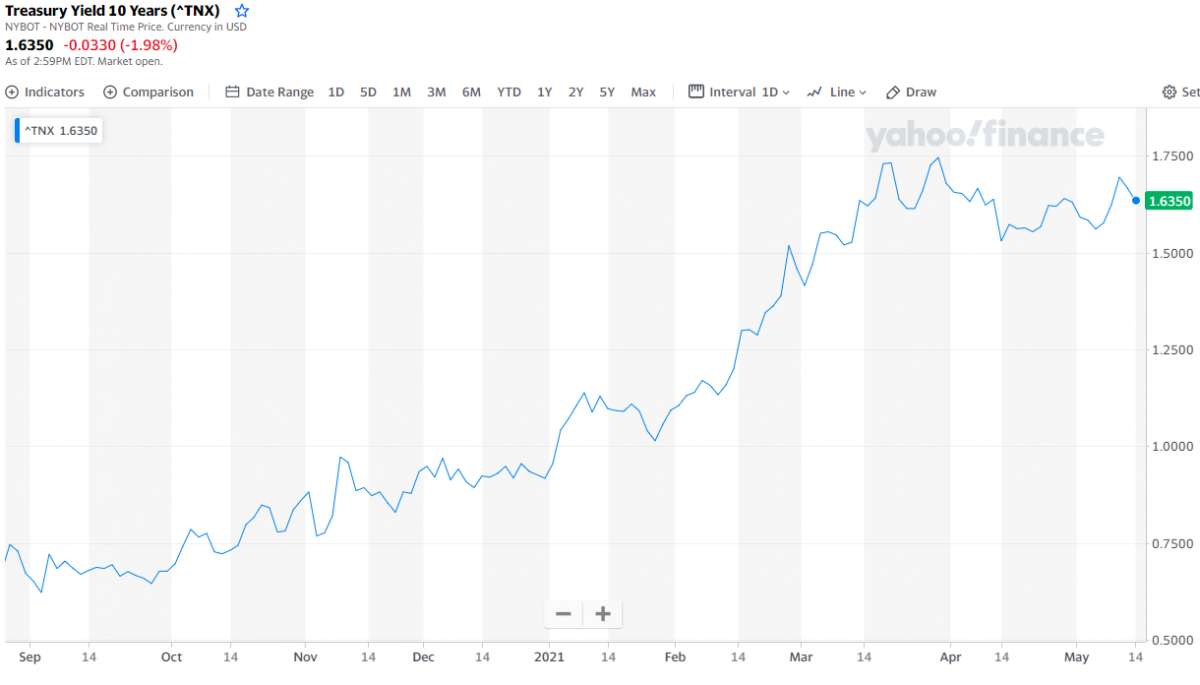
U.S. 10-Year Treasury: 1.6350%...down 0.0330 (-1.98%)...as of 2:59 p.m. EDT.
Here's the 1-year U.S. 10-year treasury chart, thanks to the finance.yahoo.com Internet site -- and as I've pointed out every week for the last month, you can see where the Fed's yield curve control program obviously kicked in, in March. Click to enlarge.
![]()
The gold stocks gapped up at the open, then sold off a bit until minutes before 11 a.m. in New York trading -- and from that point rallied quietly higher until the market closed at 4:00 p.m. EDT. The HUI finished just off its high tick of the day, up a respectable 3.08 percent.
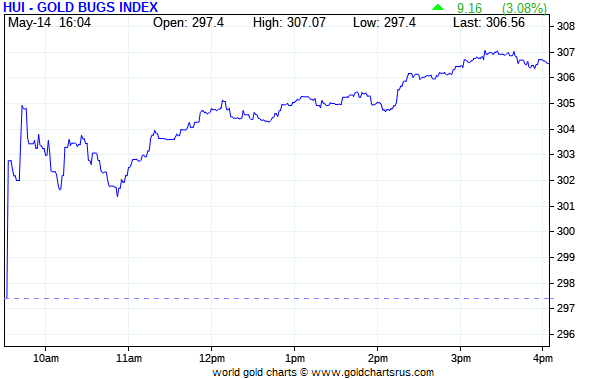
For the second day in a row, Nick Laird's Intraday Silver Sentiment/Silver 7 Index is missing in action, as it flat-lined all day long -- and I'm not sure, or is Nick, when it will be back, because he's having a feed issue with the yahoo.com Internet site from which it is calculated.
But computed manually, the above Index closed higher by 3.79 percent, held back by Peñoles.
But here's his 1-year Silver Sentiment/Silver 7 Index chart, updated with Friday's candle -- and there's nothing wrong with this chart. Click to enlarge.
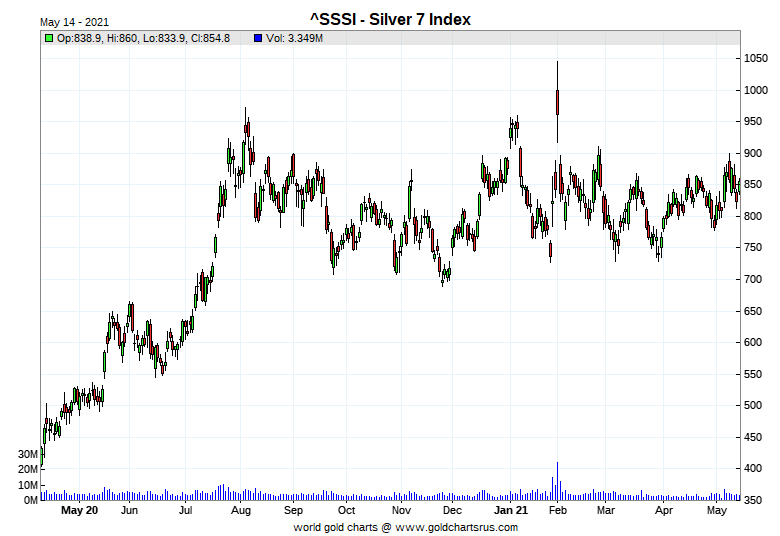
The two stars of the day were Coeur and Hecla Mining, as they closed higher by 6.05 and 6.03 percent respectively -- and the underperformer was the aforesaid mentioned Peñoles, as it only closed up 0.22 percent...but only on 355 shares traded.
Moments after I posted today's missive on the website, U.K. reader Nigel McHale sent me the latest link showing what the reddit.com/Wallstreetsilver crowd were up to -- and that's linked here. In the first photo, I was amazed to see that that some very imaginative bullion dealer was selling COMEX good delivery silver bars by the slice! You couldn't make this stuff up!!!
![]()
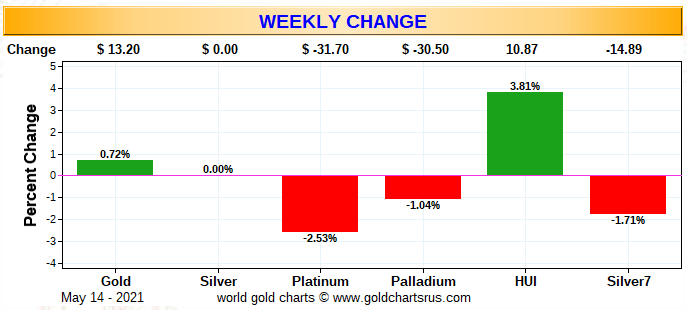
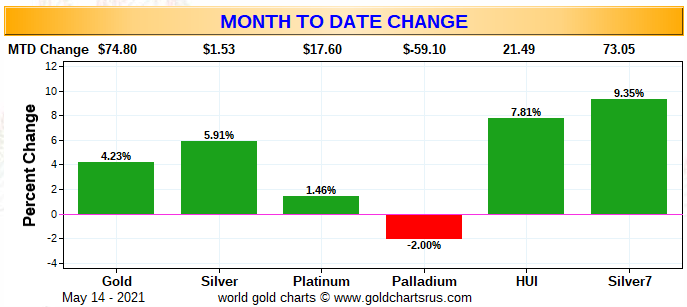
Here are the three charts that shows up in every Saturday missive. They show the changes in gold, silver, platinum and palladium in both percent and dollar and cents terms, as of their Friday closes in New York — along with the changes in the HUI and the Silver 7 Index.
Here's the weekly chart -- and only gold and its associated equities were up on the week. Some of the underperformance in the silver equities this week involved the big hit that Pan American Silver took during the week, along with the continued underperformance of Peñoles. Click to enlarge.
Here's the month-to-date chart -- and it's a lot happier looking. Month-to-date, the last two week, everything silver related has done better, but not by a material amount -- and palladium is only down because the Big 4/8 traders have been engineering its price lower over that time period. Click to enlarge.
And here's the year-to-date chart. As I've been saying for weeks if not months already, it would only take one or two very decent rally days in the precious metals themselves, to pop their associated equities back into the green by a decent amount year-to-date...particularly the silver stocks. Those days are fast approaching. Click to enlarge.
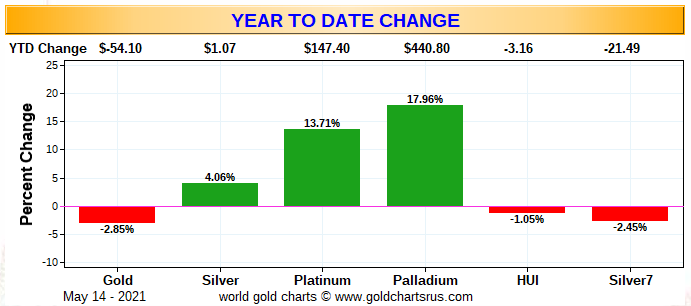
As I said last week in this spot -- and the week before that, when you consider how badly that the Big 4/8 traders have beaten up silver and gold prices year-to-date, their underlying equities have done well for themselves -- and as I've also been contending for many many months now, I have a sense of stealth buying underneath the precious metals equity complex by the strongest of hands.
And as Ted Butler has pointed out on many occasions, the short positions of the Big 8 traders in general -- and the Big 4 short commercial traders in particular, are the sole reason that precious metal prices aren't at the moon already, as virtually every other group of traders in the COMEX futures market are net long against them in all four precious metals...including almost all the rest of the traders in their respective commercial categories.
In the COT discussion further down, the Big 4 traders increased their short positions in both gold and silver, but not by alarming amounts, as a lot of the so-called 'deterioration' was a result of the smaller commercial traders other than the Big 8, selling long positions.
The CME Daily Delivery Report showed that 25 gold and 170 silver contracts were posted for delivery within the COMEX-approved depositories on Tuesday.
In gold, the sole short/issuer was RBC Capital Markets out of its client account -- and the largest of the three long/stoppers was BofA Securities, as they picked up 21 contracts for their own account.
In silver, the only one of the short/issuers that mattered was JPMorgan, with 169 contracts out of its client account -- and, of course, they were the largest long/stoppers, picking up 91 contracts for their client account as well. Morgan Stanley was in second place once again, stopping 35 contracts in total...5 for its house account -- and the other 30 for clients. In third and fourth spots were Scotia Capital/Scotiabank and BofA Securities, picking up 24 and 14 contracts for their respective in-house/proprietary trading accounts...which is a fancy way of saying they stopped them for their own accounts.
The link to yesterday's Issuers and Stoppers Report is here.
So far in May, there have been 1,492 gold contracts issued/reissued and stopped -- and that number in silver is 7,069 contracts. In platinum, there were only 3 contracts issued and stopped -- and nothing in palladium.
The CME Preliminary Report for the Friday trading session showed that gold open interest in May fell by 42 contracts, leaving 92 still around, minus the 25 contracts mentioned a few paragraphs ago. Thursday's Daily Delivery Report showed that 73 gold contracts are actually posted for delivery on Monday, so that means that 73-42=31 more gold contracts were added to May. Silver o.i. in May fell by 186 contracts, leaving 430 still open, minus the 170 contracts mentioned a few paragraphs ago. Thursday's Daily Delivery Report showed that 186 silver contracts are actually posted for delivery on Monday, so that means that the change in open interest and deliveries match for once...which is unusual for such a large number of contracts.
Total gold open interest at the close on Friday rose by 9,539 COMEX contracts yesterday -- and in my phone call with Ted on Friday, he said that it was most likely that these big increases in open interest we've been witnessing for the last few days has been mostly spread related. Total silver o.i. rose by only 412 contracts, which I was very happy to see.
There was a decent-size deposit into GLD yesterday, as an authorized participant added 131,106 troy ounces of gold -- and there were no reported changes in SLV.
In other gold and silver ETFs and mutual funds on Planet Earth on Friday, net of any changes in COMEX, GLD & SLV inventories, there was a net 107,859 troy ounces of gold added...all of which, plus a bit more, ended up at Deutsche Bank. There was a net 1,420,055 troy ounces of silver added as well...946,731 troy ounces into Deutsche Bank -- and 500,220 troy ounces went into Sprott's PSLV.
And, once again, there was no sales report from the U.S. Mint.
It has been five weeks since they reported any silver eagle sales -- and over three weeks since they reported selling any gold eagles/buffaloes. And as I've stated before, there's something terribly wrong with this picture -- and as I've also mentioned before in this space, one has to wonder if they've stopped producing them in order not to exacerbate the already critical short supply of physical gold and silver...especially the latter.
There was very little activity in gold over at the COMEX-approved depositories on the U.S. east coast on Thursday. Only 589 troy ounces was reported received -- and that ended up at Brink's, Inc. There was 7,912 troy ounces shipped out.
In the 'out' category, the largest amount was the 7,812.693 troy ounces/243 kilobars [SGE kilobar weight] that departed Manfra, Tordella & Brookes, Inc. -- and the remaining 100 troy ounces/one good delivery bar, was shipped out of Brink's, Inc. The link to all this gold activity is here.
As always, it was far busier in silver, as 691,075 troy ounces was received -- and 1,658,925 troy ounces was shipped out.
In the 'in' category, the largest amount...587,760 troy ounces/one truckload...arrived at JPMorgan -- and the remaining 103,315 troy ounces ended up at Delaware.
In the 'out' category, there were two truckloads...1,226,880 troy ounces...that departed Manfra, Tordella & Brookes, Inc. Next was the 303,427 troy ounces that left the JPMorgan depository...followed by the 123,652 troy ounces that was shipped out of CNT. The remaining 4,964 troy ounces/one COMEX contract, left Delaware.
There was a lot of paper activity as well. The largest amount was the 577,432 troy ounces/one truckload, that was transferred from the Eligible category and into Registered...no doubt scheduled for delivery in May at some point. The rest of the paper activity involved transfers from the Registered category and back into Eligible...281,827 troy ounces at the International Depository Services of Delaware -- and the remaining 9,726 troy ounces made that same trip over at Brink's, Inc.
As Ted Butler points out continually, this frantic in/out movement in COMEX silver inventories continues unabated...as it has done since JPMorgan opened their silver depository the week before the drive-by shooting on May 1, 2011.
The link to 'all of the above' silver activity is here.
There wasn't a lot of activity over at the COMEX-approved gold kilobar depositories in Hong Kong on their Thursday. Nothing was reported received -- and only 189 kilobars were shipped out...139 from Loomis International...with the remaining 50 kilobars departing Brink's, Inc. The link to this gold activity, in troy ounces, is here.
![]()
Here are the usual two 20-year charts that show up in this space almost every Saturday. They show the total amount of physical gold and silver in all know depositories, ETFs and mutual funds as of the close of business on Friday.
For the week just past, there was a net 359,000 troy ounces of gold added -- and in silver, there was only a net 213,000 troy ounces added. The reason that the silver number is as low as it is, is because of the net withdrawals from the COMEX and SLV during the reporting week. If you take those numbers out, there was a net 2,602,052 troy ounces of silver added...so the net number that Nick shows is deceiving. Click to enlarge for both.
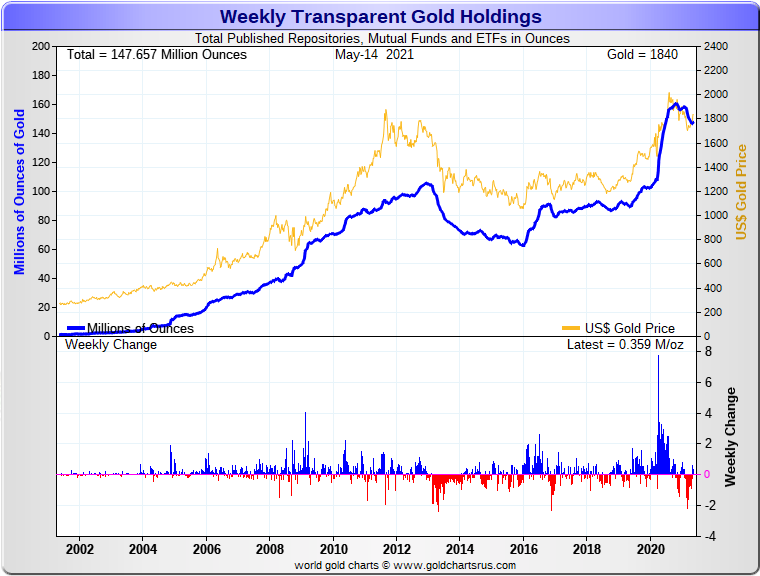
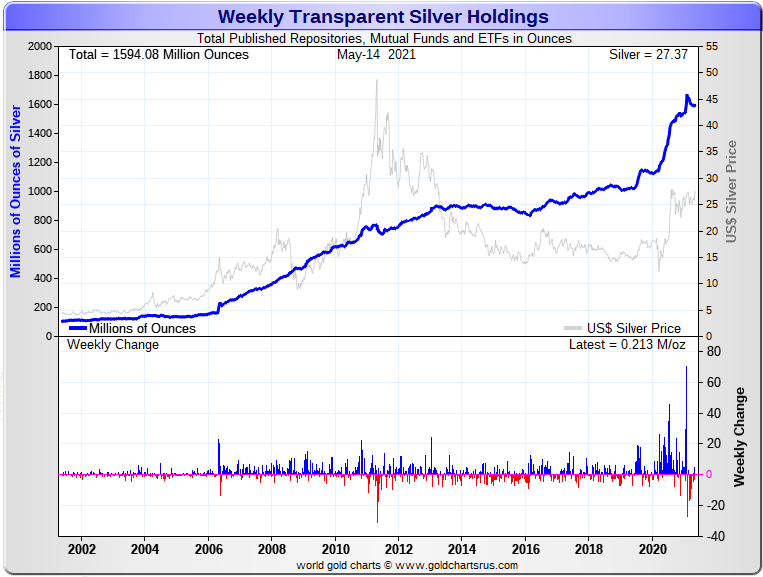
At long last the bleeding has stopped in gold -- and should continue to improve as time goes along. In silver, except for net COMEX withdrawals, most of the withdrawals from SLV are conversions of shares for physical metal...aren't really withdrawals at all. For those two reasons, it's always been onwards and every upwards in the silver ETFs and mutual funds, regardless of the long engineered price decline that began last August.
![]()
The Commitment of Traders Report, for positions held at the close of COMEX trading on Tuesday, showed the expected increases in the commercial net short positions in both silver and gold -- and were certainly in line with what Ted was expecting. The Big 4/8 shorts did add to their short positions as well, but a lot that increase was long selling by Ted's raptors, the small commercial traders other than the Big 8.
In silver, the Commercial net short position increased by 4,730 COMEX contracts, or 23.7 million troy ounces.
They arrived at that number by increasing their long position by 1,341 contracts, but also increased their short position by 6,071 contracts -- and it's the difference between those two numbers that represents their change for the reporting week.
Under the hood in the Disaggregated COT Report it was mostly Managed Money traders on the buy/long side, as they increased their net long position by 3,937 contracts -- and the rest of the buying was in the Other Reportables category, as they increased their net long position by 1,039 contracts. The Nonreportable/small traders decreased their net long position by a small amount...246 contracts.
Doing the math: 3,937 plus 1,039 minus 246 equals 4,730 COMEX contracts, the change in the Commercial net short position.
The Commercial net short position in silver now stands at 366.4 million troy ounces, up from the 342.7 million troy ounces they were short in last week's COT Report.
The Big 8 traders are short 390.4 million troy ounces, which is up 14.5 million troy ounces from the 375.9 million troy ounces that they were short in last week's COT Report. An increase, yes, but Ted was happy with that number because he was dreading it would be far bigger.
Since the Commercial net short position increased by 23.7 million troy ounces -- and the Big 8 shorts only increased their short position by 14.5 million ounce, the difference was made up by Ted's raptors, the small commercial traders other than the Big 8, who are all net long in the COMEX futures market in silver, as they sold long positions to make up the difference -- and I'll have all of that data in the 'Days to Cover' discussion further down.
And as I've pointed out before, the raptor/small commercial trader selling of long positions has the mathematical effect of increasing the Commercial net short position...which isn't a negative in the grand scheme of things.
The short position of the Big 8 traders is larger than the Commercial net short position by about 107 percent, down a bit from the 110 percent they were short in last week's COT Report.
Ted says that JPMorgan didn't do anything during the reporting week -- and are totally out of the silver market from a COMEX futures perspective -- and have been for over a year.
Here's the 3-year COT chart for silver, courtesy of Nick Laird, as always -- and the weekly change should be noted. Click to enlarge.
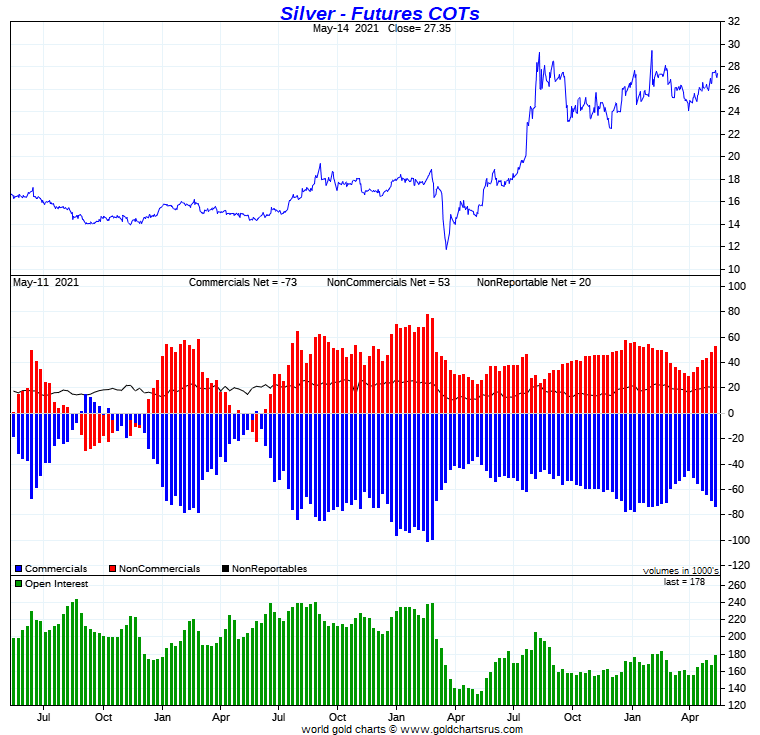
Ted said that the Commercial net short position in silver is now back to its highs of February, so from a futures market perspective, the Big 4/8 shorts could certainly engineer the silver price lower if they so desired.
But he also pointed out that the short position of the Big 4/8 traders is now much smaller than it was back at that old high, so whether another price 'correction' in silver is in the cards, is not known.
But in the real world of physical metal, the market just screams tightness at both the wholesale and retail level. At some point the physical market will trump the paper market -- and then what day comes, what the COT Report shows, won't matter.
In gold, the commercial net short position increased by 25,161 COMEX contracts, or 2.52 million troy ounces.
They arrived at that number by increasing their long position by 7,790 contracts, but also increased their short position by 32,951 contracts -- and it's the difference between those two numbers that represents their change for the reporting week.
Under the hood in the Disaggregated COT Report it was all Managed Money traders, plus a bit more, as they increased their net long position by 27,990 contracts. The Nonreportable/small traders also increased their net long position, them by 3,647 contracts. And, for whatever reason, the Other Reportables decreased their net long position by a hefty 6,476 contracts.
Doing the math: 27,990 plus 3,647 minus 6,476 equals 25,161 COMEX contracts, the change in the commercial net short position...which it must do.
The commercial net short position in gold now sits at 22.71 million troy ounces, which is up from the 20.19 million troy ounces they were short in last week's COT Report.
The Big 8 traders are short 21.64 million troy ounces of gold in this week's COT Report, compared to the 20.51 million troy ounces they were short in last week's COT Report.
And, like in silver, Ted's raptors, the smaller commercial traders other than the Big 8, were big sellers of long positions [for big profits] during the reporting week -- and as a matter of fact, it was their selling that made up more than fifty percent of the change in the commercial net short position.
The Big 8 are short about 95 percent of the commercial net short position in silver, down from 102 percent that they were short in last week's COT Report -- and that big drop is because of the big long selling by the smaller commercial traders during the reporting week.
Ted said that JPMorgan might have sold a couple of thousand of contracts of their long position in gold -- and if that was the case, their long position in gold is now down to around 4,000 COMEX contracts. Like in silver, they're basically non-participants in the COMEX futures market in gold now -- and have been for about thirteen months.
Here's Nick Laird's 3-year COT chart for gold, updated with Friday's data -- and this week's change should be noted. Click to enlarge.
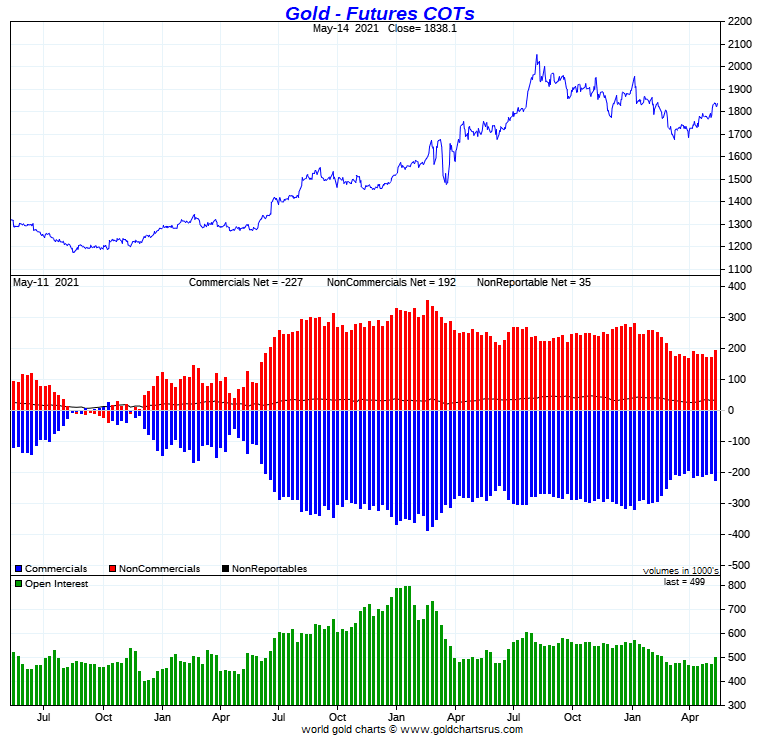
Although the Big 8 traders did go further on the short side during the reporting week, it wasn't very much, as it was mostly the smaller commercial traders selling longs that made for the increase in the commercial net short position during the reporting week.
So, based on that, the COMEX futures market in gold is still extremely bullish -- and far more bullish than it is in silver. So the path of least resistance for gold is still higher, although the odd set-back, courtesy of the Big 4/8 traders, is to be expected along the way.
And there certainly has been some improvement in the market structure since the Tuesday cut-off, particularly in silver. But there are still two more reporting days to go -- and anything can happen between now and then.
In the other metals, the Managed Money traders in palladium decreased their net long position by 340 COMEX contracts during the last reporting week -- but are still net long the palladium market by 4,094 COMEX contracts...around 34 percent of the total open interest...down about 3 percentage points from last week. And as I continue to point out for what seems like forever now, the COMEX futures market in palladium continues to be a market in name only, as its price is mostly set in the spot market. In platinum, the Managed Money traders decreased their net long position by a further and insignificant 672 contracts -- and are net long the platinum market by 18,799 COMEX contracts...about 28 percent of total open interest -- down about 2 percentage points from last week. In copper, the Managed Money traders decreased their net long position by 4,908 COMEX contracts -- and are net long copper to the tune of 60,207 COMEX contracts...about 1.51 billion pounds of the stuff -- and about 23 percent of total open interest...down about 2 percentage point from last week.
![]()
Here’s Nick Laird’s “Days to Cover” chart, updated with the COT data for positions held at the close of COMEX trading on Tuesday, May 11. It shows the days of world production that it would take to cover the short positions of the Big 4 — and Big '5 through 8' traders in each physically traded commodity on the COMEX.
I consider this to be the most important chart that shows up in every Saturday column -- and it deserves a minute of your time. Click to enlarge.
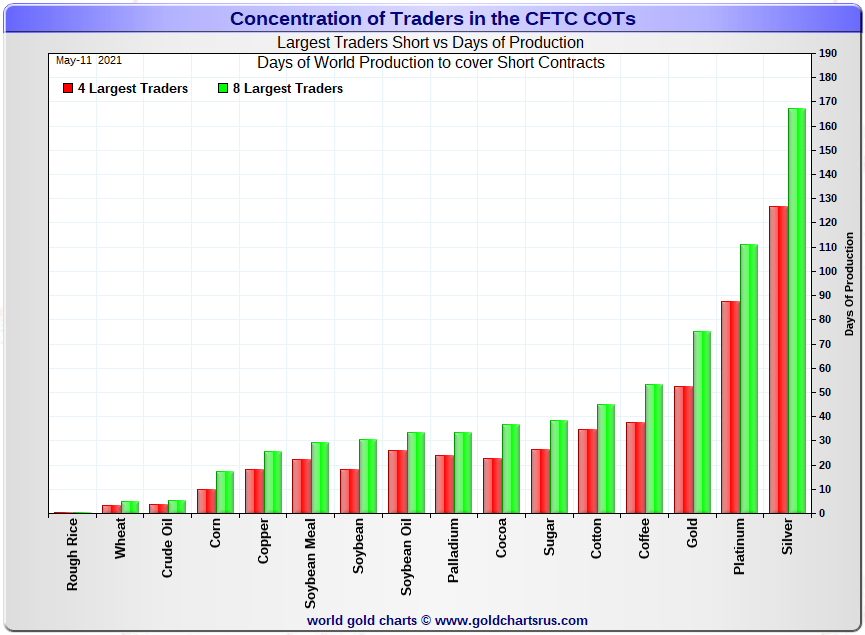
The Big 4 traders are short about 127 days of world silver production, up about 5 days from the prior week's report. The ‘5 through 8’ large traders are short an additional 40 days of world silver production...up about 1 day from the prior COT Report for a total of about 167 days that the Big 8 are short...up 6 days from last week's COT report. [In the prior reporting period they were short 161 days of world silver production.]
This represents a bit over five and a half months of world silver production, or about 389 million troy ounces of paper silver held short by the Big 8.
In the COT Report above, the Commercial net short position in silver was reported by the CME Group at 366 million troy ounces. As mentioned in the previous paragraph, the short position of the Big 4/8 traders is around 389 million troy ounces. So the short position of the Big 4/8 traders is larger than the total Commercial net short position by about 389-366=23 million troy ounces...down about 10 million troy ounces from last week's report.
That 10 million troy ounces equates to about 2,000 COMEX contracts, which made up the difference between the change in the Commercial net short position in silver -- and what the Big 4/8 sold.
The reason for the difference in those numbers two paragraphs ago...as it always is...is that Ted's raptors, the 30-odd small commercial traders other than the Big 8, are net long that amount...23 million troy ounces...which has been shrinking rapidly over the last six weeks or so -- and is down about 130 million ounces from its peak.
Another way of stating this [as I say every week in this spot] is that if you remove the Big 8 shorts from the commercial category, the remaining traders in the commercial category are net long the COMEX silver market. It's the Big 8 against everyone else...a situation that has existed for almost five decades in silver -- and in platinum and palladium as well...and up until this week, in gold.
As per the first paragraph above, the Big 4 traders in silver are short around 127 days of world silver production in total. That's a bit under 32 days of world silver production each, on average...up a bit over a day from last week's COT Report. The four big traders in the '5 through 8' category are short 40 days of world silver production in total, which is 10 days of world silver production each, on average...up a tiny bit from last week's COT Report.
The Big 8 commercial traders are short 43.8 percent of the entire open interest in silver in the COMEX futures market, which is down a bit from the 45.0 percent they were short in last week's COT report. And once whatever market-neutral spread trades are subtracted out, that percentage would be a bit over the 50 percent mark. In gold, it's 43.4 percent of the total COMEX open interest that the Big 8 are short, which is down a tiny bit from the 43.6 percent they were short in the prior week's COT Report -- and around the 50 percent mark once their market-neutral spread trades are subtracted out.
In gold, the Big 4 are short 53 days of world gold production, up about 3 days from last week's COT Report. The '5 through 8' are short 22 days of world production -- up about 1 day from last week's report...for a total of 75 days of world gold production held short by the Big 8 -- and up 4 days from last Friday's COT Report. Based on these numbers, the Big 4 in gold hold about 71 percent of the total short position held by the Big 8...up about 1 percentage point from last week's report.
As mentioned further up, Ted said that JPMorgan is long around 4,000 contracts in gold, down a couple of thousand contracts from the prior week's COT Report -- and market neutral in silver. They have been a non-factor in the COMEX futures market for the last year and a bit...leaving the other Big 8 traders to struggle through on their own.
The "concentrated short position within a concentrated short position" in silver, platinum and palladium held by the Big 4 commercial traders are about 76, 78 and 73 percent respectively of the short positions held by the Big 8...the red and green bars on the above chart. Silver is mostly unchanged from last week's COT Report...platinum is down about 1 percentage point from a week ago -- and palladium is down about 3 percentage points week-over-week.
The Big 8 shorts are still hugely exposed in all four precious metals in the COMEX futures market, especially the Big 4...or maybe just the Big 2 now...Citigroup and HSBC. Most of them increased their short positions in both gold and silver during the reporting week -- and the above chart tells you all you need to know about their current plight. They're stuck -- and there's only two ways out for them...deliver physical metal into their short positions, or buy longs and cover that way.
The situation regarding the Big 4/8 shorts continues to be beyond obscene, twisted and grotesque -- and as Ted correctly points out, its resolution will be the sole determinant of precious metal prices going forward.
I only have a handful of stories, articles and videos for you today.
![]()
CRITICAL READS
U.S. Retail Sales Disappoint in April as Stimmy Surge Stalls
After hot-hot-hot inflationary prints this week, following dismal jobs data last week, all eyes are on this morning's retail sales data to discern if America's future is a stagflationary cornering of The Fed. While no one expected a repeat of March's explosive gains, analysts still expected a modest rise (while BofA - who have been consistently correct - warned that a big disappointment was possible with retail sales actually falling MoM). It turns out, BofA was right as retail sales disappointed in April, printing unchanged from March (versus +1.0% expected) after an upwardly revised +10.7% MoM stimmy surge in March. Click to enlarge.
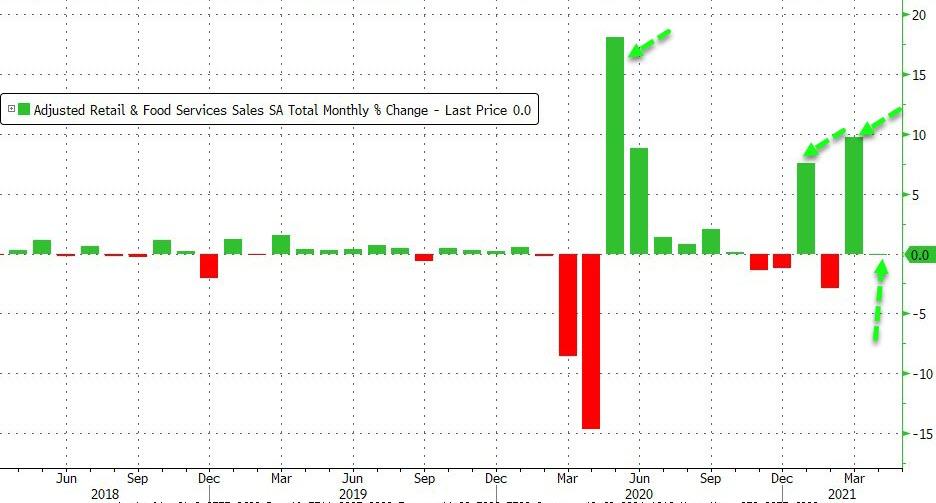
Worse still Core Retail Sales tumbled 0.8% MoM (versus expectations of a 0.3% rise)
Under the hood, clothing, gas stations, and online retailers saw sales sink MoM...
Of course, on a YoY basis - due to the collapse comps - retail sales are up a stunning 51%...
Worse still, the Control Group - which feeds into GDP, tumbled 1.5% MoM...
And to put it all in context, thanks to trillions in free money, U.S. retail sales are officially "above trend"...
Put another way - We’ve brought forward 5 years of trend retail sales growth since the pandemic started due to stimulus.
We're gonna need more stimmies!
This 6-chart Zero Hedge story appeared on their Internet site at 8:38 a.m. EDT on Friday morning -- and is the first offering of the day from reader B.R. Another link to it is here.
U.S. Industrial Production Disappoints in April as Carmakers Crumbled
After a surprisingly large upward revision for March (from +1.5% MoM to +2.4% MoM), April's Industrial Production rose 0.7% MoM (less than the +0.9% expected). Click to enlarge.
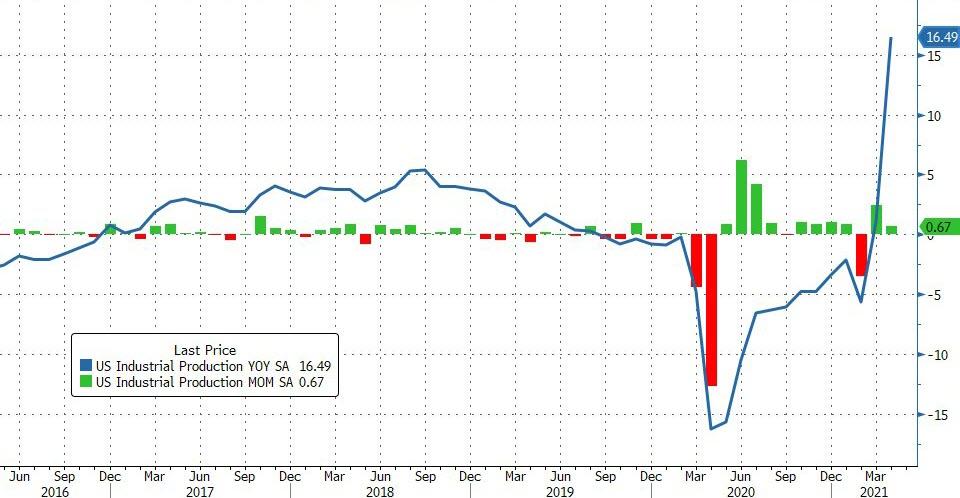
Of course, thanks to the collapse comps, industrial production surged over 16% YoY.
Drilling down, Manufacturing output rose 0.4% MoM (far less than the stimmy-enabled 3.1% MoM surge in March...
Capacity utilization rose to 74.9% from 74.4% in March, which was unrevised from initial release.
Notably Motor vehicle manufacturing plunged again in April )amid shutdowns over chip shortages)...
It would appear the renaissance of the manufacturing economy is slowing fast absent new stimmies.
This brief 3-chart Zero Hedge article was posted on their website at 9:23 a.m. on Friday morning EDT -- and I thank reader B.R. for sending it our way. Another link to it is here.
Today’s Money Landscape: Fantasy Wealth -- Bill Bonner
A dear reader described today’s money landscape in stark terms.
Here’s Michael M.:
"Wait, you wouldn’t pay 10 cents for a 1,700% return?! Why am I reading you?!? Lol. I call BS. If I told you I invested a few shekels in some goofy tech startup with a sexy story and it shot up 1,700%, you’d invite me to write for one of your rags.
My stock portfolio is up/down single or double digits. My crypto portfolio is up 785%. Who cares whether I make my money at DraftKings or FanDuel?! Profit is profit, and missing out is missing out. Love ya."
Main Street – flat. Fantasy street – to the moooon.
Why would anyone waste his time trying to open a machine shop in Gary, Indiana… or an ice cream parlor in Baltimore? The internet is where the profits are.
Why bother to learn biochemistry or electrical engineering? Financial engineering is where the money is.
And why bother trying to add to real wealth at all… when fantasy wealth is so much easier to come by?
Fantasy Wealth
Money is money. And there’s a lot more fast, easy money to be made in the fantasy world than in the real world.
The trouble is, real resources – time, energy, skill, and raw materials – are limited. Put them into the fantasy economy… and the real economy is neglected.
And then, the real world, deprived of labor and capital, shrinks… while the fantasies run wild. And then, they run away.
This interesting commentary from Bill showed up on the rogueeconomics.com Internet site on Friday sometime -- and another link to it is here. Gregory Mannarino's post market close rant for Friday is linked here -- and I thank reader B.R. for his final contribution to today's column.
Unsettled by mounting inflationary pressures, the Treasury market finds peace in global Bubble fragilities. And I actually believe the Fed is on the same page. Officials will resolutely dismiss inflation risk - because they’re scared to death of collapsing Bubbles. At this point, they must believe it’s best to just let the Bubbles and manias run their course.
The Fed and market pundits stick blindly to the assertion “inflation expectations will remain well anchored” – assuring the bond market, dovish Fed policies and the great bull market are all equally well anchored. Yet this is not an environment where anything is securely anchored.
We live in a period of acute disorder – monetary and otherwise. Society has been rocked off its foundation. The insecurity that comes with a once-in-a-century pandemic – our health, our economy, our institutions and our social cohesion.
Hurricanes, floods, drought, devastating fires - the frightening uncertainties associated with global climate change. Power outages. Water shortages. Shootings. A ransomware hack that takes down a major U.S. pipeline and leaves millions fearing they won’t be able to fill their tanks. Who and what next? The Fed “printing” Trillions – seemingly blind to inflation and Bubble risks. Multi-Trillion dollar deficits. Wealth redistribution. Traditions and political institutions in disarray.
It was an unnerving week. Things seem particularly Un-Anchored.
Doug's weekly and very worthwhile commentary was posted on his website very early on Saturday morning EDT -- and another link to it is here.
Kitco lets fund manager Frank Holmes acknowledge gold rigging by central banks
Governments and central banks might have an interest in "stabilizing" gold prices in order to maintain public confidence, which may be an explanation as to why the gold price did not move up on the release of last month's headline record inflation data said Frank Holmes, CEO of U.S Global Investors.
Headline inflation came in at 4.2%, the highest since 2008.
"The threat of gold exploding would basically say they've lost control, and I really think there's some kind of stabilization, if you want to call it," Holmes told David Lin, anchor for Kitco News.
On the mechanics of price control, Holmes said that central banks and governments use the futures markets for direct market operations.
I've met Frank on many occasions -- and we know each other. This price management scheme in the precious metals was explained to him several times by Bill Murphy, Chris Powell and myself starting about fifteen years ago...so he's no stranger to it. The video interview, posted on the kitco.com Internet site at 1:45 p.m. EDT on Friday afternoon, is linked here. I found it in a GATA dispatch.
![]()
The Photos and the Funnies
Still eastbound on Kane Valley Road on July 5 -- and the first shot is one last look at that homestead house that's at least a hundred years old, with the black stallion standing guard. The next photo is of one of the many lakes/sloughs and bodies of water along the gravel road. Once I'd taken that photo, I slapped on the 400mm telephoto and took a picture of the water lilies that you can see in the foreground of the second photo. The last shot was of this colourful and iridescent beetle. It was a bit over 2 centimeters long -- and I regret to this day that I didn't take another photo using the extension tube to get a real close-up. Click to enlarge.


![]()
The WRAP
“A country that tolerates evil means—evil manners, standards of ethics—for a generation, will be so poisoned that it never will have any good end.” -- Sinclair Lewis, It Can't Happen Here
Today's pop 'blast from the past' reached number 15 on the U.S. Billboard Hot 100 in 1971...that's 50 years ago, but who's counting! It spent 18 weeks on the charts, making it their single of greatest longevity, three weeks longer than their greatest hit, "Midnight Confessions". It's instantly recognizable -- and the link is here. I was somewhat surprised that there was a bass cover to this -- and it's far more intricate than I ever thought it would be. The link to that is here.
Joseph Joachim, one of the greatest violinists of the 19th century...or any other century for that matter...was quoted as saying that "The Germans have four violin concertos. The greatest, most uncompromising is Beethoven's. The one by Brahms vies with it in seriousness. The richest, the most seductive, was written by Max Bruch. But the most inward, the heart's jewel, is Mendelssohn's." -- and it's "the heart's jewel" that's today's classical 'blast from the past'.
Felix Mendelssohn's Violin Concerto in E minor, Op. 64, was his last large orchestral work. It holds an important place in the violin repertoire and is one of the most popular and most frequently performed violin concertos in history.
Mendelssohn originally proposed the idea of the violin concerto to Ferdinand David, a close friend and then concertmaster of the Leipzig Gewandhaus Orchestra. Although conceived in 1838, the work took another six years to complete and was not premiered until 1845.
The concerto was well received and soon became regarded as one of the greatest violin concertos of all time. The concerto remains popular to this day and has developed a reputation as an essential concerto for all aspiring concert violinists to master, and usually one of the first Romantic era concertos they learn.
The work is scored for solo violin and a standard orchestra of its period, consisting of two flutes, two oboes, two clarinets, two bassoons, two horns, two trumpets, timpani, and strings.
Here's the incomparable American violinist Hillary Hahn playing with power, passion and great sensitivity...accompanied by what looks like the Seoul Symphony Orchestra. The link is here.
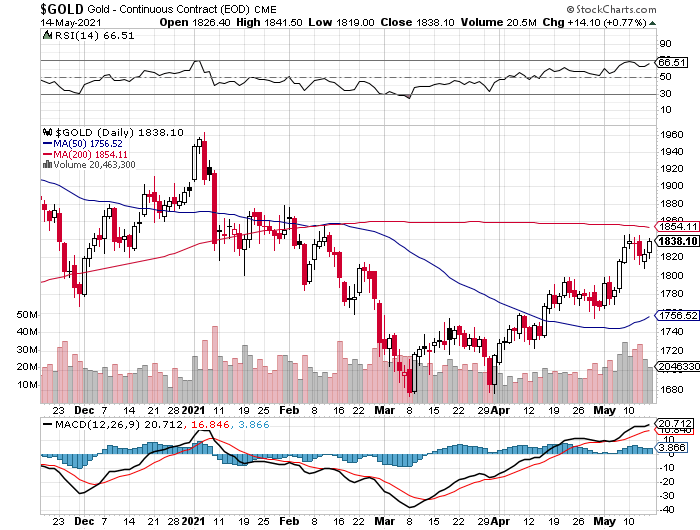
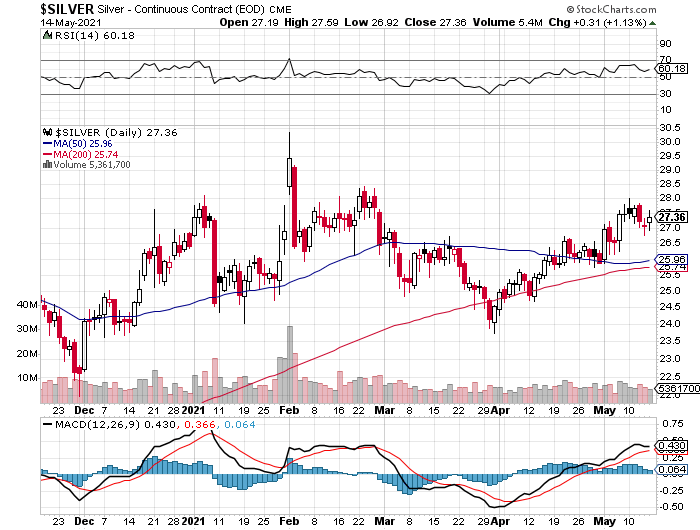
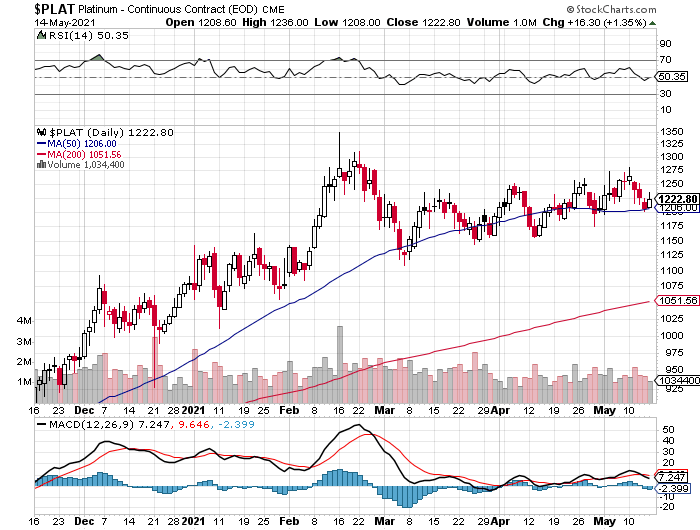
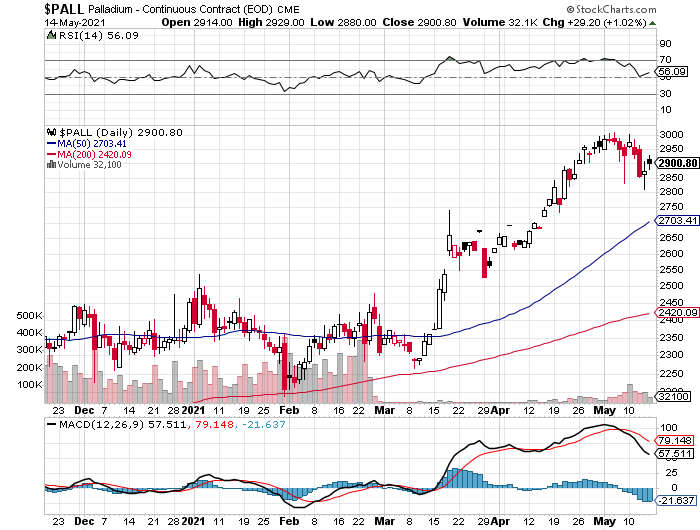
It was certainly nice to end the week on a positive note in all four precious metals, but it was obvious that the Big 4/8 shorts were out and about -- and that was most noticeable at the 10 a.m. EDT afternoon gold fix in London.
Gold came within ten dollars of breaking through its 200-day moving average on an intraday basis on Friday -- and it's pretty much a given that there will be considerably more interest in gold once it closes above that mark by a decent amount...when the Big 4 short allow it, of course. They didn't yesterday -- and haven't for the last five trading sessions in a row.
The other three precious metals, although up on the day, are all above any moving average that matters already, so there's not much to see there.
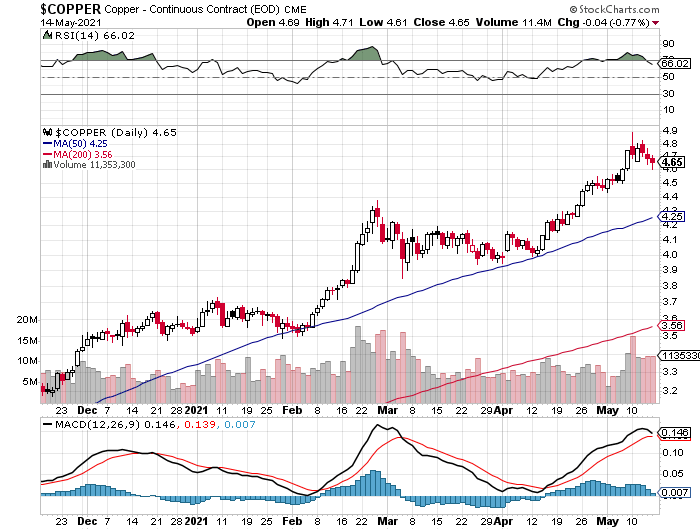
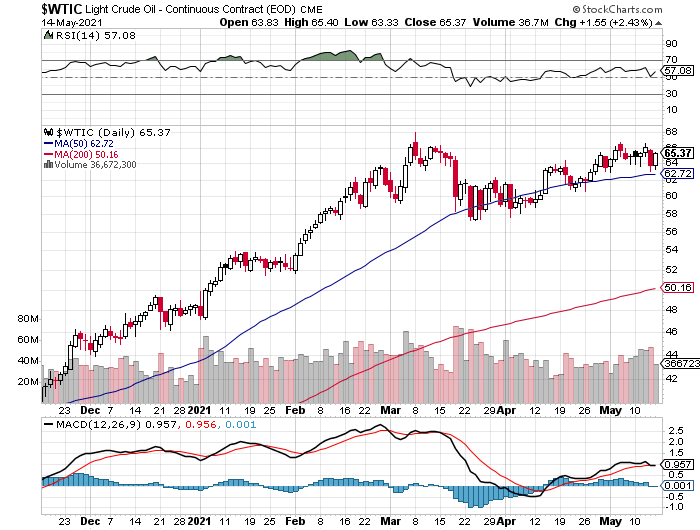
Copper closed down another 4 cents, but WTIC caught a bid on Friday -- and it closed higher by $1.55 a barrel...up 2.43 percent.
Here are the 6-month charts for the Big 6 commodities -- and they come to us courtesy of the stockcharts.com Internet site as always. I'll point out once again that all the gains in gold, silver and platinum that occurred after the COMEX close yesterday, don't appear on their respective Friday candles on these charts. Click to enlarge.
We're already well along the "print or die" path -- and now entering the "print and die" stage.
The band-aid applied to the world's financial system after the financial crisis of 2008/09 got ripped off in September 2019 when the repo market went sideways -- and the Fed had to step in.
Since then, the Fed has dumped an obscene number of trillions of dollars into the financial system that has has mostly ended up on Wall Street, or in excess reserves involving the "too big to fail" banks in New York.
The 'everything bubble' is so ginormous now that few people can comprehend its true size.
As Stan Druckenmiller pointed out in his CNBC interview earlier this week..."We're in a raging mania"...“I can’t find any period in history where monetary and fiscal policy were this out of step with the economic circumstances, not one.”
What Druckenmiller doesn't realize, or won't admit to in public -- and that I pointed out in my comments on that interview, was that this Fed policy is deliberate. They need massive inflation -- and they're determined to get it by hook or by crook.
At the moment, they and all associated parties are keeping their collective thumbs on precious metal prices, so that this now runaway price inflation doesn't become too apparent too soon. But that state of affairs can't -- and won't last.
How long the Fed and the other central banks of the world can keep the biggest financial bubble the world has ever known inflated, remains to be seen. But it's a given that it will end as all other financial bubbles have ended in all of recorded history...in an economic, financial and monetary implosion the likes of which none of us have ever experienced in our lifetimes.
The Fed, the U.S. Treasury and most likely the Exchange Stabilization Fund, were there to save the markets in the crash of '87 -- and when LTCM went bust in 1998/9 -- and again in the market melt-down in 2008/09. But they won't be there for the next one, as the system won't survive it -- and no attempt will be made to save it when it finally falls...or is pushed.
But as I and others have stated, the New World Order crowd will be there -- and what emerges from the ashes of this current version of the "Bonfire of the Vanities" will be a far more malevolent and draconian beast.

And when that stampede out of everything paper begins, the rush into the precious metals will be on in earnest. But these same investors will find that almost all of the physical gold and especially physical silver has already been tucked away in various and sundry ETFs and mutual funds over the last few years -- and in the physical holdings of the small retail investor like you and I.
It will take fantastically higher prices to pry them out of our hands at that point and, depending on what is going on in the currency market...or in the rest of the world at that time...maybe not all, or at least until the dust settles.
This is especially the case in silver, as the amount of the physical metal in good delivery form, as has already been acknowledged to be, at critically low levels.
And as silver analyst Ted Butler pointed out in his mid-week commentary to his paying subscribers on Wednesday..."the real equation is not the tens or hundreds of billions or trillions of dollars trying to plow into an asset [silver] worth $55 billion, but into an asset where only a few billion dollars may be actually available for sale – if that. And remember, the higher an asset price goes, the more investors want to buy it -- and less want to sell it. In this context, talk of $50 or $100 or $200 silver could easily prove extremely low as a target price. Also please remember that this is a one-way street in that great gobs of money may flow out of the over-owned and over-invested in markets -- and into silver, but the reverse is impossible. Massive amounts of money fleeing silver into the over-owned markets in an absurdity on its face."
That -- and for all the other reasons discussed above, is the reason that I'm still "all in".
See you on Tuesday.
Ed


