
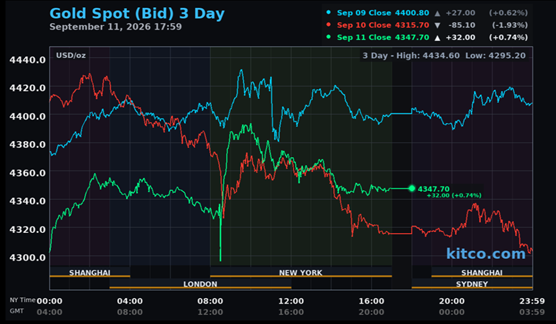
The gold price began to rally a bit in the hour leading up to the Shanghai open on their Friday morning, but was then sold/engineered lower until noon China Standard Time...with its ensuing rally getting capped at the 2:15 p.m. afternoon gold fix over there. It was then sold quietly lower until a vicious down/up spike took place when the CPI number hit the tape. Its boomer rally was capped at 9 a.m. -- and its high tick was set at the 10 a.m. EDT afternoon gold fix in London. It was all quietly and a bit unevenly down hill from that point until around 3:45 p.m. in after-hours trading -- and it didn't do much after that.
The low and high ticks in gold, both of which were set in early COMEX trading, were recorded by the CME Group as $4,300.00 and $4,410.20 in the October contract -- and $4,333.00 and $4,444.90 in December...an intraday move of $111.90 an ounce in the latter month. The October/December price spread differential in gold at the close in New York yesterday was $34.10... December /February27 was $36.20...February/April27 was $35.20 -- and April/June27 was $37.10 an ounce.
Gold was closed in New York on Friday afternoon at $4,347.70 spot...up $32.10 on the day -- and $53.50 off its Kitco-recorded high tick. Net volume in October and December combined was only a bit on the heavier side at around 188,000 contracts -- and there were around 17,000 contracts worth of roll-over/switch volume on top of that.
I saw that 88 gold, plus 526 silver contracts were traded in September yesterday and, as is always the case, it remains to be seen just how much of these amounts show up in tonight's Daily Delivery and Preliminary Reports further down in today's column.
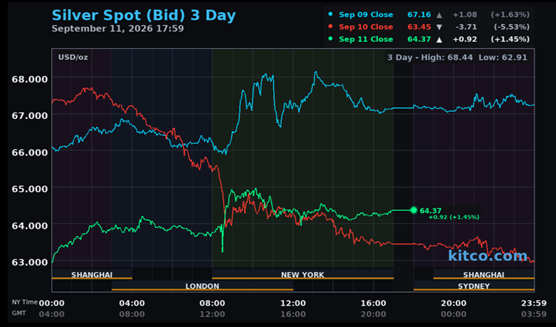
The price path for silver was similar to gold's on Planet Earth yesterday, except its high tick in New York was set about ten minutes after the 10 a.m. afternoon gold fix in London -- and almost all of its price decline after that was in by 11:15 a.m. EDT. It was then forced to chop quietly sideways until the market closed at 5:00 p.m.
The engineered low and high ticks in it were reported as $63.15 and $65.82 in the December contract...an intraday move of $2.67 an ounce. The September/ December price spread differential in it was 63.4 cents...December/March27 was 79.0 cents -- and March/May27 was 56.3 cents an ounce.
Silver was closed on Friday afternoon in New York at $64.37 spot...up 92 cents on the day -- and 79 cents off its Kitco-recorded high tick. Net volume was nothing at all special at 45,500 contracts -- and there were about 8,300 contracts worth of roll-over/switch volume in this precious metal.

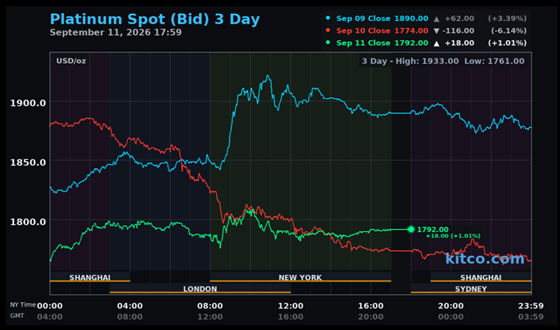
Platinum's price path was a mini version of what occurred with silver. It was closed on Friday afternoon in New York at $1,792 spot...up 18 dollars from Thursday -- and 20 bucks off its Kitco-recorded high tick.
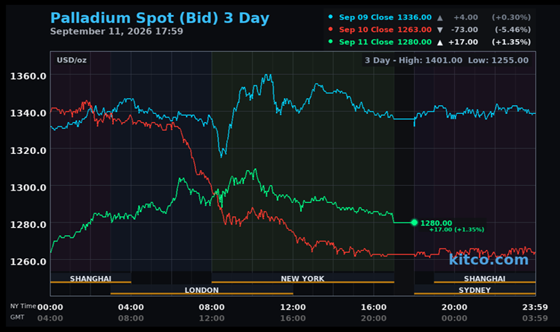
Palladium didn't do anything until 12 o'clock noon in Shanghai on their Friday -- and then began to head somewhat unevenly higher until was capped and rolled over at the 10 a.m. EDT afternoon gold fix in London. From that juncture it was sold/engineered quietly lower until trading ended at 5:00 p.m. EDT. Palladium was closed at $1,280 spot...up 17 bucks -- and 31 dollars off its Kitco-recorded high tick.
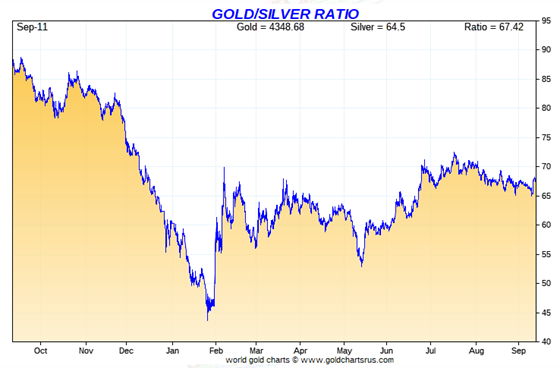
Based on the kitco.com spot closing prices in silver and gold posted above... the gold/silver ratio worked out to 67.3 to 1 on Friday...compared to 68.0 to 1 on Thursday.
Here's the 1-year Gold/Silver Ratio chart from Nick Laird -- and updated with this past week's data. Click to enlarge.
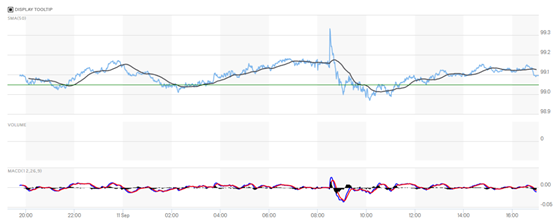
The dollar index closed very late on Thursday afternoon in New York at 99.05 -- and then opened higher by 4 basis points once trading commenced at 7:45 p.m. EDT on Thursday evening...which was 7:45 a.m. China Standard Time on their Friday morning. It then proceed to wander very broadly and very quietly sideways until it spiked higher on the CPI number at 8:30 a.m. in New York. Someone was there to put an end to that instantly -- and it was down hill from that point until 10:09 a.m. EDT...the high tick in silver. It then chopped quietly higher until around 2:45 p.m. -- and then sagged a small handful of basis points until the market closed at 5:00 p.m. EDT.
The dollar index finished the Friday trading session in New York at 99.10...up a whole 5 basis points from its close on Thursday.
Here's the DXY chart for Friday...thanks to marketwatch.com as usual. Click to enlarge.
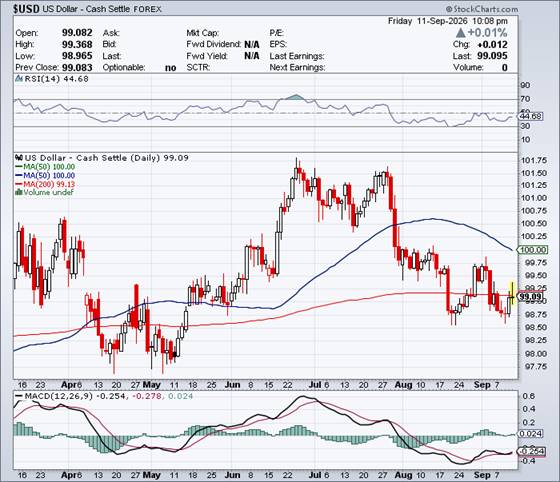
Here's the 6-month U.S. dollar index chart...courtesy of stockcharts.com as usual. The delta between its close...99.10...and the close on DXY chart above, was zero basis points. Click to enlarge.
Along with the precious metals, the powers-that-be were all over the dollar index and Treasury yields as well.
U.S. 10-year Treasury: 4.9750%...up 0.0310/(+0.63%)...as of the 1:59:54 p.m. CDT close
The yield on the ten-year spiked higher starting about three minutes before the CPI number was released -- and its spike 4.9850% high tick was set right on the dot at 8:30 a.m. EDT. The Fed stepped in -- and it fell sharply from that point until 9:03 a.m. EDT -- and then chopped quietly higher until it was stopped cold at 4.9750% at 1:45 p.m. CDT/2:45 p.m. EDT.
For the week, the ten-year yield closed up by 19.10 basis points -- and the sole reason it didn't close up more than that was because of the constant interference by the Fed. Once has to wonder if they'll cap its yield at this point. We'll find out soon enough.
Here's the 5-year 10-year U.S. Treasury chart from the yahoo.com Internet site -- which puts the current yield into a somewhat longer-term perspective. Click to enlarge.
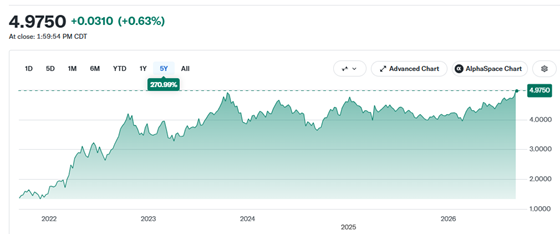
Its 4.92% high of October 15, 2023 is now history. The yield on the ten-year hasn't been this high since back in June 2006...more than 20 years ago -- and it would be far, far higher than this if it hadn't been for the Fed buying up everything in sight. The situation is now beyond critical, with no hope going forward. We're not in Kansas anymore.

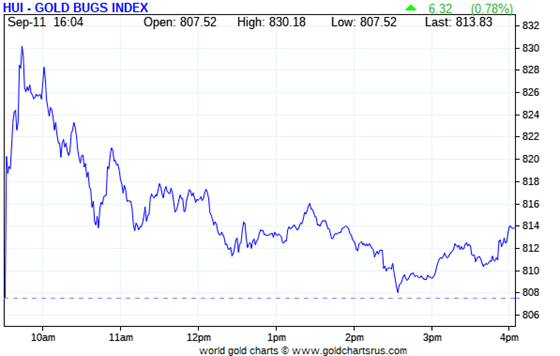
The gold shares gapped up big at the 9:30 opens of the equity markets in New York on Friday morning, only to run into a wall of selling...which continued until around 2:35 p.m. EDT. They then rallied a bit until the markets closed at 4:00 p.m. EDT. The HUI was only allowed to close higher by 0.78 percent.
And as bad as it was in the gold equities, 'da boyz' crushed the boomer rally in the silver stocks as well -- and even had the audacity to close them in negative territory on the day. Nick Laird's Silver Sentiment Index was finished the Friday session down 1.35 percent. Click to enlarge.
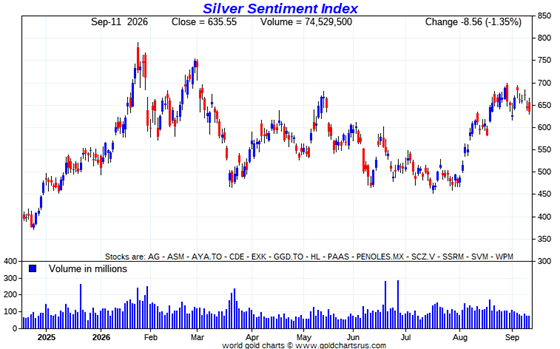
The stars and dogs didn't matter yesterday, as whatever prices each silver stock closed at, was a totally artificial one. However, I noted that Avino Silver & Gold Mines got crushed by 8.85 percent on big volume, but on no news that I could see.
I didn't see any news on any of the thirteen silver companies that comprise the above index.
Silver closed higher by 1.45% on Friday -- but Nick's Silver Sentiment Index finished the day down 1.35%. Sprott's PSLV finished the day up only 0.29%
Gold closed up only 0.74%...the HUI closed higher by 0.78% -- and Sprott's PHYS closed up 0.58%
It should be obvious to anyone by now that 'da boyz' are at total war in the precious metals space...the metals themselves -- and their equities. I have more on this in The Wrap.
The Shanghai/U.S. price premium in silver was 12.90 percent on their Friday.
The reddit.com/Wallstreetsilver website, now under 'new' and somewhat improved management, is linked here. The link to two other silver forums are here -- and here.

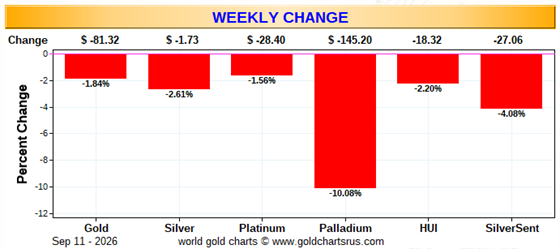
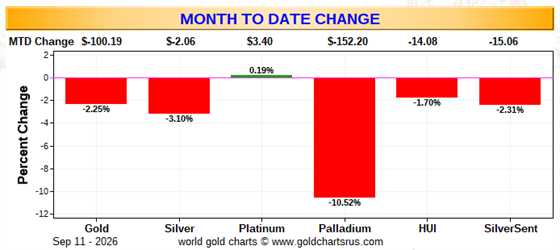
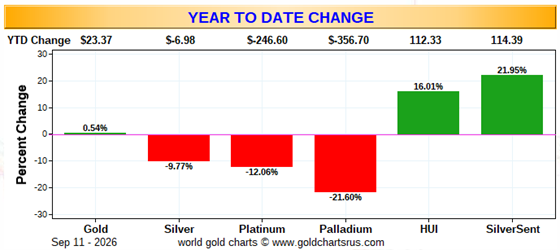
Here are the usual three charts that appear in this spot in every weekend missive. They show the changes in gold, silver, platinum and palladium in both percent and dollar and cents terms, as of their Friday closes in New York — along with the changes in the HUI and the Silver Sentiment Index.
Here's the weekly chart -- and because of all the price management going on in the precious metals and their associated equities, not a thing should be read into this chart. Click to enlarge.
The month-to-date -- and very little, if anything, should be read into this chart either -- and for the same reasons stated for the weekly chart above. Click to enlarge.
Here's the year-to-date chart -- and it remains a different kettle of fish. Gold is back in the green, albeit barely...but the other three precious metals remain down year-to-date. It continues to be of great interest that the silver shares are 'outperforming' the metal itself by as much as they are over this time period -- and I'm starting to wonder if all these gains in the precious metal equities ytd are 'da boyz' accumulating their stocks in order to manipulate them downwards as the year has gone along. Click to enlarge.
Despite the fact that silver has now broken the $120 barrier...albeit briefly -- and the silver well in London came close to running dry last October...the gold/silver ratio remains at a farcical 67.3 to 1 as of Friday's close. The 'normal' and historical ratio is around 15 to 1...which would put silver at around $290 based on gold's closing price on Friday. And if priced at the ratio of 7:1 that it comes out of the ground at...compared to gold...that would put silver at around $620 an ounce. So a rather impressive triple-digit silver price is in our future...most likely somewhere between those two numbers.
As I say in this spot every Saturday...all that remains to be resolved is what that price will be -- and how soon 'da boyz' allow it to happen. Its first attempt to reach one of these values back at the end of January was obviously crushed ...as were all the rest since then. How its current rally ends, remains to be seen. But in the face of its continuing structural deficit -- and all the other stuff going on in the world today, they can't keep it up forever.

The CME Daily Delivery Report for Day 10 of September deliveries showed that 72 gold -- plus 215 silver contracts were posted for delivery within the COMEX-approved depositories on Tuesday.
In gold, the two short/issuers were RBC [Royal Bank of Canada] Capital Market and Marex Capital Markets...issuing 66 and 6 contract out of their respective client accounts. There were six long/stoppers in total -- and the three biggest were JPMorgan, Deutsche Bank AG and Wells Fargo Securities ...picking up 19, 18 and 17 contracts respectively...JPMorgan for their client account. Next down the list was British bank Barclays...stopping 12 contracts for their client account.
In silver, there were five short/issuers in total -- and the three largest were Wells Fargo Securities, JPMorgan and Advantage...issuing 139, 50 and 23 contracts respectively...Wells Fargo from their house account. The only two long/stoppers that mattered were British bank HSBC and JPMorgan...picking up 180 and 32 contracts respectively...HSBC for their house account.
In copper, the big deliveries continue...as 929 COMEX contracts/23.225 million pounds were issued and stopped.
The link to yesterday's Issuers and Stoppers Report is here.
So far in September, there have been 2,800 gold contracts, plus 5,599 silver contracts issued and stopped. On First Day Notice for September deliveries, there were 2,815 gold contracts still open -- and that number in silver was 4,934 COMEX contracts...so there have already been more silver contracts issued and stopped than posted on First Day Notice, with lots of the September delivery month still ahead of us.
But to tell you the truth, I'm totally underwhelmed by the deliveries we've had so far this month -- and in most of August as well. The demand for physical metal by those that hold paper long contracts on the COMEX has dropped off massively in the last six or so weeks -- and for no reason that makes any sense to me...especially considering the monster delivery months we've had preceding this.
The CME Preliminary Report for the Friday trading session, showed that gold open interest in September increased by 61 contracts, leaving 487 still open...minus the 72 contracts out for delivery on Tuesday as per the above Daily Delivery Report. Thursday's Daily Delivery Report showed that only 8 gold contracts were posted for delivery on Monday...so that means that 61+8=69 more gold contracts were added to September deliveries.
Silver o.i. in September increased by 71 contracts, leaving 657 still around ...minus the 215 contracts out for delivery on Tuesday as per the above Daily Delivery Report. Thursday's Daily Delivery Report showed that 200 silver contracts were actually posted for delivery on Monday...so that means that 200+71=271 more silver contracts were added to the September delivery month.
Total gold open interest for the Friday trading session in last night's Preliminary Report declined by 481 COMEX contracts. Total silver o.i. on Thursday fell by a scant 12 contracts.
[I checked the final change in total open interest for gold for Thursday in Friday's final report from the CME Group -- and it showed a fairly substantial decrease...from +3,410 COMEX contracts, down to -122 contracts. The final change in total silver o.i. for Thursday also showed a noticeable drop... from +489 COMEX contracts...down to +88 contracts. The fact that total open interest in both didn't fall a whole bunch because of the price action, is still a surprise.]
Gold open interest in Octoberin Friday's Final Report for Wednesday fell by 781 contracts, leaving 47,187 COMEX contracts still open. Silver open interest in October in Friday's final report for the Thursday trading session increased by 252 contracts...leaving 3,085 COMEX contracts still open.

There was a decent withdrawal from GLD on Friday, as an authorized participant removed 91,698 troy ounces of gold -- and there were no reported changes in SLV.
The SLV borrow rate showed only one data point on Friday...0.43%...with 10.0 million shares available. The GLD borrow rate started the day at 0.27% -- and finished at 0.29%...with 7.9 million shares available.
In other gold and silver ETFs and mutual funds on Earth on Friday ...net of any changes in COMEX, GLD, GLDM and SLV activity, there were a net 49,921 troy ounce of gold added -- and a net 262,841 troy ounces of silver were added as well.
There was some activity in gold over at the COMEX-approved depositories on the U.S. east coast on Thursday. There were 3,215.100 troy ounces/100 kilobars received over at Manfra, Tordella & Brookes, Inc. -- and 32,225 troy ounces were shipped out of JPMorgan. There was no paper activity - and the link to Thursday's COMEX gold activity is here.
And for the third day in a row it was super busy in silver, as 1,281,480 troy ounces were received -- and 1,869,822 troy ounces were shipped out.
The largest 'in' amount were the 681,816 troy ounces received at Brink's, Inc...with the remaining truckload/599,664 troy ounces, putting in an appearance over at Manfra, Tordella & Brookes, Inc.
There were five different depositories that shipped out silver, with the largest amount by far being the 957,717 troy ounces that left JPMorgan...the second day in a row they've shipped out big silver. The next two largest were the 610,774 and 245,434 troy ounces that departed Asahi and Manfra, Tordella & Brookes, Inc. respectively.
There was monster paper activity, as 2,073,953 troy ounces were transferred from the Registered category and back into Eligible over at Brink's, Inc...no doubt to save on storage costs.
The link to Thursday's hefty COMEX silver action is here.
The Shanghai Futures Exchange updated their silver inventories as of the close of business on their Friday -- and it showed that a net 316,173 troy ounces/ 9.834 metric tonnes of silver were added... leaving their silver inventories at 45.253 million troy ounces/1,407.505 metric tonnes.

Here are the 2-year weekly charts that show the total amounts of physical gold and silver held in all known depositories, ETFs and mutual funds as of the close of business on Friday. Click to enlarge.
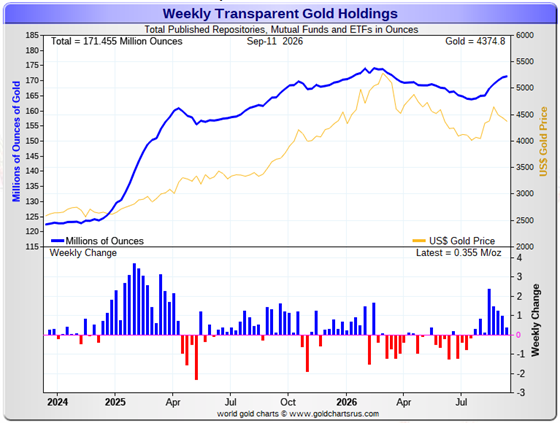
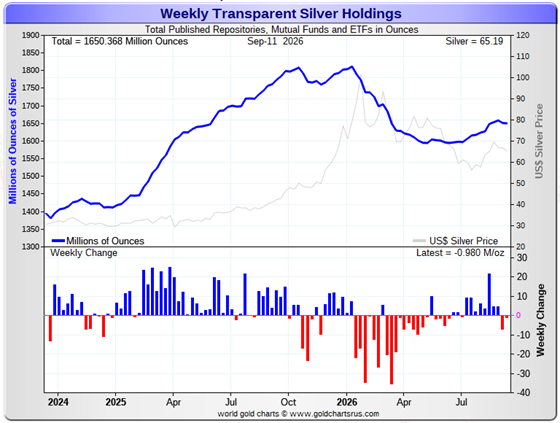
During the business week just past, there were a net 355,000 troy ounces of gold added -- but a net 980,000 troy ounces of silver were withdrawn...the second week in a row there was withdrawal.
According to Nick Laird's data on his website, a net 4.027 million troy ounces of gold were added to all the world's known depositories, mutual funds and ETFs during the last four weeks. There have now been net gold deposits for the last eight weeks in a row.
The amount of gold in all the world's ETFs and mutual funds still remains a bit below its old all-time high of late February of this year.
A net 1.378 million troy ounces of silver were also added during that same 4-week time period. It would have been 8.6 million oz. higher than that if not for the big withdrawals from two of Sprott's silver funds last week.
It should be noted that the amount of silver held in all these depositories, ETFs and mutual funds remains well below its old all-time high inventory level of late January 2026...which is no surprise.
This was the second week in the last ten that there has been a net withdrawal of silver -- and as I pointed out, it was all because of those huge withdrawals from those Sprott ETFs.
Retail demand remains mostly comatose, but has picked up from what it's been for last few months. There are no 'out of stock' signs over at all the retail bullion stores that I follow. They have decent stocks in just about everything they normally carry. The buy/sell spreads at most bullion stores remain a bit north of 10 percent -- and in the case of anything less than 0.999+ pure, it's far more than that. This obviously means that they have lots of stock -- and are still not at all enthusiastic about buying anything.
COMEX silver withdrawals were monstrous earlier in the year...135 million in Q1/2026...23 million oz. in April -- but only 12.6 million oz. in May -- and only 5.3 million oz. in June. In July, COMEX warehouse stocks actually rose by a net 9.5 million oz. -- and in August, it was a net 5.0 million oz. added. There was virtually no in/out activity worthy of the name in August. In/out activity in COMEX silver has been pretty hefty over the last three trading days in September.
There has also been big demand for silver in the scheduled September delivery month so far...27.995 million troy ounces. But this is not really physical silver demand per se...as all that's happening is that silver already sitting on the COMEX just changes ownership.
However, silver demand from the COMEX can only go on for so long, as a huge chunk of it is owned privately in the Eligible category -- and not for sale or delivery. Just how much silver is actually available for shipment on demand to the LBMA of elsewhere, is unknown...but it's most certainly finite.
We're deep into the sixth year of a structural deficit in silver according to the ongoing reports from The Silver Institute. However, subscriber John Macintosh thinks it's far more than they're reporting -- and threw another b.s. flag on their latest report in his latest essay headlined "The Silver Institute: A Wonderland of Compounded Errors" -- and linked here.
The vast majority of precious metals being held in these depositories are by those who won't be selling until the silver price is many multiples of what it is today...if ever.
Sprott's PSLV is the third largest depository of silver on Planet Earth with 207.2 million troy ounces...unchanged from last week -- and a great distance behind the COMEX, which has now been demoted to the second largest silver depository, where there are 337.2 million troy ounces being held...down a net 1.5 million troy ounces this past week...but minus the 103 million troy ounces being held in trust for SLV by JPMorgan that Ted Butler found out about many years ago.
That 103 million ounce amount brings JPMorgan's actual silver warehouse stocks down to around the 33 million troy ounce mark...quite a bit different than the 135.9 million they indicate they have -- down 2.2 million troy ounces ...the first change in nine weeks. They've parted with a lot of silver in the last ten or so months...around 78 million oz.
But that number doesn't include the silver that JPMorgan owns and has stored at the other COMEX-approved depositories. They've shipped out lots of that over the months and years...especially this year so far -- and a lot of it out of CNT.
PSLV remains a very long way behind SLV as well -- still the largest silver depository...with 492.4 million troy ounces as of Friday's close...down about 800,000 troy ounces this past week.
The latest short report [for positions held at the close of business on Monday, August 31] showed that the short position in SLV rose by a hefty 28.41%... from the 21.65 million shares sold short in the prior report...up to 27.80 million shares in the latest short report that came out this past Thursday. This amount represents 5.10% of total SLV shares outstanding...still a bit obscene, but not nearly as bad as it was earlier in the year. Don't forget that there's no physical silver backing any of these shorted shares as the SLV prospectus requires.
BlackRock issued a warning more than ten years ago now to all those short SLV, that there might come a time when there wouldn't be enough metal for them to cover. That would only be true if JPMorgan decided not to supply it to whatever entity requires it. Those that remain short SLV shares are in equally dire straits as the Big 8 shorts in silver in the COMEX futures market -- and I suspect that they're the same entities.
The next short report...for positions held at the close of trading on Tuesday, September 15...will be posted on The Wall Street Journal's website on Thursday, September 24.
Then there's that other little matter of the monster short position in silver held by Bank of America in the OTC market...with JPMorgan & Friends on the long side. Ted said it hadn't gone away. He wrote an article about this back in April 2021 headlined "A New Piece of the Puzzle" -- and linked here.
A while after that article came out, he also come to the conclusion that they're short around 25 million ounces of gold with these same parties as well. Once these short covering rallies in both silver and gold begin anew...we'll see if they need to get taken over, like Bear Stearns did back in 2008 -- and for the same reason. If that's the case, JPMorgan...their counterparty to these trades ...will pick them up for next to nothing as well.
However, the latest report from the OCC that came out at the end of June does cast some doubt on Ted's thesis -- although I'm not at all qualified to say that it's no longer valid. Maybe the next report at the end of September will shed more light on this.

The Commitment of Traders Report, for positions held at the close of COMEX trading on Tuesday showed a tiny decrease in the Commercial net short position in silver...but a slight and expected increase in the commercial net short position in gold.
In silver, the Commercial net short position declined by a tiny 372 COMEX contracts...1.860 million troy ounces of paper silver. However, the good news stopped there, because big 8 commercial traders increased their short positions during the reporting week. More on that in a bit.
They arrived at that number through the sale of 360 long contracts, but also bought back/covered 732 short contracts. It's the difference between those two numbers that represents their change for the reporting week.
Under the hood in the Disaggregated Report it was a bit more interesting. The traders in the Managed Money and Nonreportable/small traders category both increased their net long positions during the reporting week...the former by 1,788 COMEX contracts -- and the latter by 318 contracts. This meant that the traders in the Other Reportables category had to have been sellers to make the numbers work -- and they were...reducing their net long position by 2,478 contracts.
Doing the math: 2,478 minus 1,788 minus 318 equals 372 COMEX contracts ...the change in the Commercial net short position.
The Commercial net short position in silver now sits at 44,908 COMEX contracts/ 224.540 million troy ounces of paper silver...down those 372 contracts from last Friday.
The Big 4 collusive commercial traders increased their net short position by 484 COMEX contracts, up to 32,523 COMEX contracts...about 2,700 contracts off their lowest short position on record.
The Big '5 through 8' also increased their net short position...them by a piddling 37 COMEX contract...up to 16,004 contracts...and 3,300 contracts above their lowest short position I have records for.
The Big 8 commercial traders in total are net short 48,527 COMEX silver contracts...up those 484+37=521 contracts on the week.
But since the Big 8 short position increased by 521 contracts during the reporting week -- and the total Commercial short position actually fell by 372 COMEX contracts, that meant that Ted Butler's raptors, the 24 small commercial traders other than the Big 8, had to have been buyers during the reporting week -- and they were, for the first time in six weeks...increasing their net long position by 521+372=893 COMEX contracts. They are now net long silver by 3,619 COMEX contracts.
And as I explain every week in this spot, the purchase of these long contracts by Ted's raptors has the mathematical effect of decreasing the Commercial net short position by those 893 contracts...which isn't a decrease at all. When these small commercial traders are net long like they are in silver, it's only what the Big 8 commercial shorts do that matters. It's been that way forever ...as the raptors very rarely go short silver.
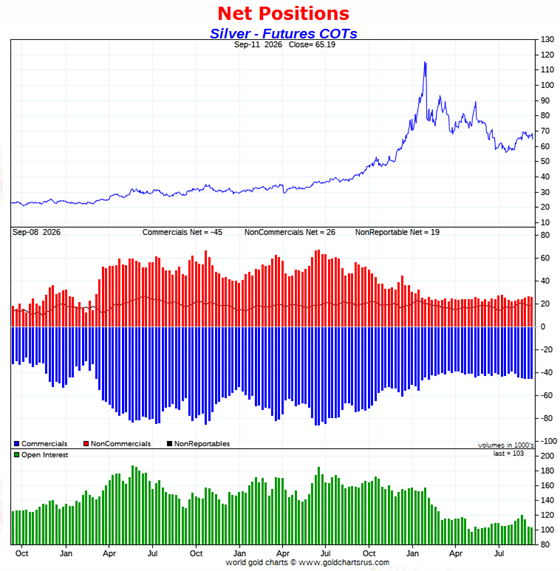
Here's the 3-year COT chart for silver thanks to Nick Laird -- and updated with the above data. Click to enlarge.
In Wednesday's missive, I wrote the following about what would be in yesterday's COT Report...
"Looking at the four candles of the reporting week on their 6-month charts above suggests that there will be slight increases in the commercial net short positions in both silver and gold...as the engineered price declines of the last three days weren't big enough to negate the even larger rallies that took place during the first two days of the reporting week.
But whatever those increases might be, they won't move the needle much on what they're currently short in both these precious metals...gold in particular."
Although there was a decline in silver, it only came about because of the purchase of those long contracts by Ted Butler's raptors. The Big 8 commercial shorts actually increased their net short positions during the reporting week, which I was expecting -- and the only thing that matters.
Of course the bear raids by these collusive traders since the Tuesday cut-off makes Friday's COT Report 'yesterday's news' in most respects.
The Big 8 commercial traders are net short 47.0 percent of total open interest in silver in the COMEX futures market...up a tiny bit from the 46.0 percent they were net short in last Friday's COT Report. That increase was helped along a bit by the decrease in total open interest during the reporting week ...which obviously affects the percentage calculation.
But despite the fact that the Big 8 collusive commercial traders are still a bit off their lowest short position on record, the set-up from a COMEX futures market perspective remains extremely bullish nonetheless -- and is ever more so after what 'da boyz' pulled off since Tuesday's cut-off.
All that stands in the way of a rather spectacular 3-digit silver price...as it's always been...are the Big 8 collusive shorts.
In gold, the commercial net short position increased by 5,556 COMEX contracts, which works out to 555,600 troy ounces of paper gold.
They arrived at that number through the sale of 7,047 long contracts...but also bought back/covered 1,491 short contracts -- and it's the difference between those two numbers that represents their change for the reporting week.
Under the hood in the Disaggregated COT Report I was somewhat surprised to see that the Managed Money traders actually reduced their net long position ...them by 1,799 COMEX contracts. The Other Reportables and Nonreportable/ small traders were big buyers, as the former category increased their net long position by 5,635 contracts -- and the latter category by 1,720 COMEX contracts.
Doing the math: 5,635 plus 1,720 minus 1,799 equals 5,556 COMEX contracts...the change in the commercial net short position, which it must do.
The commercial net short position in gold now sits at 270,274 COMEX contracts/27.027 million troy ounces of paper gold...up those 5,556 contracts mentioned in the previous paragraph. This is a pretty enormous number.
The Big 4 commercial traders increased their net short position by 2,997 COMEX contracts, up to 162,434 contracts.
But the Big '5 through 8' commercial traders decreased their net short position for the second week in a row...them by 1,058 contracts, down to 66,619 COMEX contracts.
The Big 8 commercial traders in total are net short 229,053 COMEX gold contracts...up 2,997-1,058=1,939 contracts from last Friday's COT Report -- and are now a very hefty 67,155 contracts above their record low of 161,898 contracts that they were short back on May 26.
But since the commercial net short position increased by 5,556 COMEX contracts -- and the Big 8 only increased their net short position by 1,939 contracts...that meant that Ted's raptors, the 39 small commercial traders other than the Big 8, had to have been net sellers as well during the reporting week as well -- and they were. They increased their net short position by 5,556-1,939=3,617 COMEX contracts -- and are now net short gold by 41,221 COMEX contracts...a grotesque amount. They haven't been this net short gold since January 13.
And like they currently are in silver, they would normally be net long gold by many thousands of contracts [if not tens of thousands of contracts] at this point in the price cycle -- and why they're not this time around, I have no idea...but suspect that they have been recruited into the trenches in the fight to prevent a massive rise in its price.
But if they weren't short this amount -- and net long those thousands [to tens of thousands] of contracts that they normally would be, it's a guarantee that gold would be many, many thousands of dollars higher in price than it is now.
I suspect that no more than two or three of these small commercial traders hold the vast majority of this short position...so it's the 'Big 10 or 11' -- and not just the 'Big 8' traders that are running the gold price management show.
Here's Nick's 3-year COT chart for gold -- and updated with the above data. Click to enlarge.
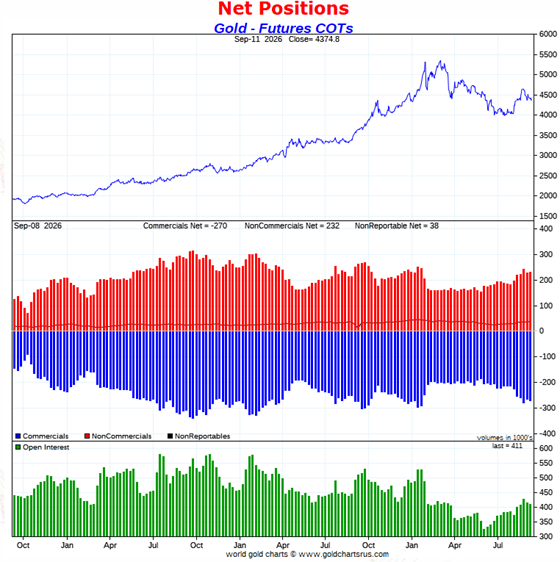
The Big 4 and Big 8 shorts haven't held this large of a short position in gold since back on January 20...the week before the big engineered price decline in it and silver.
And this is despite the fact that gold is down about about $1,200 from its high at the end of January. So, like they are in silver, the Big 8 shorts are worse off now, than they were back then.
Of course the bear raids by 'da boyz' since the Tuesday cut-off has been of some help. But no matter how much they huff and puff going forward...they'll never get back to the record low short position in gold they held on May 26.
The Big 8 are short 55.7 percent of total open interest in gold in the COMEX futures market...up a tiny amount from the 54.7% they were short in last week's report. The reason that it increased as much as it did, was because of the 3,969 contract decrease in total open interest during the reporting week, which obviously affects the percentage calculation.
However, unlike silver, the commercial net short position in gold is much larger than the Big 8 short position...because the rest of the collusive commercial traders, Ted Butler's raptors, are also net short gold. Adding them [39 traders] into the mix, which you have to do, puts the commercial net short position in gold at 65.7 percent of total open interest in the COMEX futures market...up from the 63.8% that they were short in last Friday's report.
Then, if you subtract out the uneconomic and market-neutral spread trades from total open interest, the commercial net short position in gold jumps up to around 70% of total open interest...which is grotesque beyond belief.
Of course they've been able to improve their situation a bit because of what 'da boyz' have pulled off since the Tuesday cut-off...but it's obvious, that with their respective rallies underway, the commercial traders have shown no reluctance whatsoever in going back on the short side in gold in a big way, when required...but obviously far less so in silver.
In the other metals, the Managed Money traders in palladium decreased their net short position by a further 280 COMEX contracts -- and are now net short palladium by only 4,339 COMEX contracts. Why they're short this precious metal remains a mystery.
The commercial traders in the Swap Dealers category are net long palladium by 3,269 contracts -- and the commercial traders in the Producer/Merchant category remain on the short side for the fifth week in a row, but only by a net 437 COMEX contracts. The traders in the Other Reportables category are net long 627 contracts in this metal -- and the Nonreportable/ small trader categories are net long 880 COMEX contracts.
As I keep mentioning about these numbers, palladium is a very dinky market. Total open interest is only 16,773 COMEX contracts...up 276 contracts this past reporting week...still about the lowest it's been since sometime in 2022. Open interest in platinum is also about the lowest since that time as well.
The world's banks are net short an inconsequential 7.5 percent of total open interest in palladium in the COMEX futures market as the September Bank Participation Report that came out this past Tuesday...which is an inconsequential increase from the 4.0 percent that they were net short in August's Bank Participation Report.
This is a very strange and twisted market once you get a look into its internal structure -- and as I point out in every monthly Bank Participation Report, the only reason that there's a COMEX futures market in palladium is so the collusive commercial traders of whatever stripe can manage its price.
In platinum the Managed Money traders increased their net long position by 1,102 COMEX contracts during the reporting week -- and are net long platinum by 9,787 contracts. The traders in the Other Reportables and Nonreportable/ small trader category remain net long platinum by very respectable amounts as well. All of this, like it is in gold and silver, is a big "up yours" to the collusive commercial traders -- and why it's their No. 2 problem child after silver.
The commercial traders in the Producer/Merchant category in platinum are net short 12,343 COMEX contracts. The Swap Dealers are net short platinum by 7,505 COMEX contracts.
In September's Bank Participation Report, the world's banks...20 of them in total...were net short 28.1 percent of total open interest in platinum in the COMEX futures market...down a lot from the 38.2 percent they were short in August's.
In copper, the Managed Money traders increased their net long position by 9,272 COMEX contracts during the past reporting week -- and are now net long copper by 82,154 contracts...2.054 billion pounds of the stuff. The traders in the Other Reportables and Nonreportable categories are net long copper by a bit as well.
Copper, like palladium, continues to be a wildly bifurcated market. The Producer/Merchant category is net short a whopping 111,865 copper contracts/2.797 billion pounds -- while the Swap Dealers are net long 7,221 COMEX contracts/180 million pounds of the stuff. So it's the commercial traders in the Producer/Merchant category that are short against every other group of traders...including the commercials in the Swap Dealer category.
Whether this dichotomy in copper means anything or not, will only be known in the fullness of time. Ted Butler said it didn't mean anything as far as he was concerned, as they're all commercial traders in the commercial category. But this bifurcation has been in place for as many years as I've been keeping records -- and that's a very long time....10+ years.
In this vital industrial commodity, the world's banks...both U.S. and foreign... were net short copper by 8.4% of total open interest in the September Bank Participation Report...up from the 7.6% they were short in the August BPR. As the copper price continues to rise...the banks continue to sell into its rally.
It's also worth noting that in September's Bank Participation Report on Tuesday...5 U.S. banks were net long copper by 7,202 COMEX contracts...while 18 non-U.S. banks were net short copper by 30,940 contracts.
At the moment it's mostly the commodity trading houses such as Glencore and Trafigura et al., along with some hedge funds, that are mega net short copper in the Producer/Merchant category, as the Swap Dealers are net long, as pointed out above.
The next Bank Participation Report for September is scheduled to be out on Friday, October 9.

Here’s Nick Laird’s “Days to Cover” chart, updated with the COT data for positions held at the close of COMEX trading on Tuesday, September 8. It shows the days of world production that it would take to cover the short positions of the Big 4 — and Big '5 through 8' traders in every physically traded commodity on the COMEX. This chart is a graphical representation of what's shown in the COT Report above. Click to enlarge.
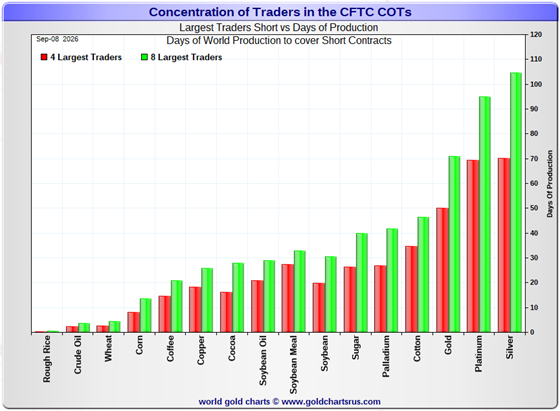
In this week's data, the Big 4 traders are short about 70 days of world silver production...up about 1 day from last Friday's COT report. The ‘5 through 8’ large traders are short an additional 35 days of world silver production...also up about 1 day from the last report...for a total of 105 days that the Big 8 are short -- and up about 2 days from last Friday's report.
Those 105 days that the Big 8 traders are currently short, represents about 3.5 months of world silver production, or 242.635 million troy ounces/48,527 COMEX contracts. That's up from the 240.030 million troy ounces/48,006 contracts from last Friday's COT Report.
In gold, the Big 4 are short about 50 days of world gold production...up about 1 day from last Friday -- and the Big '5 through 8' are short an additional 21 days of world production...unchanged from last Friday's COT Report...for a total of 71 days of world gold production held short by the Big 8 commercial traders -- and obviously up 1 day from last Friday's report.
In silver, I believe that a goodly chunk of the gross short position in the Big 4 commercial category is mostly held by only two traders...both of them U.S. banks ...Wells Fargo and BofA I suspect.
In June's Bank Participation Report, 5 U.S. bullion banks held a gross short position of 12,884 COMEX silver contracts...down a whole bunch from May. But July's BPR showed that these same five U.S. banks increased their gross short position back up to 16,128 contracts...an increase of 3,244 COMEX contracts. In the August Bank Participation Report showed that the gross short position of the five U.S. banks was back down to 13,511 COMEX contracts... September's was back up to 15,819.
It's pretty obvious from these monthly changes that it's these 5 U.S. bullion banks that are controlling the silver price, which is no surprise.
This chart is also a graphical representation of why I consider platinum to be 'da boyz' No. 2 problem child after silver -- and it continues to be a big problem child.
And I also noted that cotton [for the fifth week in a row] has edged out palladium as the fourth most shorted commodity on the COMEX.
The short position in SLV now sits at 27.80 million shares/troy ounces as of the latest short report that came out on Thursday...for positions held at the close of trading on Monday, August 31. This represents an increase of a hefty 28.41% increase from the prior report -- and 5.10% of total SLV shares outstanding. This is not as off-the-charts grotesque and obscene as it once used to be -- but realistically should be around a fifth of that amount.
Please remember that there's not a single solitary troy ounce of silver backing any of these shorted shares as the SLV prospectus requires.
The next short report...for positions held at the close of business on Tuesday, September 15...is due out on Thursday, September 24.
In the overall in yesterday's COT Report, the short positions of the Big 8 commercial traders in silver showed a tiny increase -- and about 5,100 contracts above its lowest short position on record. The Big 8 short position in gold also increased by a bit -- and remains higher than the week after the late January crash. Of course the bear raids this past week will have helped the Big 8 somewhat in both these precious metals...but not by any earth-shaking amounts.
As Ted Butler pointed out quite often over the years, the resolution of the Big 4/8 short positions will be the sole determinant of precious metal prices going forward...although that short position in gold held by his raptors continues to be another negative factor...which increased by a noticeable amount during this past reporting week. However, under normal circumstances, it wouldn't be there at all...it would be a big long position.
And as he also pointed out over the years, there would come a time when what the numbers show in the COT Report won't matter, as events in the real world...whatever they may be...will overtake them. That hasn't happened yet...but that day is most certainly coming at some point.
All that we await, is the denouement that follows. The big bear raids we've endured over the last many months, weeks and again in the last few days... are all part and parcel of the process to keep their respective prices in line until that moment arrives. And whether these budding rallies that began a month or so ago is the start of it or not, remains to be seen. If this is the beginning , then 'da boyz' have been fighting it all the way up.

The September Bank Participation Report [BPR] data is extracted directly from last Friday's Commitment of Traders Report...because it wasn't posted on the CFTC's website until this past Tuesday for whatever reason...so I couldn't include it in last Saturday's column...so here it is now.
It shows the number of futures contracts, both long and short, that are held by all the U.S. and non-U.S. banks as of the Tuesday, September 1 cut-off in all COMEX-traded products.
For this one day a month we get to see what the world’s banks have been up to in the precious metals -- and they're usually up to quite a bit.
[The September Bank Participation Report covers the four-week time period from August 4 to September 1 inclusive]
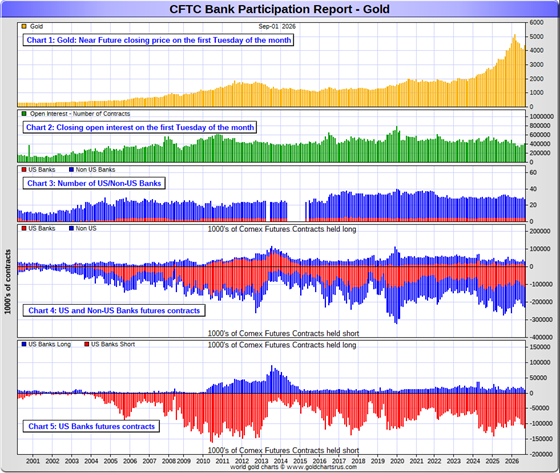
In gold, 5 U.S. banks are net short 103,686 COMEX contracts, up a further and hefty 17,450 contracts from the 86,236 they were short in the August report. This is their largest short position since July 2025.
Also in gold, 22 non-U.S. banks are net short 99,248 COMEX contracts, up a further 1,917 contracts from the 97,331 contracts that 24 non-U.S. banks were net short in August's BPR -- their largest net short position since the January26 BPR for December25.
At the low back in the August 2018 BPR...these non-U.S. banks held a net short position in gold of only 1,960 contacts -- so they've been back on the short side in a gargantuan way ever since. Only a handful of these banks hold meaningful short positions in gold. The short positions of the rest are of no consequence -- and never have been.
Although almost all of the largest U.S. and foreign bullion banks are in the Big 10-11 short category in gold, the odd hedge fund/commodity trading house is short large amounts of gold in that category as well. There's also the possibility that the BIS could be short gold in the COMEX futures market.
As of September's Bank Participation Report, 27 banks [both U.S. and foreign] were net short 48.9 percent of the entire open interest in gold in the COMEX futures market...down a bit from the 49.4 percent that 29 banks were net short in the August BPR. The only reason the percentage is down -- and not up, is because of the huge increase in total open interest during August, which obviously affects the percentage calculation.
In last Friday's COT Report, the commercial net short position in gold was 63.8 percent of total open interest -- and if you subtract out the 48.9 percent held short by the banks...only 63.8-48.9=14.9 percentage points of the commercial net short position in gold is not held by the banks. How's that for a concentrated and manipulative short position?
Here’s Nick’s BPR chart for gold going back to 2000. Charts #4 and #5 are the key ones here. Note the blow-out in the short positions of the non-U.S. banks [the blue bars in chart #4] when Scotiabank’s COMEX short position was outed by the CFTC in October of 2012. Click to enlarge.
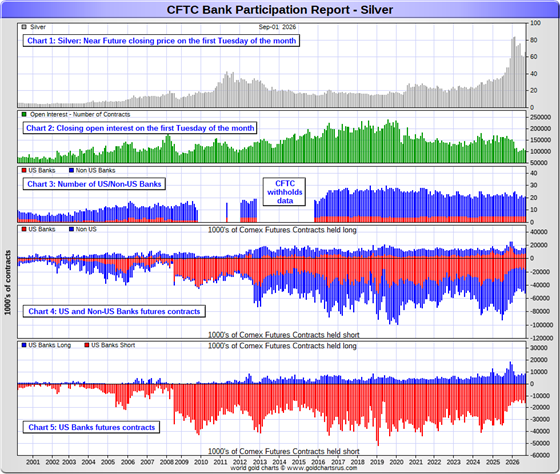
In silver, 5 U.S. banks are net short 7,242 COMEX contracts...up 885 contracts from the 6,357 contracts they were net short in the August BPR...still ultra low, but about 6,500 contracts above their record low of December of last year.
But the number I really wanted to see was the change in their gross short position. In the June BPR, that number was down to 12,884 contracts which was, without doubt, their lowest gross short position in silver, ever. July's BPR showed that it had jumped back up to 16,128 COMEX contracts...which I wasn't happy to see. In August's BPR, the gross short position held by these five banks was back down to 13,511 COMEX contracts...but in September's, it was up to 15,819 contracts.
These same five U.S. banks hold a gross long position of 8,577 COMEX contracts in the September BPR -- and it's a given that they're not divided up equally between them. I figure that the two U.S. banks that hold the biggest short positions in silver, don't hold much of a long position in it.
The five U.S. banks that are net short silver would be Citigroup, Wells Fargo, Bank of America, Goldman Sachs -- and Morgan Stanley...with by far the lion's share held by no more than two of these banks...most likely BofA and Wells Fargo...although I have my suspicions about JPMorgan from time to time.
Also in silver, 16 non-U.S. banks are net short 28,218 COMEX contracts, up 1,745 contracts from the 26,473 contracts that 15 non-U.S. banks were net short in the August BPR.
It's a given, based on silver deliveries in 2025 -- and so far in 2026...that HSBC, Barclays, Standard Chartered, BNP Paribas, Deutsche Bank and Macquarie Futures hold by far the lion's share of the short positions of these non-U.S. banks. Canada's Bank of Montreal is a card-carrying member of this group as well.
And, like in gold, the BIS could also be actively shorting silver. However, the remaining short positions in silver, divided up between the remaining 10 or so non-U.S. banks, are immaterial — and have always been so....the same as most of the 22 non-U.S. banks in gold as well.
As of September's Bank Participation Report, 21 banks [both U.S. and foreign] were net short 33.9 percent of the entire open interest in silver in the COMEX futures market — up from the 29.3 percent that 20 banks were net short in the August BPR.
Here’s the BPR chart for silver. Note in Chart #4 the blow-out in the non-U.S. bank short position [blue bars] in October of 2012 when Scotiabank was brought in from the cold. Also note August 2008 when JPMorgan took over the silver short position of Bear Stearns—the red bars. It’s very noticeable in Chart #4—and really stands out like the proverbial sore thumb it is in chart #5. Click to enlarge.
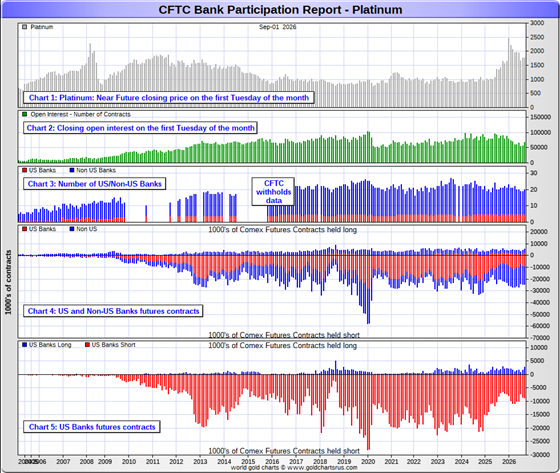
In platinum, 5 U.S. banks are net short 6,011 COMEX contracts in the September BPR, down 783 contracts from the 6,794 contracts that these same 5 U.S. banks were short in the August BPR.
At the 'low' back in September of 2018, these U.S. banks were actually net long the platinum market by 2,573 contracts...so they still have more work to do to get back to market neutral...if they ever intend to.
Also in platinum, 15 non-U.S. banks decreased their net short position by a piddling 361 contracts... from 13,490 contracts held by 14 non-U.S. banks in August's BPR...down to 13,129 contracts in September's BPR. This is 5.37x the amount they held short at their low in the May/25 BPR, so they've been gone back on the short side in platinum by a huge amount since then.
Back in the December 2023 BPR, these non-U.S. banks were net short a microscopic 35 platinum contracts...so they have yeoman work to do if they ever want to get back to even close to that number. I doubt that they'll ever accomplish that -- and are permanently stuck with this short position.
As you know, platinum remains the big commercial shorts No. 2 problem child after silver -- and there's now a long-term structural deficit in it [and palladium] as well.
As of September's Bank Participation Report, 20 banks [both U.S. and foreign] were net short 28.1 percent of platinum's total open interest in the COMEX futures market, down big from the 36.3 percent that 19 banks were net short in August's BPR -- and mostly down that much because of a big increase in total open interest during the reporting month...which affects the percentage calculation.
Here's the Bank Participation Report chart for platinum. Click to enlarge.
In palladium, 5 U.S. banks are now net short 58 COMEX contracts in the September BPR, a decrease of 129 contracts from July...when they were net long palladium by 71 contracts.
Also in palladium, 14 non-U.S. banks are net short 1,180 COMEX contracts... an increase of 363 contracts from the 817 contracts that 12 non-U.S. banks were net short in the August BPR.
None of this mean anything considering how tiny these amounts are... especially when divided up between 19 banks.
And as I've been commenting on for almost forever, the COMEX futures market in palladium is a market in name only, because it's so illiquid and thinly-traded. Its total open interest in last Friday's COT Report was only 16,497 contracts...compared to 68,059 contracts of total open interest in platinum...104,362 contracts in silver -- and 415,196 COMEX contracts in gold.
Total open interest in palladium has increased quite a bit over the last ten or so years, because I remember when it was less than 9,000 contracts on average. So it's nowhere near as illiquid as it used to be -- and it's also been helped along by the fact that the bid/ask is now down to only 40 bucks. It used to be $150 at one point way back when.
As I say in this spot every month, the only reason that there's a futures market at all in palladium, is so that the Big 8 commercial traders can control its price. That's all there is, there ain't no more.
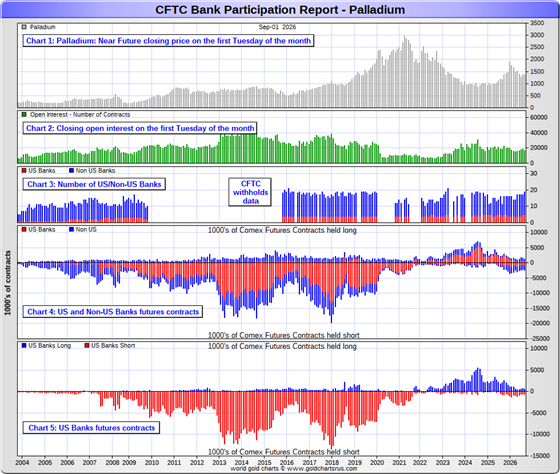
As of this Bank Participation Report, 19 banks [both U.S. and foreign] are net short 7.5 percent of total open interest in palladium in the COMEX futures market...up an insignificant amount from the 4.0 percent of total open interest that 17 banks were net short in the August BPR.
For the last 6+ years, the world's banks have not been involved in the palladium market in a material way...see its chart below. With all the world's banks basically market neutral from a COMEX futures market perspective...it's only the Managed Money traders that are net short now.
The Big 8 shorts in palladium, none of which are banks, are net short 44.2 percent of total open interest in palladium as of last Friday's COT Report ...up from the 41.1 percent of total open interest they were short a month ago.
Here’s the palladium BPR chart -- and it remains to be seen if 'da boyz' return as big short sellers again at some point like they've done in the past. Click to enlarge.
Excluding palladium for obvious reasons, most likely no more than a dozen or so banks in total -- and mostly U.S. and U.K.-based...along with French bank BNP Paribas and Deutsche Bank...continue to hold meaningful short positions in the other three precious metals...although I won't let Canada's Bank of Montreal or Australia's Macquarie Futures off the hook just yet.
As I pointed out above, some of the world's commodity trading houses and hedge funds are also net short the four precious metals. They have the ability to affect prices if they choose to exercise it. But it's still the collusive Anglo/ American/Western bullion bank cartel in the commercial category that are at Ground Zero of the price management scheme in the COMEX futures market. They are -- and remain, the not-for-profit/short sellers of last resort...until further notice.
And as has been the case for several decades now, the short positions held by the Big 4/8 traders is the only thing that matters...especially the short positions of the Big 4...or maybe only the Big 1 or 2 in silver. How this is ultimately resolved [as Ted kept pointing out] will be the sole determinant of precious metal prices going forward.
Considering the current state of affairs of the world as they stand today -- and the structural deficit in silver -- and now in platinum and palladium as well, the chance that these big bullion banks and commodity trading houses could get overrun at some point, is no longer zero -- and certainly within the realm of possibility if things go totally non-linear somewhere.
But...as Ted kept reminding us...if they do finally get overrun, it will be for the very first time. And it was patently obvious that the collusive commercial traders of whatever stripe had to step in multiple times this year so far... including this past week...in order to prevent exactly that from happening. If they hadn't, Ted Butler's "Bonfire of the Silver Shorts" would have become a reality within days...if not hours.
The next Bank Participation Report for trading in September is due out on Friday, October 9.

CRITICAL READS
Consumer prices rose 0.4% in August, as expected; core inflation was higher than estimated
Prices for a wide swath of goods and services continued to climb in August, according to a report Friday that raises the specter of a Federal Reserve interest rate hike next week.
The consumer price index rose a seasonally adjusted 0.4% for the month, putting the 12-month increase at 3.4%, the Bureau of Labor Statistics reported Friday. Both readings were in line with the Dow Jones consensus.
However, stripping out volatile food and energy prices, the core CPI posted a 0.3% monthly gain, or 0.1 percentage point higher than forecast. The core annual rate came in at 2.4%, matching the estimate.
The report is the final major inflation indicator the Fed will see before it holds its policy meeting next week, concluding Wednesday with a vote on its key interest rate.
Traders responded to the numbers by ramping up bets that the Federal Open Market Committee will increase its benchmark interest rate by a quarter percentage point. Odds for a hike jumped to nearly 90%, according to the CME Group’s FedWatch tracker of fed funds futures prices.
Another set of b.s. numbers in my opinion, dear reader. This CNBC story from yesterday now sports a new headline..."Inflation persisted in August, potentially locking in a Fed interest rate hike" -- and I'm sure the text has been changed as well from when it was originally filed at 8:32 a.m. on Friday morning EDT. I thank Swedish reader Patrik Ekdahl for sending it along -- and another link to it is here.
U.S. 2026 Budget Deficit Hits $1.97 Trillion With One Month Left; Interest At Record $1.4 Trillion
With DOGE disbanded more than a year ago, and tariffs struck down by the Supreme Court, the U.S. is no longer even pretending that there is any hope to normalize spending, or any kind of happy ending to the US debt trajectory.
At 2 p.m. today the U.S. Treasury published the latest, August, monthly budget deficit data, and it should come as no surprise to anyone that things are looking ever worse.
Total U.S. receipts were $360 billion, a modest improvement from the $344 billion a year ago, with individual income taxes accounting for $179 billion, or half of the total, and the bulk of the balance coming from Social Insurance and Retirement receipts of $141 billion.
On the spending side, things were ugly: total outlays were $527 billion, a modest improvement to the $689.1 billion a year ago, but much of that had to do with the calendar impact of tariffs.
Finally, turning to the elephant in the room, namely interest expense, in August the U.S. spent $98 billion on gross interest expense, which means that with 1 month left in fiscal 2026, total U.S. interest spending is now $1.267 trillion, up 12% from a year ago...
... while on an LTM basis, it is now a record $1.4 trillion, and is set to surpass Social Security (which was $1.66 trillion LTM but growing much slower), by the end of 2028.
And since 23% of marketable U.S. debt is now T-Bills, which will see an immediate impact from any Fed hikes, the moments the Fed raises rates, U.S. interest expense is going to rise even more sharply, signaling that while the debt endgame for the U.S. is guaranteed, the only question is whether Warsh will bring it on even faster.
This article showed up on the Zero Hedge website at 3:20 p.m. on Friday afternoon EDT -- and another link to it is here.
Credit crisis unfolding -- Alasdair Macleod
Usually, credit crises are in the private sector. Today, it’s a global government funding crisis from which there’s no rescue. Gold and silver are the escape route.
This week brought the beginning of a government financing train-wreck to public attention, affecting all G7 nations. That it is only the start of a crisis is the key point, as our oft repeated chart below has been clearly demonstrating since the forty-year downtrend in bond yields was comprehensively broken in 2022...Click to enlarge.
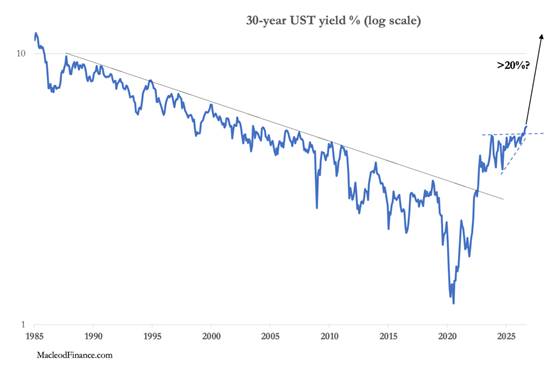
It has clearly broken out on the upside. The reason is simple and always leads to the end of a currency’s existence: the accumulation of government debt. A fiat currency is the politicians’ licence to spend without limitation — until suddenly they cannot. They then face a debt trap which is the public sector equivalent of insolvency and bankruptcy, in which the higher the bond yield goes, the higher it must go again. That is where we are now.
President Trump’s promise this week to reward all U.S. citizens with $5,000 each if they elect Republican majorities in both houses in the midterms adds a further $1.2 trillion to the existing estimated U.S. budget deficit of over $2 trillion, which Treasury Secretary Bessent can’t even fund. As a politician, Trump is not alone in failing to grasp the existential importance of the financial crises facing his government.
This very worthwhile article from Alasdair showed up on his website on Friday morning EDT -- and it's posted in the clear on the gata.org Internet site. Another link to it is here.
Bonds Taking Charge...and the Q2 ’26 Z.1 -- Doug Noland
The global bond market rout this week showed signs of turning disorderly. Ten-year Treasury yields traded to 4.98% intraday Friday, within a basis point of a 19-year high from October 19, 2023. Ten-yield yields ended the week 18 bps higher at 4.97%. Two-year Treasury yields surged 26 bps to 4.63%, while benchmark MBS yields spiked 26 bps to 6.03% (yields up 39 bps in 10 sessions), the high back to January 2025. “Municipal Bond Yields Soar to Highest Since 2011 in Rout.”
The rates market ended the week pricing 2.0 hikes by year end, up from the 1.35 at Monday’s close. CPI up 3.4% y-o-y and PPI 4.6% higher are a problem. University of Michigan one-year inflation expectations jumped a stronger-than-expected 0.6 during September to 4.6%.
Things were just as bad – for some even worse – overseas. French 10-year yields spiked 26 bps to 4.45% - the high back to August 2008. Italian yields rose 20 bps to 4.35% (3-yr high), while Greek yields jumped 22 bps to 4.22% (3-yr high). German yields gained 17 bps to 3.50% (high since August 2009). UK yields surged 21 bps to 5.34% - the high back to July 2007.
Australian 10-year yields jumped 17 bps to 5.37%, with New Zealand yields 24 bps higher at 5.02%. South Korean yields rose 14 bps to 4.52%.
With the yen rallying 1.7% this week, pressure is building in the beloved “carry trade” universe.
Bond markets recognize the likelihood of a prolonged conflict in the Middle East, with potentially dire inflation ramifications. Crude oil (WTI) surged 9.4% this week to surpass $100. Diesel prices jumped to $6 a gallon.
The Trump administration, facing potential war escalation through the midterms, appears increasingly desperate. The Treasury Secretary’s fading market credibility is visible to all.
Doug's weekly market commentary is always a must read for me -- and this week's missive certainly falls into that category. Another link to it is here.
Three informative and worthwhile video interviews
1. The End of Ukraine: Why NATO Can’t Stop Russia’s Demands -- Scott Ritter
This excellent 26-minute video interview is a clip from a much longer interview with former U.S. Marine intelligence officer and U.N. weapons inspector Ritter on Friday. Nima Alkhorshid is the host -- and I thank Guido Tricot for sharing it with us. The link to it is here.
2. NATO Expansion Backfired; Is Netanyahu Pushing Towards WWIII ? -- Professor Jeffrey Sachs
This interesting and informative 31-minute video interview with the professor was hosted by Judge Andrew Napolitano. It was posted on the youtube.com Internet site on Friday morning EDT -- and I thank Guido for this one -- and the on that follows. It's worth your time if you have the interest -- and the link to this one is here.
3. INTEL Roundtable : w/Larry Johnson, Ray McGovern & 9/11 Whistleblower Coleen Rowley
This worthwhile 28-minute video interview with the above three guests was hosted by Judge Napolitano very late on Friday afternoon EDT -- and is worth watching if you have the interest. The link to it is here.
Oil markets face new threat as Houthis advance on another vital shipping route
The Iran-backed Houthis reportedly advanced to Yemen’s strategic Perim Island on Friday, delivering a major boost to the militant group’s push to take control of one of the world’s most important shipping choke points.
The capture of Perim Island, which was reported by several news agencies, citing multiple Yemeni government sources, comes just one day after the Houthis seized Yemen’s port city of Mokha on the Red Sea coast. CNBC could not independently confirm the report.
The rapid ground offensive is seen as a severe setback to Saudi Arabia and the Yemeni forces it backs and puts Iran and its proxies on course to exercise control over two critically important oil choke points on either side of the Arabian Peninsula: the Bab el-Mandeb Strait and the Strait of Hormuz.
Perim Island is a small and rocky area of land that divides the Bab el-Mandeb Strait, a waterway that connects the Red Sea to the Gulf of Aden and to global markets.
There are concerns that the Houthis advance toward the Bab el-Mandeb Strait could have significant ramifications for global trade, particularly if the militant group ratchets up threats or attacks on Red Sea shipping.
This news item put in an appearance on the cnbc.com Internet site at 4:24 a.m. EDT on Friday morning -- and was updated about six hours later. It's another offering from Patrik Ekdahl -- and another link to it is here. The Zero Hedge article on this is headlined "U.S. Officials Confirm Saudi East-West Pipeline Attacked By Drones, Badly Damaged" -- and linked here.
Kalshi Launches 'Perps' for Gold and Silver Following CFTC Approval, Expanding Futures Offerings
Kalshi has won approval to list perpetual futures tied to precious metals gold and silver in the U.S., in the latest development as the company seeks to grow its trading offerings beyond prediction markets.
The listing was originally filed in July. The Commodity Futures Trading Commission -- which regulates derivatives contracts -- approved the listing of the perpetuals this week.
The new markets for the contracts launched today on the site.
Kalshi first received approval to list perpetual futures tied to cryptocurrencies in late May, bringing the novel asset class with $90 trillion in annual volume in 2025 onshore to the U.S. for the first time. Since then, the contracts have done $44 billion in notional volume, according to the platforms website.
Udesh Jha, chief risk officer at Kalshi Klear, the exchanges clearing house, said the company moved to have this be their next asset to offer perpetual futures for due to high interest in the commodities.
"Metals, especially gold and silver, have a story to tell because of inflation," he said.
Although these contracts won't set the price of gold or silver, it's just "More gold and silver investment money being diverted from metal, to the imaginary" as GATA secretary/treasurer Chris Powell pointed out. Another link to it is here.
Chinese miner takes Belt and Road to Papua New Guinea with $453 million gold deal
A Chinese state-backed resources group has cited Beijing's flagship Belt and Road infrastructure and influence initiative as the reason it is spending more than $1 billion acquiring mines and port projects across three islands in Papua New Guinea, largely from Australian companies.
Lingbao Gold, which is listed in Hong Kong but backed by a municipal council in the Henan province, on announced today it would become the dominant player on PNG's Simberi Island after agreeing to pay ASX-listed St. Barbara $453 million for its 40% stake in the asset.
The acquisition comes after Lingbao paid $389 million for its initial 40% stake in Simberi earlier this year and means the Chinese group will take over a $US275 million ($380 million) project to expand the mine and build a wharf that can enable larger ships to dock at the island.
This gold-related news item was posted on the afr.com Internet site on Thursday -- and I found it embedded in a GATA dispatch. Another link to it is here.
Gold ETFs Just Had Their Second-Biggest Month Ever With $18 Billion Inflow
Global gold exchange-traded funds (ETFs) pulled in $18 billion in August, the second-largest monthly inflow on record, lifting collective holdings to an all-time high of 4,189 tonnes.
The World Gold Council published the figures this week. Total assets under management (AUM) rose 16% month over month to $615 billion, helped by a higher gold price.
Western Buyers Return to Gold in Force
European funds drove the month with $7.9 billion of buying, their strongest on record, according to Councildata. The U.K. supplied $4.4 billion of that total, its second-largest month ever. France added $1.5 billion, a national record.
North American funds attracted $7.7 billion. This marked their third-largest monthly haul. Demand stayed muted early on before accelerating during the week of August 17, when funds absorbed roughly $4 billion in five trading days. This came around the same time as the Treasury expanded its debt buyback.
That burst mattered for the annual picture. It offset the region’s record $13 billion outflow in March and pushed North American flows back into positive territory for the year.
Asian funds added $2 billion, their best month since February. China again led the region, where stabilising local prices drew investors back. The country’s central bank has extended its own buying streak.
This gold-related story put in an appearance on the mitrade.com Internet site on Thursday -- and I found it on Sharps Pixley. Another link to it is here.

QUOTE of the DAY

The WRAP
"Understand this. Things are now in motion that cannot be undone." -- Gandalf the White
Today's pop 'blast from the past' is from 48 years ago -- and I keep wondering how this is possible. It was composed by Barry Gibb of the Bee Gees -- and the title track of a smash hit musical motion picture that came out that year. One of the hallmark voices of our generation provides the vocals. It's instantly recognizable -- and the link is here. I just knew that infusion26 would have a bass cover for this -- and the link to that is here.
Today's classical 'blast from the past' is one I've featured before -- and I stumbled across it earlier in the week -- and the die was cast after I listened to the whole thing.
Piano Concerto No. 2 in G minor, Op. 22 by Camille Saint-Saëns was composed in 1868 and is hands-down Saint-Saëns' most popular piano concerto.
At its première on 13 May of that year, the composer was the soloist and Anton Rubinstein conducted the orchestra. Saint-Saëns wrote the concerto in just three weeks and had very little time to prepare; consequently, the piece was not initially successful. The capricious changes in style provoked Polish composer and pianist Zygmunt Stojowski to quip that it "begins with Bach -- and ends with Offenbach."
There's some truth to that, but that's beside the point here.
It's now a staple of the classical repertoire -- and requires a level of virtuosity that few classical pianists possess. But here's 12-years young Alexander Malofeev tossing it off like like a seasoned veteran three or four times his age. He caused a sensation within both the audience and orchestra. They ate him alive! He got a 4-minute standing ovation and 5 curtain calls at the end. He even dragged his music teacher out on stage for one of them. It's outstanding in every way possible -- and is my desert island recording of this work. The link is here...enjoy!
The President's Working Group on Financial Markets...brought into existence back in 1987 by President Ronald Reagan after the big crash of that year...was in full battle stations mode again yesterday.
They did everything in their power to keep investors out of the precious metals space -- and were even more egregious in their management of their associated equities. I could not believe that they had the cojones to close the silver stocks down on the day, but that's what they did.
As Chris Powell said back almost 20 years ago now..."There are no markets anymore...only interventions."
But despite the managed price action, I was somewhat surprised that the volumes traded in both silver and gold were not overly heavy...not even close...so that made it much easier for the collusive commercial shorts of whatever stripe to manage their respective prices.
Last night's Preliminary Report showed that gold open interest declined by less than 500 contracts -- and down only 12 contracts in silver. So all the price antics on Friday certainly didn't net out to much. Of course there could have been more significant changes buried out of sight -- and if there were, that won't be visible until next Friday's COT Report.
Although platinum closed higher on the day in the spot market, it closed down a dime in its current front month. Palladium's gain on Friday managed to get it back above its 50-day moving average by a bit.
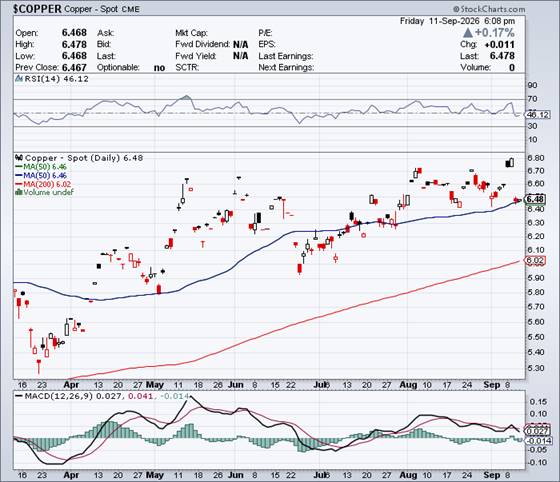
Copper gained back 1.1 cents of its 35 cent 'loss' of Thursday -- and is now 2 cents above it 50-day moving average.
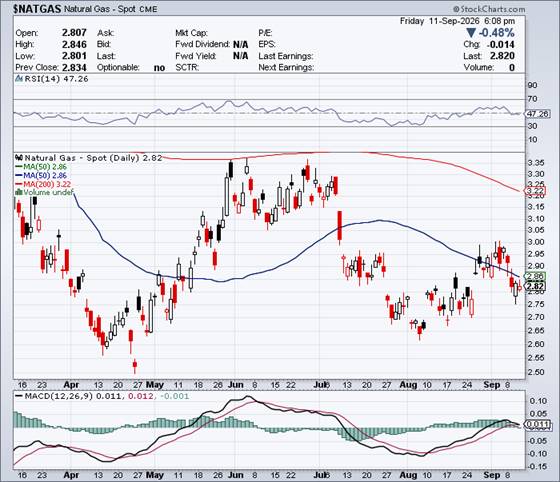
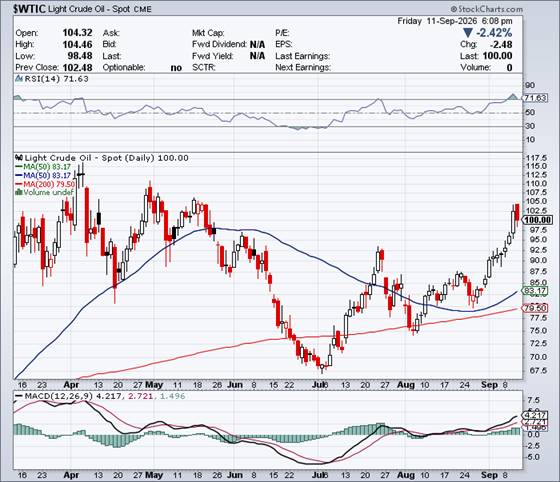
Natural gas [chart included] added another 1.2 cents onto a similar gain it had on Thursday. It finished the Friday session at $2.82/1,000 cubic feet -- and is still some distance below any moving average that matters. WTIC, which was well into overbought territory on its RSI trace after its gains up until Thursday, was closed lower by $2.48 -- and is sitting right at $100.00/barrel.
Here are the 6-month charts for the Big 6+1 commodities for Friday and, once again, the silver candle doesn't show its entire intraday price move. Click to enlarge.
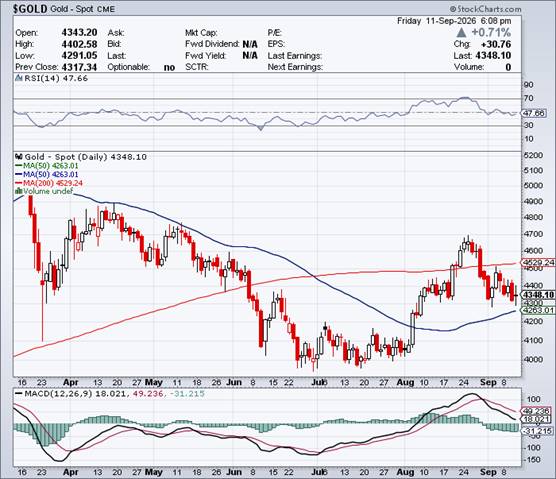
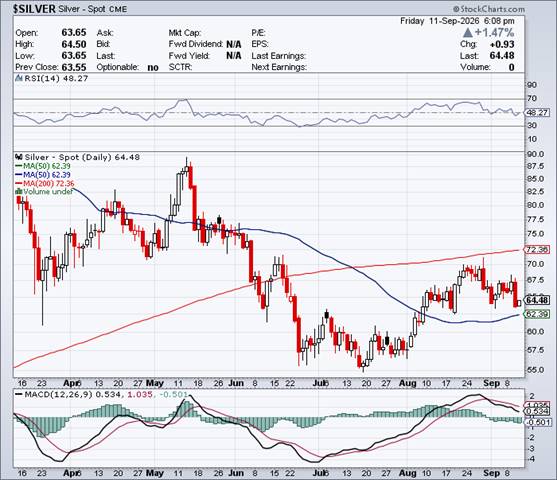
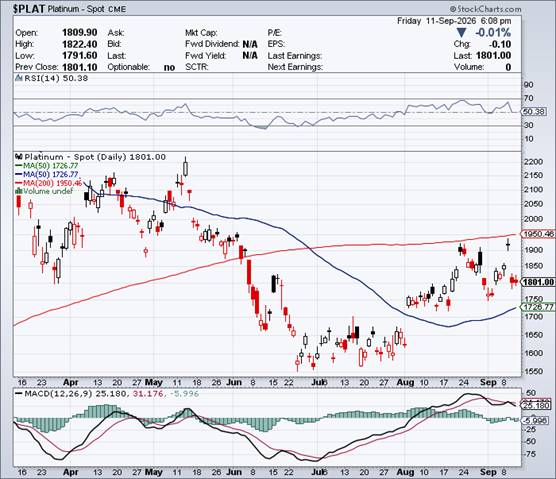
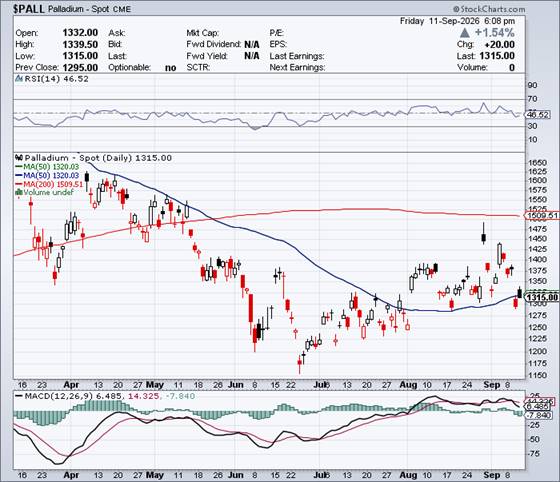
It was back in late 2025 the I started to make comments on what was happening in the precious metals equities space -- and said that they were being actively managed back then...starting in earnest in the silver space in mid September. That turned out to be the case -- and as the current year progressed it has became even more obvious.
This week it was in your face on both Wednesday and yesterday.
Rising bond yields across the west...accompanied by the ham-handed 'rescue' attempt of the Japanese yen back in late July...are the fore-shocks of the approaching demise of the 50+ year experiment with our global fiat currency system.
As Alasdair Macleod stated in his excellent article in the Critical Reads section further up...
"This week brought the beginning of a government financing train wreck to public attention, affecting all G7 nations. That it is only the start of a crisis is the key point, as our oft-repeated chart below has been clearly demonstrating since the 40-year downtrend in bond yields was comprehensively broken in 2022.
It has clearly broken out on the upside. The reason is simple and always leads to the end of a currency's existence: the accumulation of government debt.
A fiat currency is the politicians' licence to spend without limitation -- until suddenly they cannot. They then face a debt trap that is the public-sector equivalent of insolvency and bankruptcy, in which the higher the bond yield goes, the higher it must go again. That is where we are now."
And further down he states that..."It should become increasingly clear in the coming weeks that gold is the escape from escalating problems and rapidly rising risks associated with the global fiat currency regime. Higher bond yields are the wake-up call for complacent investors who fail to understand that rising gold and commodity prices reflect the decline in their own currency’s purchasing power and not speculation."
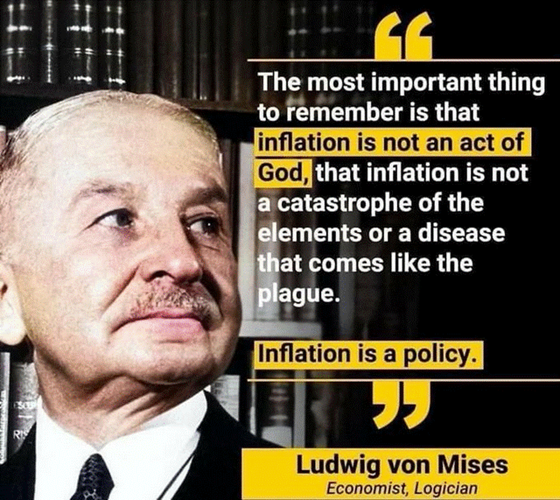
Of course Ludwig von Mises said it first way back when..."Once public opinion is convinced that the increase in the quantity of money will continue and never come to an end, and that consequently the prices of all commodities will not cease to rise, everybody becomes eager to buy as much as possible and restrict his cash holdings to minimum size... If the credit expansion is not stopped in time, the boom turns to [a] crack-up boom: the flight into real values begins, and the whole monetary system founders."
The interventions in the precious metals -- and their associated equities that we've been witness to since it all began to come unglued starting about a year ago, cannot last forever. The world's central banks, led by the U.S. Federal Reserve, are now all out of aces. Sooner or later the markets will simply overwhelm them. Any attempts to become even more draconian than they already are, will simply hasten their demise -- and the fiat currency system that underpins them.
The next FOMC meeting gets underway on Tuesday -- and we find out at 2:00 p.m. on Wednesday what Warsh & Co. have in store for us. A 25 basis point rate hike is expected...but that won't stop what Boston-based investment manager Lawrence Lepard calls "The Big Print"...which will have to unleashed between now and the mid-term U.S. elections.
It has already begun, but we've only seen the thin edge of the wedge of this so far. When it is finally let off its leash, then all the king's horse -- and all the king's men won't be able to stop the mad stampede into hard assets...which is already underway.
Before heading out the door, there are still those $92 and $100 October silver call options floating around...with 11,000+ contracts in each...along with those seemingly outlandish $15,000 and $20,000 December gold call options that are still there as well.
With the west's financial and monetary system melting down in front of it... China, with its suspected 20,000+ tonnes of gold tucked away, just watches and waits.
So do we.
I'm done for the day -- and the week -- and I'm still 'all in.'
See you Tuesday.
Ed
About the author

SUBSCRIBE: https://edsteergoldsilver.com/

Ed Steer’s Daily Analysis of the Gold and Silver Markets
After eight years of writing about the precious metals for Casey Research, the folks at Stansberry & Associates—who just recently purchased controlling interest in the company—decided that my ‘niche market’ column didn’t fit into their plans.
Since the time that Casey Research was kind enough to offer me a stand-alone column, it became their most highly-rated blog almost from the outset—and has remained that way up to this date...