Many of the top precious metal analysts state that gold is the premium asset and insurance hedge during a financial collapse. We hear this time and time again. However, if we look at the data during the near collapse of the U.S. Banking and financial system in 2008, gold wasn’t the most sought after precious metal.
Before the failure of Bear Stearns, Lehman Brothers, Merrill Lynch and AIG (2008), physical gold and silver investment was minimal. For example, in 2007 total physical gold investment was 438 metric tons (mt) while investors purchased 1,605 mt of silver. This translates to 14 million oz (Moz) of physical gold investment versus 51 Moz of silver.
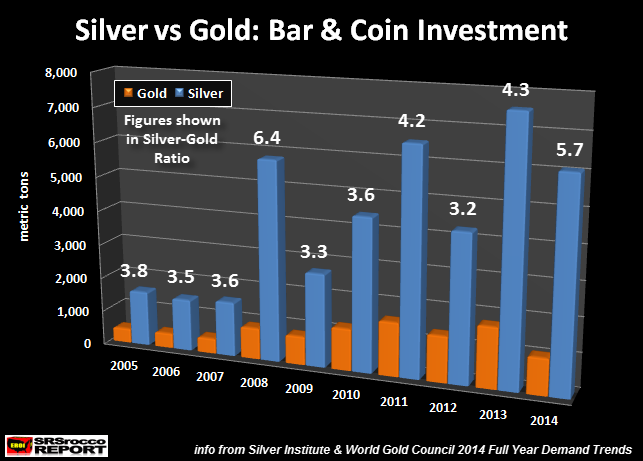
But, the very next year as the U.S. and world financial system experienced a heart attack, physical gold and silver investment surged. Even though physical gold investment more than doubled to 913 mt, silver investment demand skyrocketed to a stunning 5,826 mt. This can be clearly seen by the physical silver-gold investment ratio in the chart below:
Investors purchased 6.4 times more silver bar and coin than gold in 2008 compared to 3.6 times in 2007. Basically, gold bar and coin demand doubled in 2008 vs 2007, whereas physical silver investment nearly quadrupled. Then in 2009, overall physical precious metal investment demand (and the ratio) declined as the Fed and Central Banks used massive monetary injections to bring stability back into the global economic and financial system.
However, demand for physical gold and silver continued to increase along with the rise in the prices of the precious metals during the next two years. Shown in the table below, physical gold investment increased to 1,222 mt in 2010 and 1,569 mt in 2011, while silver surged to 4,457 mt and 6,550 mt respectively:
As the price of gold and silver remained in a narrow trading pattern in 2012, physical demand for the metals declined. Actually, demand for silver declined more in percentage terms than gold pushing the silver-gold ratio to a low of 3.2 that year. But during the great take-down in the prices of the precious metals in 2013, demand surged to new records for both. Investors purchased 1,765 mt of physical gold bar and coin (56.7 Moz) and a staggering 7,577 mt (243.6 Moz) of silver.
Unfortunately for the West, it was the Eastern investors taking advantage of the bargain basement prices. Here is the breakdown of 2013 gold bar and coin investment demand according to the World Gold Council:
EAST vs WEST Physical Gold Investment 2013
EAST = 1,054 mt
WEST = 337 mt
Note: EAST = (India, China, Japan, Indonesia, S. Korea, Thailand & Vietnam) West = (USA, France, Germany, Switzerland & Other Europe)
Lastly, physical silver investment was the second strongest compared to gold in 2014 as investors purchased 6,096 mt of silver compared to 1,064 mt of gold. Thus, the silver-gold ratio increased to 5.7 in 2014… the second highest in the decade.
In conclusion, the notion that gold is the premium SAFE HAVEN during times of financial crisis doesn’t seem to hold true if we go by the actual data. When the U.S. and world stood at the brink of a total economic and financial meltdown in 2008, investors overwhelming choose silver over gold. Which means, when the next much more dire financial crisis appears, physical silver demand will more than likely totally overrun supply.
Got Silver?
Please check back for new articles and updates at the SRSrocco Report. You can also follow us at twitter below:


