Silver investors have been getting increasingly frustrated in recent months as silver has basically done little, while Bitcoin, Blockchain and selected Biotech and Tech stocks have soared. We ourselves haven’t paid silver much attention because it has been so dull, and we learned some months back that we could make much bigger gains elsewhere for a while, especially in new Tech stocks. However, this does not mean that we have forgotten about it – rather we have been waiting for it to start entering a more dynamic phase, and as we will see in this update, that could happen quite soon, and even if it doesn’t silver and silver investments looks like they are at “buy spots” here.
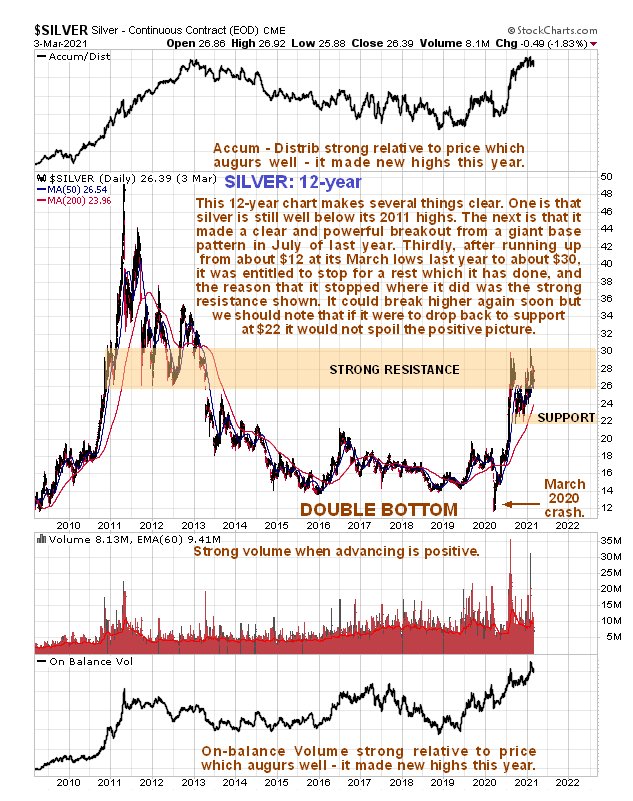
Let’s start by gaining a big picture perspective using the 12-year chart. On this we see that silver made a clear and decisive breakout from a giant Double Bottom base pattern last July. Observe the highly anomalous and false breakdown from this Double Bottom in March of last year at the time of the general market panic, that was swiftly and dramatically reversed when the Fed came riding to the rescue. Whilst the breakout led to rapid and substantial gains, silver slammed into heavy overhanging supply towards $30 that has kept a lid on the price ever since, and we can clearly see on this chart the origins of this resistance, which was the extensive trading above $30 back in 2011 and 2012. So what now? With the volume pattern positive and volume indicators bullish – both those shown broke above their 2011 highs this year – silver could now forge ahead, provided that a risk off environment is not triggered by rising rates. Here we should note that the bullish pattern in silver would not be damaged even if it dropped back to support at the lower boundary of its recent pattern at $22.
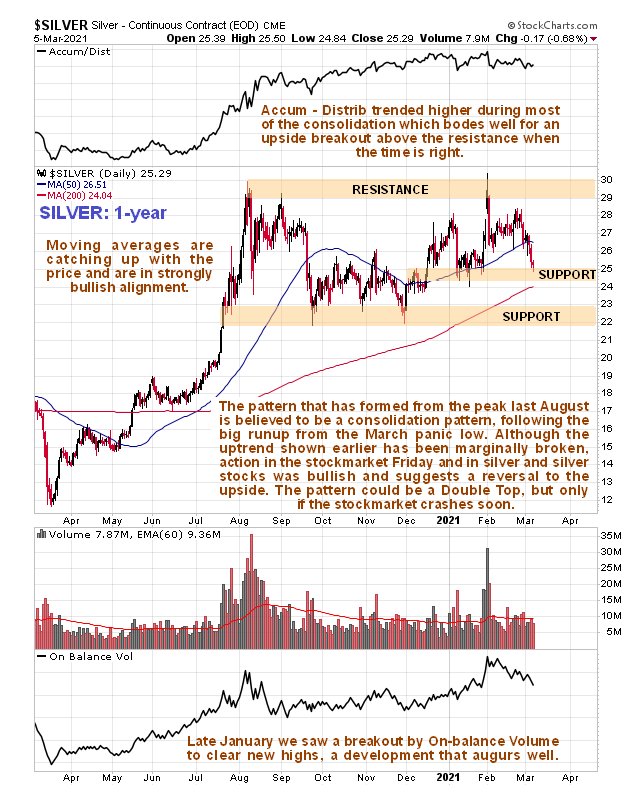
On the 1-year chart we can see the recovery out of the panic lows of March last year, the July breakout from the giant base pattern shown on the 10-year chart, the run to $30 that followed and after that the long consolidation pattern. A few days back on the site we had thought that a trendline drawn from the March lows might hold, and that if it failed, which it has in recent days, a drop back to the support at $22 would follow. However, this trendline was not very significant, which is why it isn’t drawn on this chart, and the action on Friday, not just in silver but in gold and the broad stockmarket too, coupled with the very bullish alignment of the moving averages, suggests that we just saw an intermediate low in silver on Friday, with many silver stocks giving a buy signal.
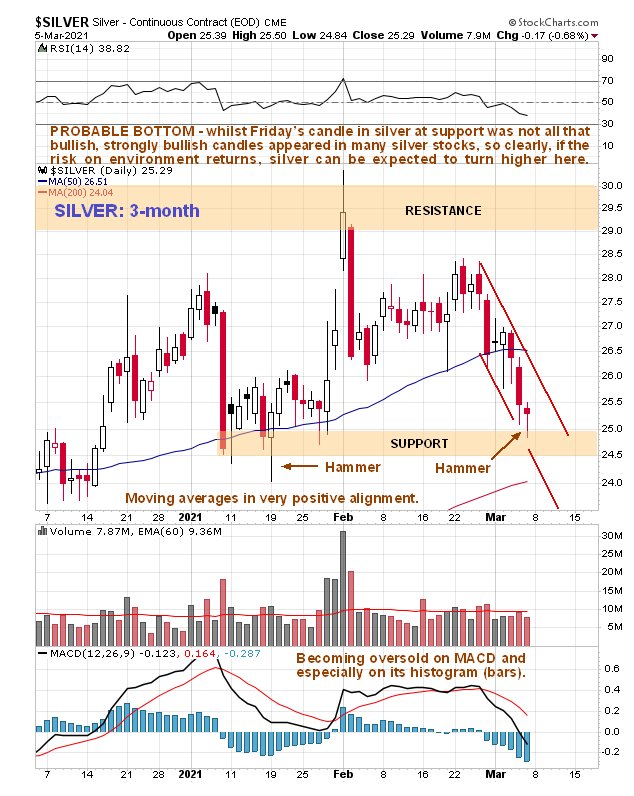
On the 3-month chart we can see recent action in much more detail. On this chart we can see how the minor downtrend of recent weeks has completely unwound its earner overbought condition and brought silver back to a zone of support in between its bullishly aligned moving averages, which means that it is at a good point to turn up again.
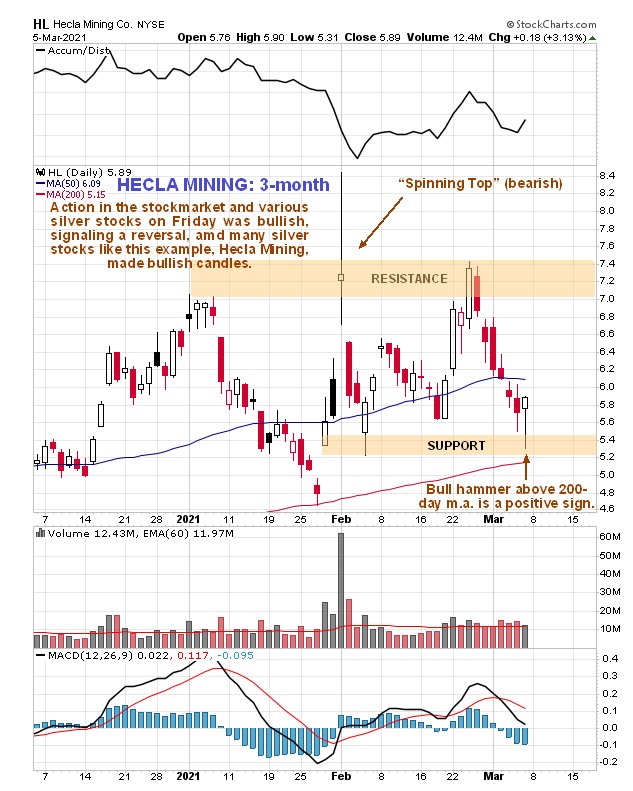
Various silver stocks made bullish looking candles on Friday, which of course increases the chances of the sector turning higher again here – here’s one example, Hecla Mining…
End of update.
About the author