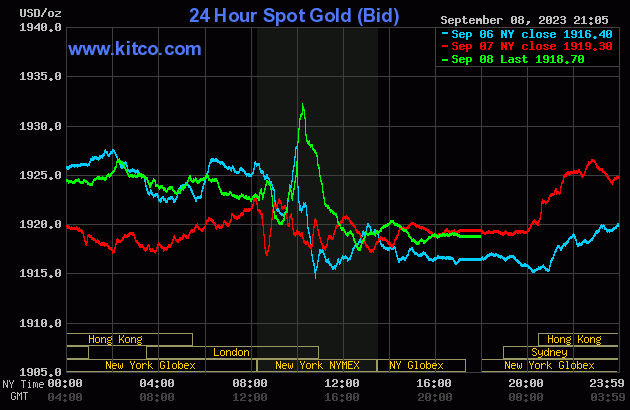
The gold price began to head higher starting at 8 a.m. China Standard Time in GLOBEX trading on their Friday morning -- and that uneven rally ended at the 2:15 p.m. afternoon gold fix in Shanghai when the dollar index began to 'rally'. From that juncture it was sold unevenly lower until it took off higher starting around 9:20 a.m. in COMEX trading in New York. The commercial traders of whatever stripe were forced to step in at 10:15 a.m. -- and from there they engineered its price lower until around 12:40 p.m. EDT. It then had a very broad and quiet up/down move until the market closed at 5:00 p.m.
The high and low ticks, both of which were set in COMEX trading in New York, were reported by the CME Group as $1,935.50 and $1,922.80 in the October contract -- and $1,954.00 and $1,940.80 in December. The October/December price spread differential in gold at the close in New York yesterday was $18.10 ...December/February was $19.90...February/April was $19.10 -- and April/ June was $19.90 an ounce.
Gold was closed on Friday afternoon in New York at $1,918.70 spot, down 60 cents from Thursday. Net volume in October and December combined was on the lighter side at just about 141,000 contracts -- and there were 4,400 contracts worth of roll-over/switch volume on top of that...almost all into the first three scheduled delivery months of the New Year.
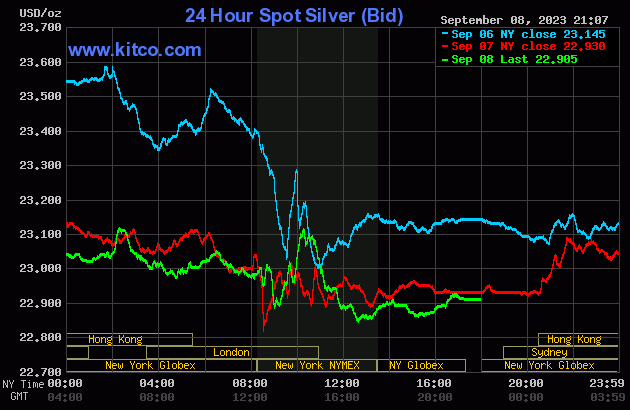
Silver's price path in GLOBEX and COMEX trading was guided in an almost identical fashion as gold's...including all its major price inflection points, so I'll spare you the play-by-play.
The high and low ticks in silver were recorded as $23.455 and $23.13 in the December contract. The September/December price spread differential in silver at the close in New York yesterday was 28.2 cents...December/March was 35.3 cents -- and March/May was 34.9 cents an ounce.
Silver was closed in New York on Friday afternoon at $22.905 spot, down 2.5 cents on the day. Net volume was very decent, relatively speaking, at a hair under 51,000 contracts -- and there were 1,800 contracts worth of roll-over/ switch volume in this precious metal...almost all into March.
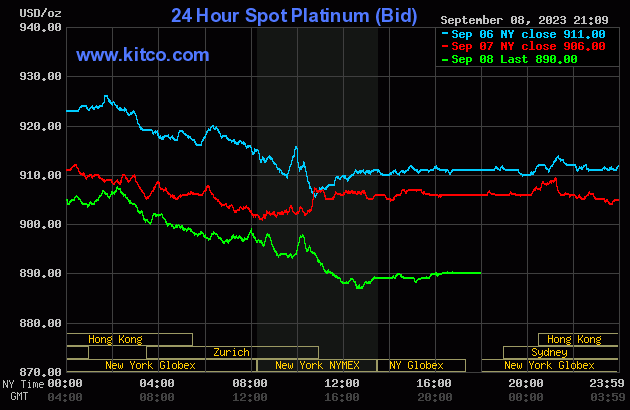
Platinum was up a few dollars in GLOBEX trading overseas going into the 2:15 p.m. afternoon gold fix in Shanghai -- and then 'da boyz' showed up in it as well. That price pressure continued until 12:40 p.m. in COMEX trading in New York. They backed off at that point -- and it then crawled a few dollars higher until trading ended at 5:00 p.m. EDT. Platinum was closed at $890 spot, down another 16 bucks.
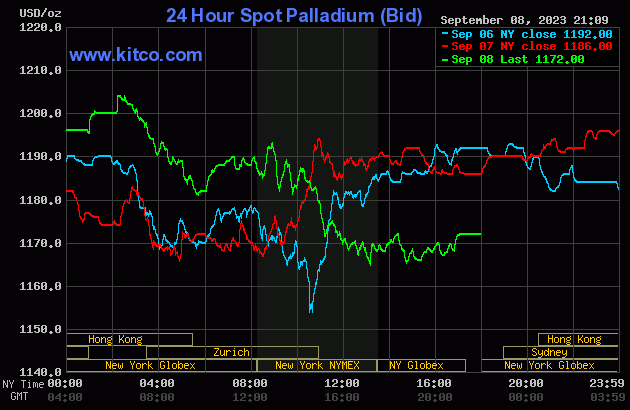
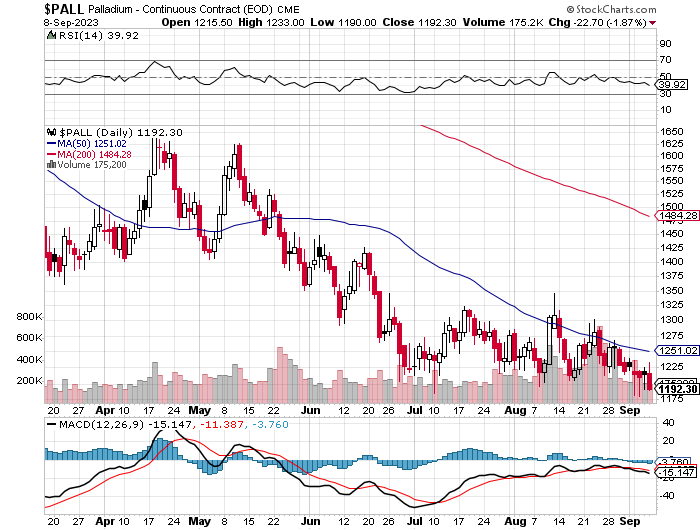
Palladium stair-stepped its way higher until the same time as the other three precious metals -- and its engineered price declined ended about twenty minutes before the 1:30 p.m. COMEX close in New York. Then, like platinum, struggled a few dollars higher until trading ended at 5:00 p.m. EDT. Palladium was closed at $1,172 spot, down another 14 dollars.
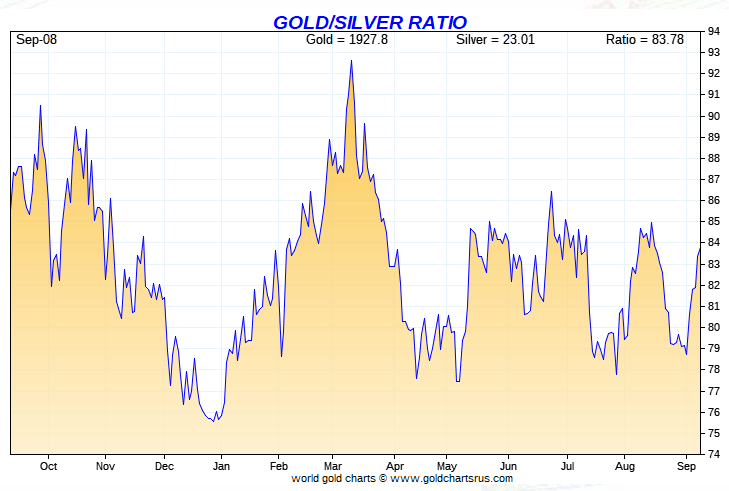
Based on the kitco.com spot closing prices in silver and gold posted above, the gold/silver ratio worked out to 83.8 to 1 on Friday...compared to 83.7 to 1 on Thursday.
Here's Nick Laird's 1-year Gold/Silver Ratio chart, updated with this past week's data. Click to enlarge.
![]()
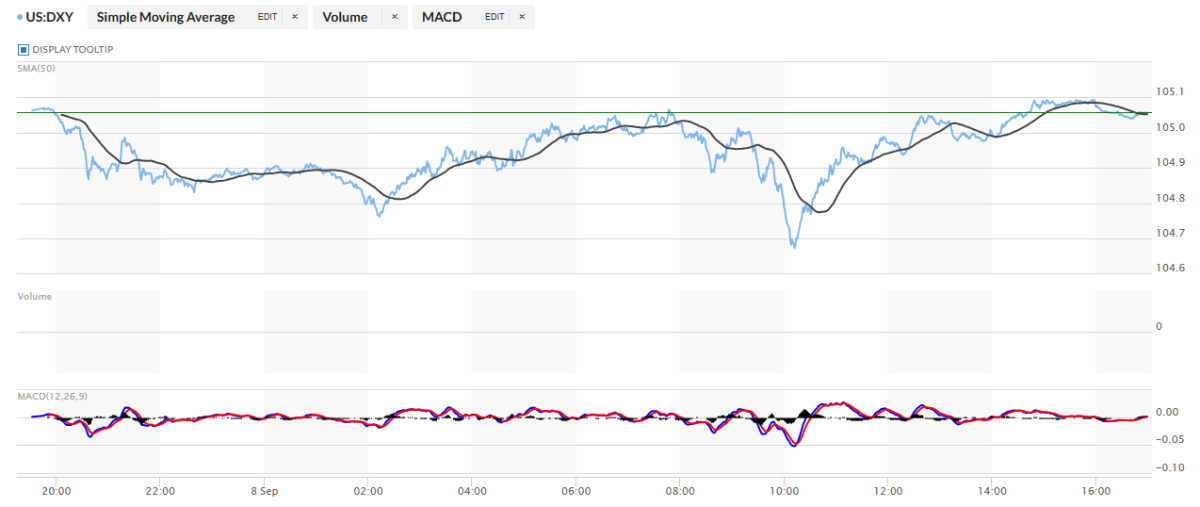
The dollar index closed very late on Thursday afternoon in New York at 105.06 -- and then opened unchanged once trading commenced at 7:32 p.m. EDT on Thursday evening, which was 7:32 a.m. China Standard Time on their Friday morning. It chopped quietly, unevenly and broadly lower from there until 2:13 p.m. CST...which I'm sure corresponded with their Shanghai afternoon gold fix. Its ensuing 'rally' from there came to an end around 12:47 p.m. in London -- and it was then sold lower until its low tick of the day was set at 10:12 a.m. EDT...gold and silver's high tick. Its ensuing 'rally' topped out around 2:50 p.m. -- and it sagged a bit from 4 p.m. onwards until trading ended at 5:00 p.m. EDT.
The dollar index finished the Friday trading session in New York at 105.06...exactly unchanged on the day.
Here's the DXY chart for Friday...courtesy of stockcharts.com as usual. Click to enlarge.
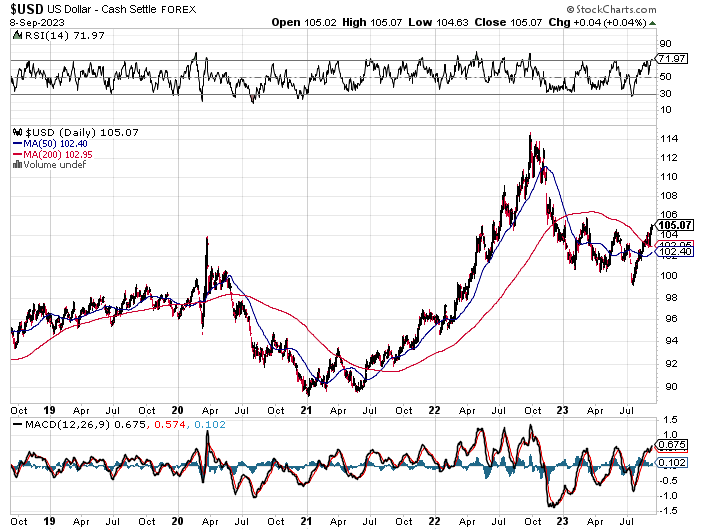
And here's the 5-year U.S. dollar index chart that appears in this spot every Saturday, courtesy of stockcharts.com as always. The delta between its close...105.07...and the close on the DXY chart above, was 1 basis point above its spot close. Click to enlarge.
There certainly was correlation between gold and silver prices yesterday, but it was far from exact from the DXY London high until both took off higher in early COMEX trading in New York. And except for their high ticks at the 2:15 p.m. CST afternoon gold fix in Shanghai, there was none at all in platinum and palladium after that.
U.S. 10-Year Treasury: 4.2580%...down 0.0020 (-0.05%)...as of 02:59 p.m. EDT
It was obvious from its chart that the Fed had to step in twice during the time that the treasury market was open in New York yesterday, or the 10-year would have certainly closed up on the day.
And here's the 5-year 10-year U.S. Treasury chart from the yahoo.com Internet site -- which puts the yield curve into a somewhat longer-term perspective. Click to enlarge.
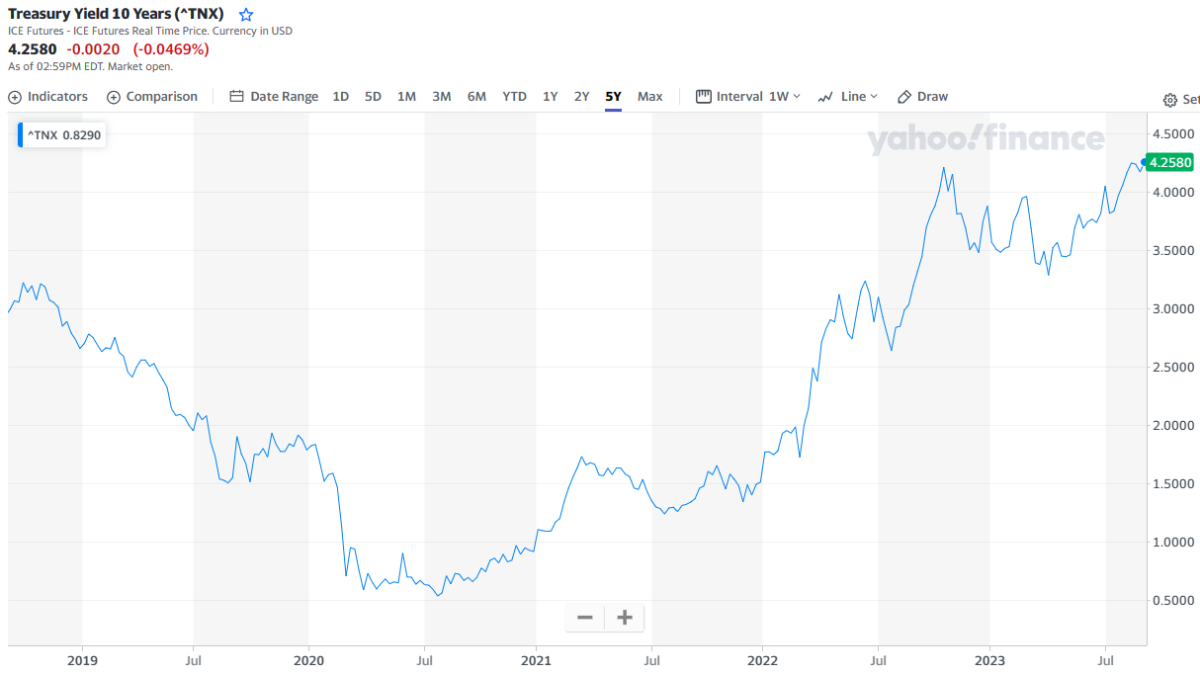
The Fed is still battling to keep the yield curve under control -- and with another interest rate increase most likely at their FOMC meeting later this month, it appears a certainty that the yield on the 10-year will rise even more. It remains to be seen how vigorously they fight it when that moment arrives.
![]()
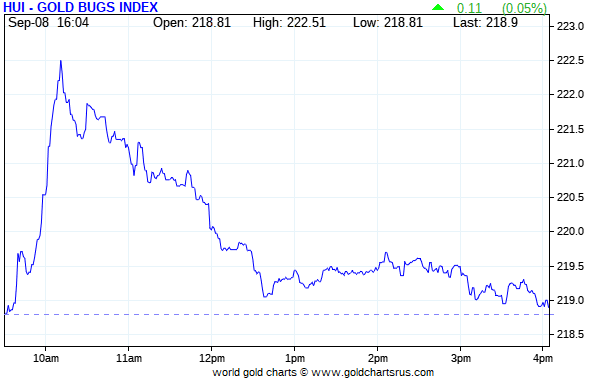
Not surprisingly, the gold shares took off higher at the 9:30 opens of the equity markets in New York on Friday morning -- and their highs came about five minutes or so before the gold price was capped at 10:15 a.m. EDT. From that point they were sold fairly aggressively lower until 12:45 p.m. Then, like the gold price itself, they had a very quiet up/down move until trading ended at 4:00 p.m. EDT. The HUI closed up 0.05 percent on the day...so call it unchanged.
Computed manually, the new Silver Sentiment/Silver 12 Index finished lower on the day by only 0.28 percent.
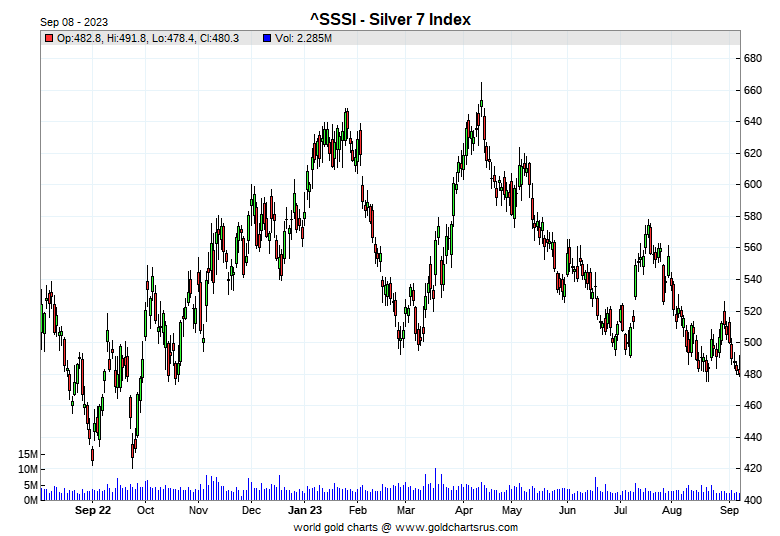
Here's Nick's old 1-year Silver Sentiment/Silver 7 Index chart, updated with Friday's candle. Click to enlarge.
The biggest underperformer was Coeur Mining, as it closed down 1.78 percent...but there were six of the twelve in the index that closed either unchanged or up small fractions of one percent on the day, which I found very encouraging.
The reddit.com/Wallstreetsilver website, now under new management, is linked here. The link to two other silver forums are here -- and here.
![]()
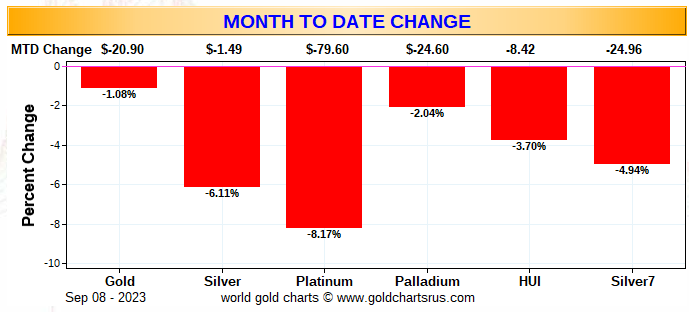
Here are two of the usual three charts that appear in every weekend missive. They show the changes in gold, silver, platinum and palladium in both percent and dollar and cents terms, as of their Friday closes in New York — along with the changes in the HUI and the old Silver 7 Index.
There's no weekly chart today, as Monday was the Labour Day holiday -- and Nick's formula includes the previous five business day, which would include Friday, September 1 in this data...making the weekly chart useless. It will be back in this spot next week.
Here's the month-to-date which is only six business days old and, it's no surprise that's it's wall-to-wall red...thanks to the Big 4/8 commercial shorts. Although the gold shares are down the least, the silver equities have 'outperformed' vs. the decline of its underlying precious metal. Click to enlarge.
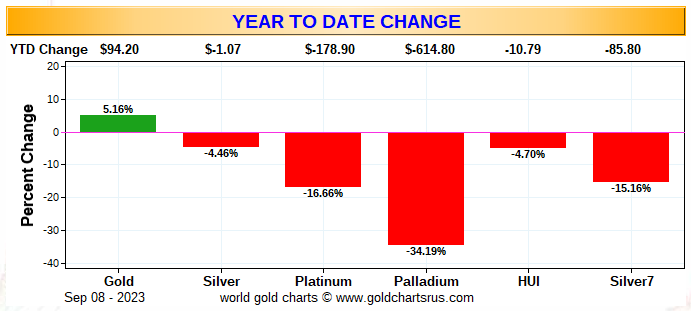
Here's the year-to-date graph -- and only gold are up on the year, with the silver equities continuing to under perform badly vs. the gold shares...although their performance is equally brutal as well. Of course -- and as I mention in this spot every Saturday -- and will continue to do so...is that if the silver price was sitting within 10 percent or so of its old high of $50 the ounce...like gold is currently within 10 percent or so of its old high of around $2,080...it's a given that the silver equities would be outperforming their golden cousins by an absolute country mile. That day still lies in our future...and is most certainly coming. Click to enlarge.
The current 'wash, rinse, spin' cycle, courtesy of the commercial traders of whatever stripe appears to be pretty much done, although I'm still somewhat apprehensive of gold's 200-day moving average. At first glance, yesterday's COT Report was just plain ugly...an increase in the commercial net short position in both gold and silver...especially in the former...which Ted and I weren't expecting at all. But there were mitigating circumstances -- and all of this is explained in my commentary further down.
![]()
The CME Daily Delivery Report for Day 7 of September deliveries showed that 7 gold -- and 58 silver contracts were posted for delivery within the COMEX-approved depositories on Tuesday.
In gold, the lone short/issuer was ADM out of its client account -- and the three long/stoppers were all card-carrying members of the Big 4/8 commercial shorts...BofA Securities, Wells Fargo Securities -- and British bank HSBC, as they picked up 3, 2 and 2 contracts for their respective house accounts as usual.
In silver, the two short/issuers were British bank HSBC and Advantage, issuing 55 and 3 contracts out of their respective client accounts. The only three of the four long/stoppers in total that mattered were JPMorgan, the CME Group and Wells Fargo Securities, as they stopped 25, 20 and 12 contracts respectively...JPMorgan for its client account.
The CME Group immediately reissued theirs as 5x20=100 of those one-thousand once good delivery bar micro silver futures contracts -- and the long/stoppers for them were Morgan Stanley, Advantage and ADM, as they picked up 48, 42 and 10 contracts for their respective client accounts.
In palladium, there were 3 contracts issued and stopped.
So far in September there have been 3,629 gold contracts issued/reissued and stopped -- and that number in silver is 2,497 COMEX contracts. In platinum it's zero -- and in palladium, it's 116 contracts.
As I said last week at this time, that gold number is surprising considering that September is a scheduled delivery month for silver, but not for gold.
The link to yesterday's Issuers and Stoppers Report is here.
The CME Preliminary Report for the Friday trading session showed that gold open interest in September rose by 2 contracts, leaving 810 still around, minus the 7 contracts mentioned a few paragraphs ago. Thursday's Daily Delivery Report showed that 6 gold contracts were actually posted for delivery on Monday, so that means that 6+2=8 more gold contracts were added to September deliveries.
Silver o.i. in September fell by 85 COMEX contracts, leaving 177 still open, minus the 58 contracts mentioned a few paragraphs go. Thursday's Daily Delivery Report showed that 100 silver contracts were actually posted for delivery on Monday, so that means that 100-85=15 more silver contracts were added to the September delivery month.
Total gold open interest at the close on Friday dropped by a net 593 COMEX contracts -- and total silver o.i. fell by a net 454 contracts. Both these numbers are subject to some revision by the time the final figures are posted on the CME's website later on Monday morning CDT.
![]()
For the second day in a row there were no reported changes in GLD...but an authorized participant added a hefty 3,209,367 troy ounces of silver to SLV -- and the timing suggests that it was added to cover an exiting short position. But I'll let Ted have the final say on that, as he's more qualified than I to speak to this.
In other gold and silver ETFs and mutual funds on Planet Earth on Friday, net of any changes in COMEX, GLD and SLV inventories, there were a net 262,973 troy ounces of gold taken out. The lion's share were the the 175,463 troy ounces that left Source/SGLD. There were 2,086,052 troy ounces of silver removed as well, with the largest two amounts...1,522,637 and 433,058 troy ounces...leaving Deutsche Bank and iShares/SVR respectively.
There was no sales report from the U.S. Mint.
Month-to-date the mint has sold 5,500 troy ounces of gold eagles -- 14,000 one-ounce 24K gold buffaloes -- and 717,000 silver eagles.
![]()
There was no in/out activity in gold over at the COMEX-approved depositories on the U.S. east coast on Thursday.
But there was big activity in silver. There were only 4,007 troy ounces/four good delivery bars received, all of which ended up at Delaware...but 1,513,611 troy ounces were shipped out, involving five different depositories.
The three largest 'out' amounts were the 825,700 troy ounces that left Brink's, Inc...followed by the 578,057 troy ounces/one truckload that departed JPMorgan. The remaining large amount were the 100,818 troy ounces that got shipped out of Loomis International.
There was no paper activity -- and the link to Thursday's COMEX silver action, is here.
There was a bit of activity over at the COMEX-approved depositories kilobar depositories in Hong Kong on Thursday. There were 515 kilobars received -- and 306 shipped out. Except for the 66 kilobars that arrived at Loomis International, all the remaining in/out activity took place over at Brink's, Inc. as always. The link to this, in troy ounces, is here.
![]()
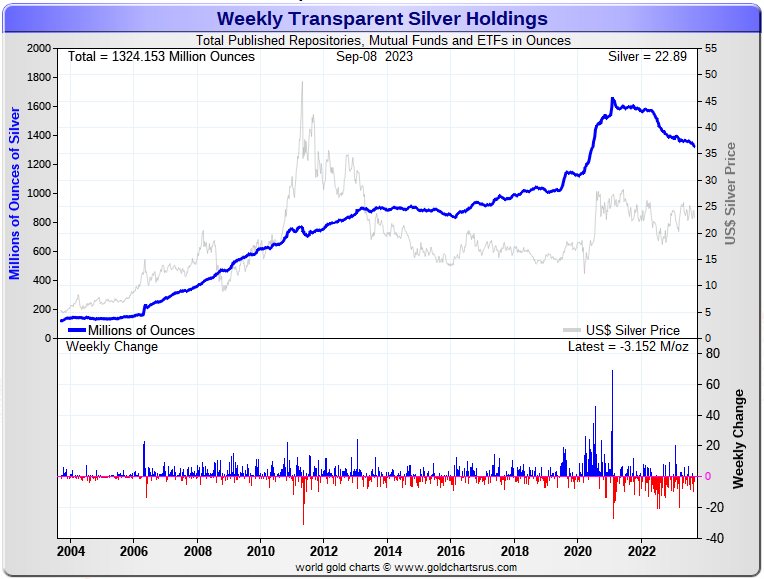
Here are the usual 20-year charts that show up in this space in every Saturday column. They show the total amounts of physical gold and silver held in all know depositories, ETFs and mutual funds as of the close of business on Friday.
During the week just past, there were a net 665,000 troy ounces of gold removed -- and a net 3.152 million troy ounces of silver were taken out as well. Click to enlarge for both.
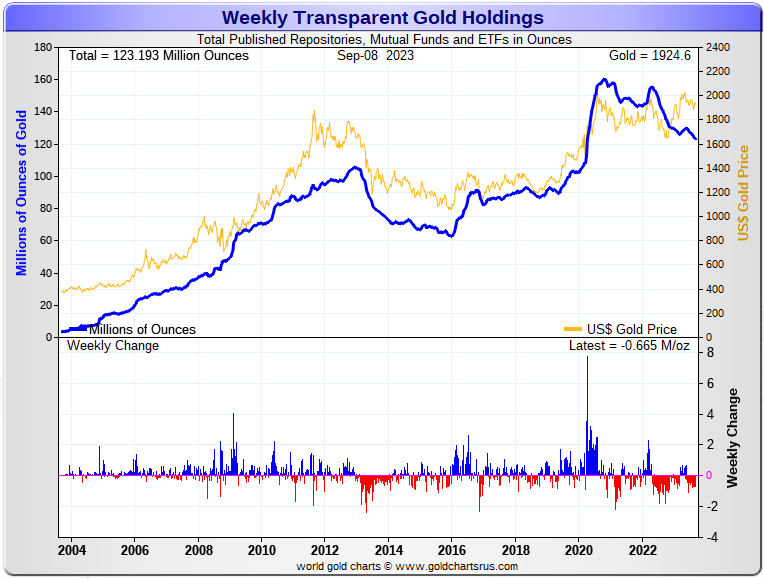
According to Nick Laird's data on his website, there have been a net 1.952 million troy ounces of gold removed -- and a net 23.489 million troy ounces of silver has been taken out as well in all the world's known depositories, mutual funds and ETFs during the last four weeks.
In gold, the only net 'in' amount of note were the 79,542 troy ounces that arrived at XetraGold. And with one minor exception, every other ETF, mutual fund and depository is in the red. The two largest 'out' amounts by far were the 750,000 troy ounces that left the COMEX...followed by the 376,000 troy ounces that departed iShares/IAU. After them were the 295,000 troy ounces that left GLD -- and the 263,055 troy ounces out of Source/SGLD. The list goes on and on...
In silver, there are none on the list showing net deposits. The largest 'out' amount were the net 12.562 million troy ounces that left iShares/SLV. In second spot were the 3.412 million troy ounces taken out of the COMEX -- and in third and fourth place were the 2.654 million troy ounces removed from ETF Securities/SIVR -- and the net 1.944 million troy ounces that departed Deutsche Bank. In fifth spot were the 1.555 million troy ounces withdrawn from iShares/SVR. The list goes on and on here as well.
Retail bullion sales still remain comatose for the most part. That situation will exist until the next buying frenzy commences...which may already be underway to a certain extent. When investment demand really gets serious this time, we will be back to shortages/back orders and high premiums in very short order. And that's not taking into account the mind-boggling quantities of silver that will be absorbed by all the silver ETFs and mutual funds.
Where will all this physical metal come from in the face of this ongoing and accelerating physical shortage, one wonders? It's one of the things that the powers-that-be fear most I suspect, as it just won't be there at some point...although JPMorgan & Friends are sitting on a goodly amount of the stuff according to Ted.
The physical demand in silver at the wholesale level continues unabated -- and appears to be increasing. Most of what's left in the various public ETFs and mutual funds is not available for sale...including the COMEX, where new silver has to be brought in from other sources [JPMorgan?] to meet the ongoing rabid demand for physical metal. How long this will continue before available supplies are depleted is unknown...but is getting closer to zero with each passing day.
The vast majority of precious metals being held in these depositories are by those who won't be selling until the silver price is many multiples of what it is today. That's particularly true of shareholders in PSLV...but that withdrawal last Friday came as a big surprise. The previous [and first] withdrawal from PSLV happened many months ago -- and got reversed the following day, but then the withdrawal was reinstated the day after that.
Sprott's PSLV is the third largest depository of silver on Planet Earth with 174 million troy ounces -- and some distance behind the COMEX, where there are 276 million troy ounces being held. However, as Ted Butler has mentioned from time to time, it's most likely that 105 million troy ounces of that amount is actually held in trust for SLV. But PSLV is light years behind SLV, as they are the largest silver depository, with 440 million troy ounces as of Friday's close.
The latest short report from Wednesday, August 24th showed that the short position in SLV declined by 11.04%...down to 24.10 million shares held short. If you remember, BlackRock issued a warning a couple of years ago to all those short SLV, that there might come a time when there wouldn't be enough metal for them to cover.
The authorized participants are obviously shorting SLV shares in lieu of depositing physical metal as the prospectus demands -- and that's most likely because that quantity of physical metal can't be had without driving the silver price to the moon in the process of acquiring it. It's a 'catch-22" situation in spades...with real-world repercussions that can only be imagined.
The next short report will be posted on The Wall Street Journal's website this coming Tuesday, September 12 -- and it nearly goes without saying that both Ted and I will be more than interested as to what's in it.
Then there's that other little matter of the 1-billion ounce short position in silver held by Bank of America in the OTC market...with JPMorgan & Friends on the long side. Ted says it hasn't gone away -- and he's also come to the conclusion that they're now short around 37 million ounces of gold with these same parties as well...up 12 million oz. from the 25 million they were short in the March OCC Report. You can read Ted's commentary about it linked here.
![]()
Although I don't have room for Nick's charts in today's column, China reported their gold and silver imports for July.
During that month they imported 106.94 tonnes/3.438 million troy ounces of gold, plus 268.76 tonnes/8.641 million troy ounces of silver.
I'll have those charts for you on Tuesday.
![]()
The Commitment of Traders Report for positions held at the close of COMEX trading on Tuesday was a disappointing surprise when the numbers showed up on the CME's website yesterday afternoon, as the commercial net short positions in both increased...especially in gold. However, there were reasons why both Ted and I got it so wrong, but there were silver linings... which you'll see as my dialogue progresses.
In silver, the Commercial net short position rose by 1,932 COMEX contracts... 9.660 million troy ounces of the stuff.
They arrived at that number by reducing their long position by 2,842 COMEX contracts -- and the also reduced their short position by 910 contracts, so it's the difference between those two numbers that represents their change for the reporting week.
Under the hood in the Disaggregated COT Report, the Managed Money traders decreased their net long position by 3,131 COMEX contracts, which they did by reducing their gross long position by 5,334 contracts -- and their gross short position by 2,203 contracts. It's the difference between those two numbers that represents their change for the reporting week.
The reason that the gross short position decreased by 2,203 contracts instead of increasing, which it should have done under normal circumstances, was because Ted thought that the Managed Money trader that had a short position of around 7,000 COMEX contracts in the Big '5 through 8' category, covered all except maybe a few thousand during the reporting week...which meant that had to have bought a bunch of long contracts to do so.
The Traders in the Other Reportables and Nonreportable/small traders category were buyers during the reporting week...as the former increased their net long position by 2,802 contracts -- and the latter by 2,261 COMEX contracts.
Doing the math: 2,802 plus 2,261 minus 3,131 equals 1,932 COMEX contracts, the change in the commercial net short position.
The Commercial net short position in silver now stands at 37,708 COMEX contracts/178.880 million troy ounces...up those 1,932 contracts from the 35,776 COMEX contracts/178.880 million troy ounces they were short in the September 1 COT Report.
But that increase was solely because of that Managed Money trader covering most if not all of his approximately 7,000 contract short position.
The Big 4 shorts increased their short position by an inconsequential 658 contracts, from 35,773 contracts, up to 36,431 COMEX contracts during the reporting week. This is back to being a pure number now.
The '5 through 8' big shorts actually decreased their net short position by an equally insignificant 569 contracts -- and are currently short 16,035 COMEX contracts in total.
The Big 8 shorts in total increased their net short position from 52,377 contracts, up to 52,466 COMEX contracts week-over-week...an increase of only 89 COMEX contracts.
Assuming that Ted's Managed Money trader in the Big 4 category covered their entire short position during the week just past, means that his raptors, the small commercial traders other than the Big 8, added around 5,000 or so long contracts during the reporting week -- and now hold a long position of 14,758 contracts.
However, if that Managed Money trader didn't cover their short position completely, then those two numbers in the previous paragraphs would have to reduced by that amount. These sort of number speculations fall into the 'hand grenades and atomic bombs' category...close is good enough. But in this particular case, it's not really relevant.
Don't forget, that despite their small size, they're still commercial traders in the commercial category -- and all in the Swap Dealers category.
Here's Nick's 3-year COT Report for silver, updated with the above data. Click to enlarge.
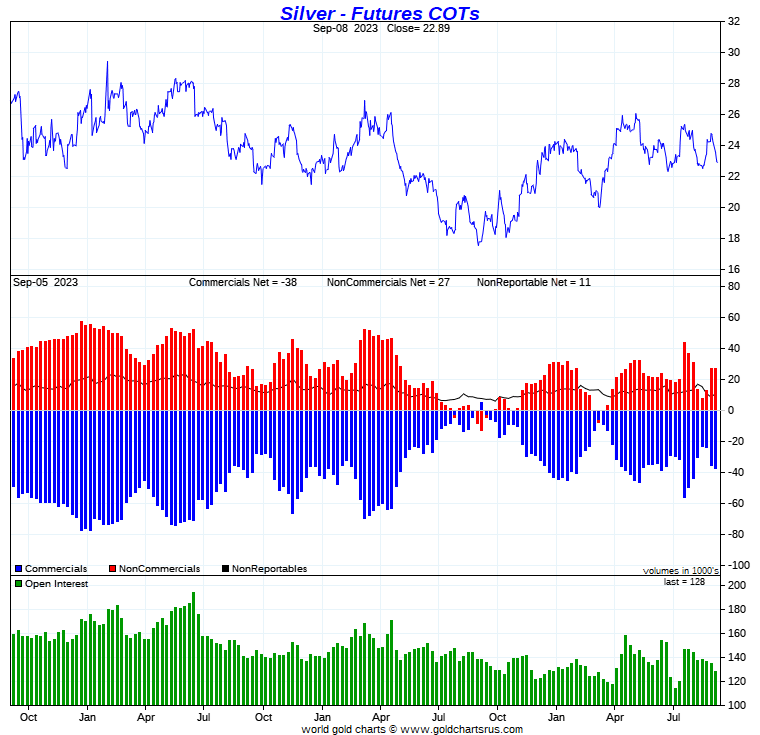
Another reason why the Commercial net short position in silver rose when it was expected it to fall, was the fact that no moving averages of importance to the managed money traders were broken, so they weren't overly aggressive sellers of long positions during the reporting week...only 5,334 contracts -- and in aggregate were net buyers because of that managed money trader covering around 7,000 short contracts -- and exiting stage left.
Without doubt, if we could see a COT Report in silver as the COMEX close yesterday, it would be an entirely different beast, as it's a near certainty that the Managed Money traders would be either close to market neutral, or back on the short side by a bit.
Once again, the Big 4/8 shorts moved heaven and earth not to go back on the short side in a big way...which they didn't Their positions changed by insignificant amounts.
So although yesterday's report was disappointing in some respects, Ted's 'Code Red' set-up for a major price move higher, is still very much in place.
I'm more than interested in seeing how Ted reconciles these figures in his weekly review this afternoon...as it was a really unusual set of numbers.
![]()
In gold, the commercial net short position rose by an eye-watering 17,645 COMEX contracts...1.765 million troy ounces. But the lion's share of that amount was that lone Managed Money trader exiting stage left in this precious metal as well...which I'll get into momentarily.
The commercial traders arrived at that number by reducing their long position by 6,676 contracts -- and also added another 10,969 short contracts. It's the sum of those two numbers that represents their change for the reporting week.
Under the hood in the Disaggregated COT Report...all three categories increased their net long positions. The Managed Money traders increased their net long position by a net 11,123 COMEX contracts. They only reduced their gross long position by a paltry 387 COMEX contracts...but reduced their gross short position by 11,501 contracts -- and this, according to Ted, was that one Managed Money trader in the Big '5 through 8' category covering his entire short position -- and also exiting stage left.
The traders in the other two categories were buyers as well, as the Other Reportables increased their net long position by 3,611 COMEX contracts... mostly by covering 3,476 short contracts -- and the Nonreportable/small traders increased their net long position by a further 2,911 contracts...mostly by adding 2,199 long contracts.
Doing the math: 11,123 plus 3,611 plus 2,911 equals 17,645 COMEX contracts...the change in the commercial net short position.
The commercial net short position in gold now sits at 158,239 COMEX contracts, or 15.824 million troy ounces of the stuff...up those 17,645 contracts from the 140,614 contracts/14.061 million troy ounces they were short in the September 1 COT Report.
The Big 4 shorts increased their net short position from 135,055 contracts, up to 141,252 COMEX contracts...an increase of 6,197 contracts.
The Big '5 through 8' shorts increased their net short position from the 67,307 contracts they held short in the September 1 COT Report, up to 68,871 contracts held short in the current COT Report...an increase of 1,564 COMEX contracts.
The Big 8 shorts in total increased their net short position from 202,362 COMEX contracts, up to 210,123 contracts...an increase of 7,761 COMEX contracts...[6,197 plus 1,564].
And, like in silver, because of that Managed Money trader in the Big '5 through 8' short category in gold in last week's COT Report, it's not possible to accurately calculate what Ted's raptors...the small commercial traders other than the Big 8...did during the reporting week. But in the 'best guess' category, they bought about 2,500 long contracts, which is about the same number of contracts they sold in the prior week -- and currently hold a long position of 51,884 contracts...which is back to being a pure number.
Don't forget that despite their small size, they are great in number. These raptors in gold are still commercial traders in the commercial category -- and [like in silver] in direct competition with the Big 4/8 shorts on the buy side.
Here's Nick Laird's 3-year COT Report chart for gold, updated with the above data. Click to enlarge.
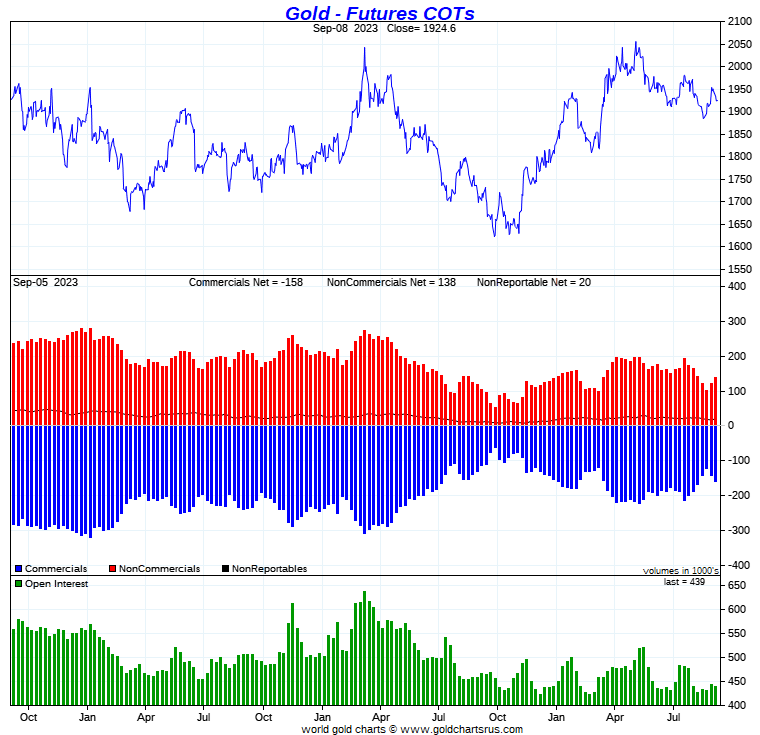
Like in silver, the reason for the big surprise increase in the commercial net short position in gold was because gold's 50-day moving average wasn't broken during the reporting week -- plus the fact that the one lone Managed Money trader had to buy around 12,000 long contracts to cover their short position.
Without doubt -- and also like in silver, a COT Report as of Friday's close would most likely show that this one week of deterioration would have most likely been reversed by the Big 4/8 shorts. But, as always, they would be competing with Ted's raptors that are trying to rebuild their long position.
And whether gold's 200-day moving average is still in the sights of the Big 4/8 commercial shorts, is still a big unknown. But it was only 18 bucks or so above that number in the December contract at the close of trading on Friday.
But setting that aside, as of yesterday, the set-up for a rally in gold is still there...but not nearly as white-hot as what exists in the COMEX futures market in silver...or in platinum or palladium for that matter.
As I said earlier, I look forward to what Ted has to say about all this in his weekly review for his paying subscribers this afternoon.
![]()
In the other metals, the Managed Money traders in palladium increased their net short by a further and very hefty 1,189 COMEX contracts. They are currently net short palladium by a knee-wobbling 10,596 contracts... 60 percent of total open interest -- and are certainly more short since the Tuesday cut-off. The commercial traders remain very net long palladium in both categories...especially the Swap Dealers. The traders in the Other Reportables category are net short a negligible amount...but on the other hand, the Nonreportable/small traders are now net long palladium in this week's COT Report, but also by a negligible amount.
In platinum, the Managed Money traders didn't do much on a net basis. They increased their net long position by a paltry 820 COMEX contracts -- and are still net long platinum by 6,466 contracts. The Producer/Merchant category is the only category net short platinum at the moment -- and they are mega net short to the tune of 26,048 contracts -- and are mostly U.S. bullion banks as per yesterday's Bank Participation Report. The rest of the categories are net long by very decent amounts.
But make no mistake about it, the commercial traders of whatever stripe have slammed them back on the short side since the Tuesday cut-off, as platinum's price is now a very long way below any moving average that matters.
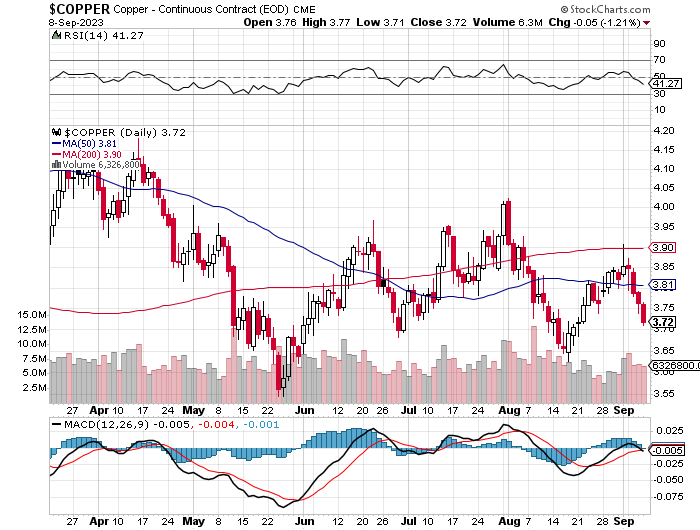
In copper, the Managed Money traders decreased their net short position by a further 10,272 contracts -- and are now back on the long side in copper by a net 3,837 COMEX contracts...about 96 million pounds of the stuff as of the September 8 COT Report...down from the 161 million pounds they were net short in last week's report.
But like just about everything else, the commercial traders now have the Managed Money traders back on the short side since the COMEX close on Tuesday.
Copper, like platinum, continues to be a wildly bifurcated market in the commercial category. The Producer/Merchant category is net short 32,151 contracts -- and the Swap Dealers are net long 36,810 COMEX contracts.
Whether this means anything or not, will only be known in the fullness of time. Ted says it doesn't mean anything as far as he's concerned, as they're all commercial traders in the commercial category.
In this vital industrial commodity, the world's banks...both U.S. and foreign... are net long 11.4 percent of the total open interest in copper in the COMEX futures market in the September Bank Participation Report...up from the 9.5 percent they were net long in August's. At the moment it's the commodity trading houses such as Glencore and Trafigura et al., along with some hedge funds, that are mega net short copper in the Producer/Merchant category, as the Swap Dealers are mega net long, as pointed out above.
The latest Bank Participation Report came out yesterday -- and I'll have the commentary on that in a bit.
![]()
Here’s Nick Laird’s “Days to Cover” chart, updated with the COT data for positions held at the close of COMEX trading on Tuesday, September 5. It shows the days of world production that it would take to cover the short positions of the Big 4 — and Big '5 through 8' traders in every physically traded commodity on the COMEX. Click to enlarge.
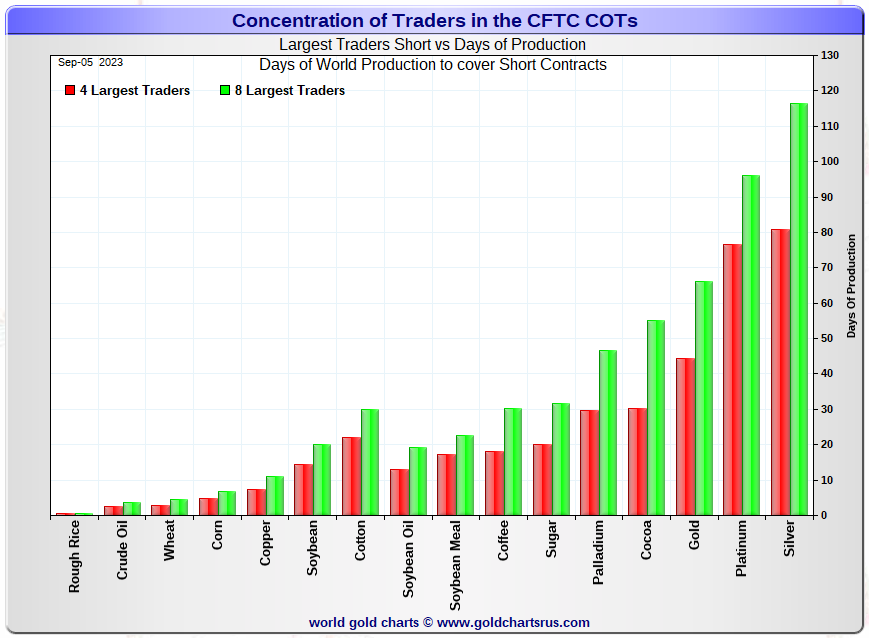
In this week's data, the Big 4 traders are short about 81 days of world silver production...up about two days from last week. The ‘5 through 8’ large traders are short an additional 35 days of world silver production ...down two days from last week, for a total of about 116 days that the Big 8 are short...and obviously unchanged from lasted week's report.
Those 116 days that the Big 8 traders are short, represents a bit under 4 months of world silver production, or 262.33 million troy ounces/52,466 COMEX contracts of paper silver held short by these eight traders. Several of the largest of these are now non-banking entities, as per Ted's discovery in last December's Bank Participation Report. September's Bank Participation Report that came out yesterday, confirms that this is still the case -- and not just in silver, either.
Because of that Managed Money trader is now gone [or mostly so] from the Big short category, it appears that Ted's raptors, the small commercial traders other than the Big 8, added around 5,000 long contracts during the reporting week -- and are currently net long 14,758 COMEX contracts/73.79 million troy ounces of the stuff, which not a particularly large amount for them to be long on an historical basis.
And if that Managed Money trader still has short position of a few thousand contracts, that number could be as low as 50 million ounces...which doesn't really matter in the grand scheme of things.
In gold, the Big 4 are short 44 days of world gold production...up about 2 days from last week's COT Report. The '5 through 8' are short 22 days of world production, unchanged from last week...for a total of 66 days of world gold production held short by the Big 8 -- and obviously up 2 days from last week.
The Big 8 commercial traders are short 40.9 percent of the entire open interest in silver in the COMEX futures market as of yesterday's COT Report, up a bit from the 38.8 percent that they were short in the September 1 COT Report. And once whatever market-neutral spread trades they have on are subtracted out, that percentage would be something over the 45 percent mark. In gold, it's 47.9 percent of the total COMEX open interest that the Big 8 are short, up a bit from the 45.7 percent they were short in the September 1 COT Report -- and around the 55 percent mark once their market-neutral spread trades are subtracted out.
And as also mentioned earlier, Ted is still of the opinion that Bank of America is short about one billion ounces of silver in the OTC market, courtesy of JPMorgan & Friends. He's also of the opinion that they're now short 37 million troy ounces of gold, as of the March OCC Report...with the same bunch of JPMorgan & Friends crooks on the long side. That's up 12 million ounces from the 25 million that they were short in the December OCC Report.
And as already reported, the short position in SLV declined from 27.10 million shares, down to 24.10 million shares in the August 24 short report. The next short report is due out this coming week on Tuesday, September 12.
The situation regarding the Big 4/8 commercial short positions in silver and gold are still obscene...vastly improved over the last month...but there certainly was some unwelcome deterioration in gold. But, like the deterioration in silver, pretty much all of that [plus more in silver] has most likely been reversed since the Tuesday cut-off. And again in silver, the big commercial shorts bent over backwards in their efforts not to increase their short position in it during the reporting week...which they didn't.
As Ted has been pointing out ad nauseam forever, the resolution of the Big 4/8 short positions will be the sole determinant of precious metal prices going forward -- which should be obvious to everyone by now... except the always willfully blind, of which there are legions.
![]()
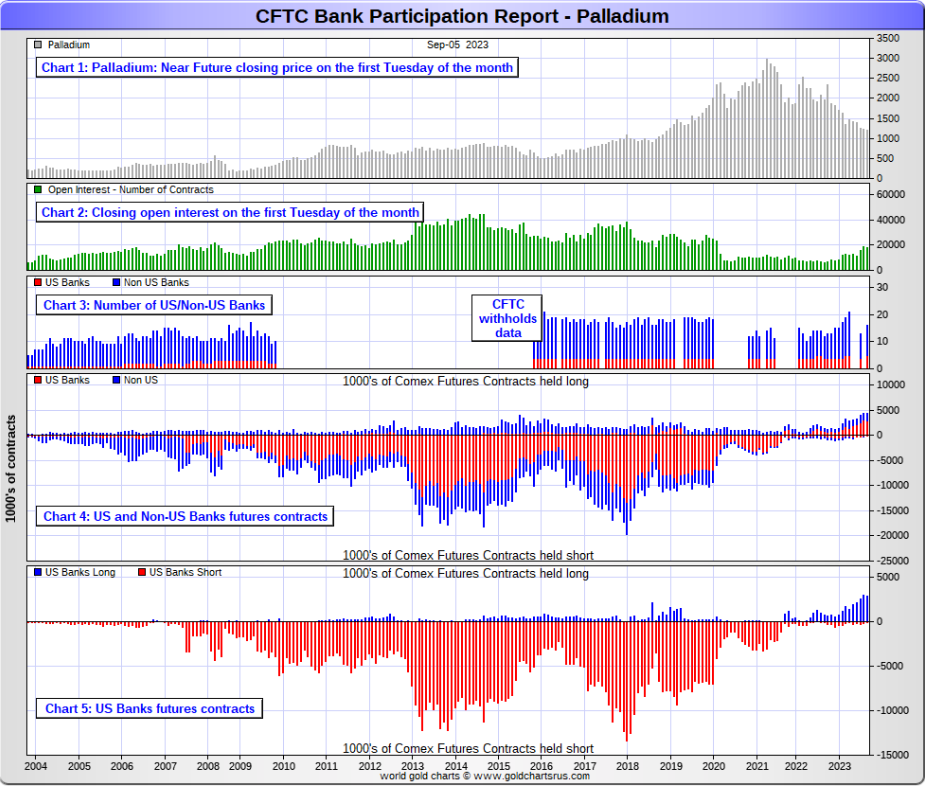
The September Bank Participation Report [BPR] data is extracted directly from yesterday's Commitment of Traders Report. It shows the number of futures contracts, both long and short, that are held by all the U.S. and non-U.S. banks as of Tuesday’s cut-off in all COMEX-traded products.
For this one day a month we get to see what the world’s banks have been up to in the precious metals. They’re usually up to quite a bit -- and this month was no exception in either gold or silver.
[The September Bank Participation Report covers the four-week time period from August 1 to September 5 inclusive]
In gold, 5 U.S. banks were net short 51,393 COMEX contracts, up 4,054 contracts from the 47,334 contracts they were short in August's BPR.
Also in gold, 24 non-U.S. banks were net short 35,395 COMEX contracts, down 5,544 contracts from the 40,939 contracts that 26 non-U.S. banks were short in August's BPR.
At the low back in the August 2018 BPR...these same non-U.S. banks held a net short position in gold of only 1,960 contacts -- so they've been back on the short side in an enormous way ever since.
Although some of the largest U.S. and foreign bullion banks are in the Big 8 short category in gold, some of the hedge fund/commodity trading houses are short equally if not more grotesque amounts of gold than the banks...as mentioned further down.
As of September's Bank Participation Report, 29 banks [both U.S. and foreign] are net short 19.8 percent of the entire open interest in gold in the COMEX futures market...down an insignificant amount from the 20.1 percent that these same 29 banks were net short in the August BPR.
That 19.8 percent is not a large amount at all.
But it should be pointed out that the Big 8 commercial traders in gold are short 47.9% of total open interest...so that leaves some non-banking entities short the remaining [47.9 minus 19.8] 28.1 percentage points....which are even more obscene short positions than the banks.
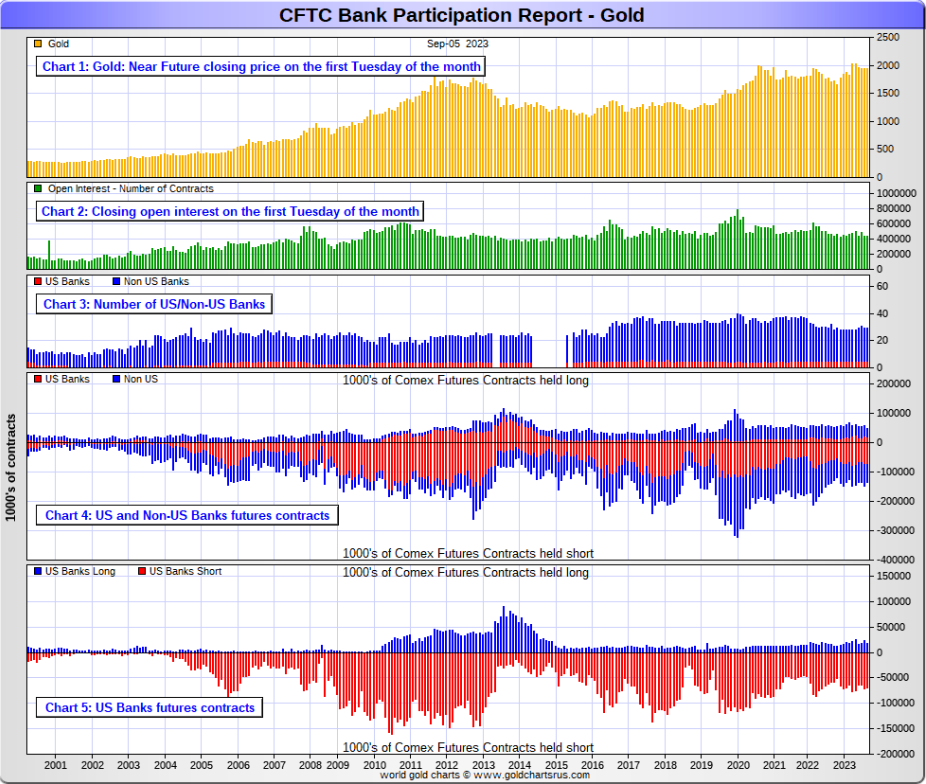
Here’s Nick’s BPR chart for gold going back to 2000. Charts #4 and #5 are the key ones here. Note the blow-out in the short positions of the non-U.S. banks [the blue bars in chart #4] when Scotiabank’s COMEX short position was outed by the CFTC in October of 2012. Click to enlarge.
In silver, 5 U.S. banks are net short 22,702 COMEX contracts, down 6,074 contracts from the 28,776 contracts that these same 5 U.S. banks were short in the August BPR.
The biggest short holders in silver of the five U.S. banks in total, would be Citigroup, Wells Fargo, Bank of America, Morgan Stanley...and maybe Goldman Sachs -- and also JPMorgan from time to time.
And, like in gold, I have my suspicions about the Exchange Stabilization Fund's role in all this...although, also like in gold, not directly.
Also in silver, 16 non-U.S. banks are net short 14,222 COMEX contracts, down 2,248 contracts from the 16,470 contracts that these same 16 non-U.S. banks were short in the August BPR.
I would suspect that HSBC and Standard Chartered hold a goodly chunk of the short position of these non-U.S. banks...plus some by Canada's Scotiabank/ Scotia Capital still. The remaining short positions divided up between the other 13 or so non-U.S. banks are immaterial — and have always been so. The same can be said of most of the 24 non-U.S. banks in gold as well.
As of September's Bank Participation Report, 21 banks [both U.S. and foreign] are net short 28.8 percent of the entire open interest in the COMEX futures market in silver — down from the 31.4 percent that these same 21 banks were net short in the August BPR. And it's absolutely guaranteed that it's a far lower percentage since the Tuesday cut-off.
That 28.8 percent is a larger number than the 19.8 percent in gold. The Big 8 are short 40.9 percent of the total open interest in silver...so the hedge funds and trading houses are only short [40.9-28.8=12.1 percentage points] between them, which is still a decent amount.
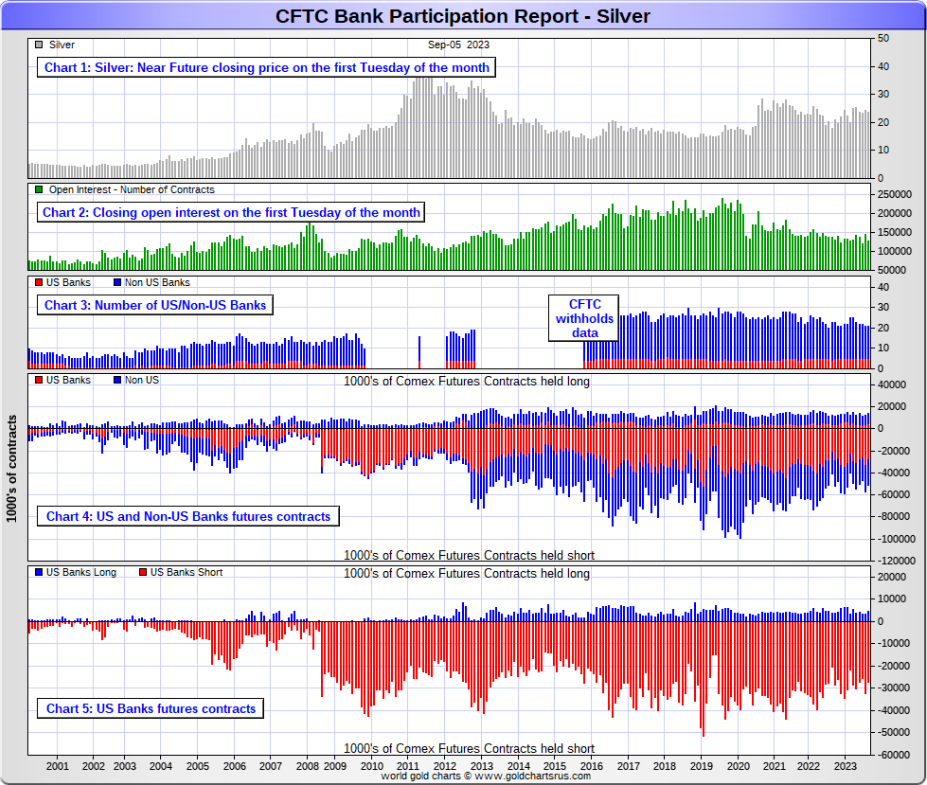
Here’s the BPR chart for silver. Note in Chart #4 the blow-out in the non-U.S. bank short position [blue bars] in October of 2012 when Scotiabank was brought in from the cold. Also note August 2008 when JPMorgan took over the silver short position of Bear Stearns—the red bars. It’s very noticeable in Chart #4—and really stands out like the proverbial sore thumb it is in chart #5. Click to enlarge.
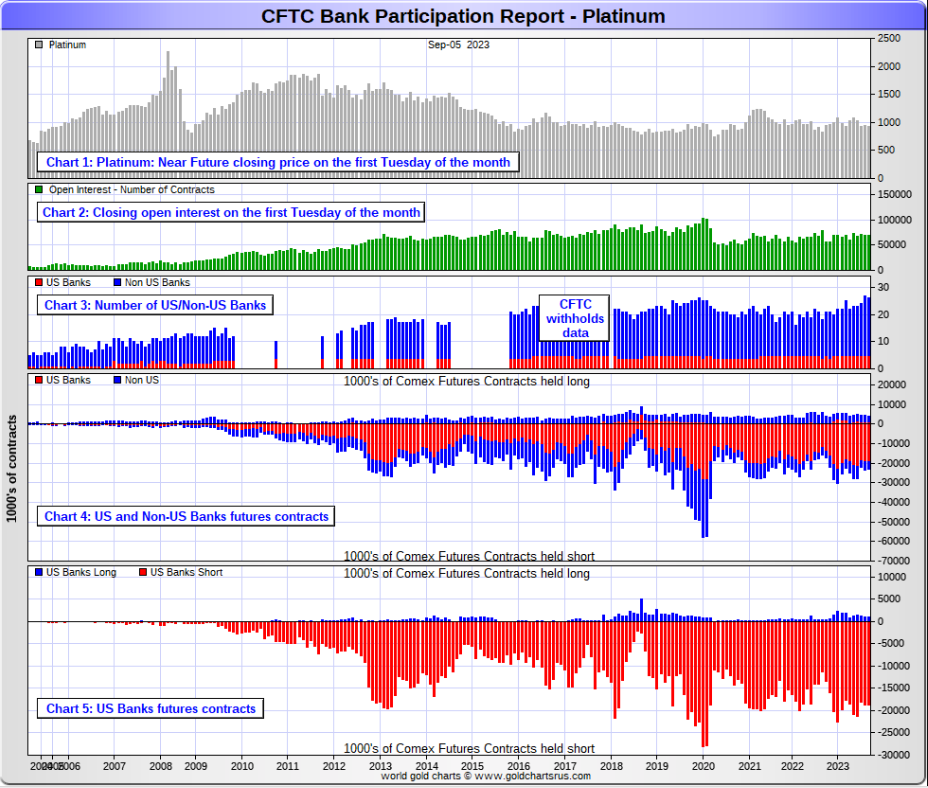
In platinum, 5 U.S. banks are net short 17,643 COMEX contracts in the September BPR, down 1 lone contract from the 17,644 contracts they were short in the August BPR.
At the 'low' back in September of 2018, these U.S. banks were actually net long the platinum market by 2,573 contracts. So they have a very long way to go to get back to just market neutral in platinum...if they ever intend to, that is. They look permanently stuck on the short side to me, a fact that I point out regularly.
Also in platinum, 21 non-U.S. banks are net short 1,479 COMEX contracts, up 282 contracts from the 1,197 contracts that 22 non-U.S. banks were net short in the August BPR...an insignificant change.
On average each of these non-U.S. banks are net short around 70 COMEX contracts in this precious metal...which is nothing at all...just like for most of the non-U.S. banks in silver and gold as well. That compares to the average 3,528 contracts that each of the 5 U.S. banks are short.
So it's the U.S. banks that are on the short hook big time -- and the real price managers...which is more than evident in the red bars on Charts No. 4 & 5 below. They have no chance of delivering into their short positions, although a very large number of platinum contracts have already been delivered over the last few years. But that fact, like in both silver and gold, has made no difference whatsoever to their paper short positions. The situation for them [the U.S. banks] in this precious metal is as equally dire in the COMEX futures market as it is with the other two precious metals...silver and gold... particularly the former.
Platinum remains the Big commercial shorts' No. 2 problem child after silver...but a very distant No. 2 down the list. How it will ultimately be resolved is unknown, but most likely in a paper short squeeze, as the known stocks of platinum are minuscule compared to the size of the short positions held -- and that's just the short positions of the world's banks I'm talking about here.
And here's the kicker...
The Big 8 in platinum are short 32,299 COMEX contracts...of which those 5 U.S banks hold 17,643 contracts of that amount...54.6%. The difference between those two numbers [14,656 COMEX contracts] are held by only 3 hedge funds or commodity trading houses in total...which means their average short positions are even more grotesque than those held by the five U.S. banks.
And as of September's Bank Participation Report, 26 banks [both U.S. and foreign] were net short 27.9 percent of platinum's total open interest in the COMEX futures market, which is up a bit from the 27.4 percent that 27 banks were net short in August's BPR.
Here's the Bank Participation Report chart for platinum. Click to enlarge.
In palladium, 4 U.S. banks are net long 2,702 COMEX contracts in September's BPR, down from the 2,781 contracts that '3 or less' U.S. banks were net long in the August BPR.
Also in palladium, 11 non-U.S. banks are net long 1,425 COMEX contracts, up from the 1,278 contracts that '10 or less' non-U.S. banks were net long in the August BPR.
It should be noted that these are record or close to record high numbers for all the banks -- and also represent a decent chunk of total open interest...23 percent.
But as I've been commenting on for almost forever, the COMEX futures market in palladium is a market in name only, because it's so illiquid and thinly-traded. Its total open interest in yesterday's COT Report was only 17,644 contracts...compared to 68,721 contracts of total open interest in platinum ...128,279 contracts in silver -- and 438,672 COMEX contracts in gold.
As I say in this spot every month, the only reason that there's a futures market at all in palladium, is so that the Big 8 commercial traders can control its price. That's all there is, there ain't no more.
As of this Bank Participation Report, 16 banks [both U.S. and foreign] are net long 23.4 percent of the entire COMEX open interest in palladium ...up from the 21.7 percent of total open interest that 13 banks were net long in the August BPR.
For the last 3+ years, the world's banks have not been involved in the palladium market in a material way. And with them now net long by record amounts, it's all hedge funds and commodity trading houses that are left on the short side. The Big 8 commercial traders are short 48.6 percent of total open interest in palladium as of yesterday's COT Report.
Here’s the palladium BPR chart. Although the world's banks are now net long at the moment, it remains to be seen if they return as big short sellers again at some point like they've done in the past. Click to enlarge.
Excluding palladium for obvious reasons, and the non-U.S. banks in platinum, plus almost all of the non-U.S.. banks in gold and silver...only a small handful of the world's banks, most likely no more than 5 or so in total -- and mostly U.S.-based, except for HSBC, Barclays and maybe Standard Chartered... continue to have meaningful short positions in the precious metals. It's a near certainty that they run this price management scheme from their in-house/ proprietary trading desks...although it's guaranteed that some of their their clients...those aforesaid mentioned hedge funds and commodity trading houses...are short these metals as well.
As I pointed out above, the world's commodity trading houses and some hedge funds are also mega net short the four precious metals...far more short than the U.S. banks in some cases. They have the ability to affect prices if they choose to exercise it...which I'm sure they're doing at times. But it's still the big bullion banks at Ground Zero of the price management scheme... especially in silver.
And as has been the case for years now, the short positions held by these Big 4/8 traders/banks, is the only thing that matters...especially the short positions of the Big 4 -- and how this is ultimately resolved [as Ted said earlier] will be the sole determinant of precious metal prices going forward.
The Big 8 commercial traders, along with Ted's raptors...the small commercial traders other than the Big 8 commercial shorts...continue to have an iron grip on their respective prices -- until they don't.
But considering the current state of affairs of the world's banking and financial system as it stands today -- and the physical shortage in silver and platinum -- and maybe in gold and copper as well, the chance that these big bullion banks and commodity trading houses could get overrun at some point, is not zero -- and certainly within the realm of possibility if things go totally non-linear.
However, as Ted keeps reminding us from time to time, if they do finally get overrun...it will be for the very first time.
I have an average number of stories, articles or videos for you today.
![]()
CRITICAL READS
Risk Off and Q2/2023 Z.1 -- Doug Noland
Global market “risk off” is gathering momentum. China’s currency weakened another 1.06% versus the dollar this week to the weakest level since 2007. The Chilean peso dropped 5.0%, the Polish zloty 3.9%, the Mexican peso 2.9%, and the Czech koruna 1.9%. Trouble, characteristically, manifests first at the “periphery.”
Mexico’s local currency 10-year yields jumped 19 bps to 9.53%, the high since October. Yields were up 18 bps in Indonesia (6.52%), 16 bps in Brazil (11.30%), and 12 bps in South Africa (11.91%). EM dollar bonds were under heavy selling pressure. Yields jumped 24 bps in Colombia (7.79%), 20 bps in Peru (5.54%), 19 bps in Mexico (5.89%), 15 bps in Chile (5.33%), 15 bps in Russia (18.91%), and 14 bps in the Philippines (5.10%).
Global bond market liquidity appears increasingly under the grips of deleveraging.
And despite mounting global stress, Treasuries yields are pulled higher. Ten-year Treasury yields gained nine bps this week to 4.26%, with benchmark MBS yields rising 11 bps to 6.00%.
I often ponder how closely Fed officials “parse through” their Z.1 report.
Friday’s release of Q2 Credit and flow data made for interesting parsing. Seasonally adjusted and annualized Credit growth of about $4.5 TN. One-year Treasury debt expansion of about $1.7 TN. Non-Financial Debt-to-GDP exceeding previous cycle peak levels. The ratio of Total Debt Securities-to-GDP is significantly higher than prior peaks. Household holdings of Financial Assets above previous peak levels. Household Net Worth inflating $5.5 TN in three months. Household Equities holdings as a percentage of GDP higher than previous cycle peaks. Analyzing the data, I don’t see our system in a “very good place.”
Rather than a “good place,” the latest Z.1 further corroborates the Bubble Thesis.
Doug's weekly commentary is always a must read for me as you already know -- and this iteration appeared on his website around midnight last night. Another link to it is here.
![]()
German industrial orders fall more than expected in July
German industrial orders fell more than expected in July, pulling back after a sharp gain in the aerospace sector the previous month, the federal statistics office said on Wednesday.
Incoming orders fell by 11.7% on the previous month on a seasonally and calendar adjusted basis.
A Reuters poll of analysts had pointed to a drop of 4.0%.
"The big fluctuations in new orders seen in the past months therefore continued to be observed in July 2023," said the office, which added that July's sharp decline was due to a very large order in air and spacecraft manufacturing the month before.
Orders had posted an unexpected jump in June, rising by a revised 7.6% month-on-month, versus expectations of a 2.0% dip.
Analysts pointed to weakness in the global economy as a reason for the trend.
"Germany is at the mercy of the global economy - the latter is not in good shape at present," said Thomas Gitzel of VP Bank Group. "It is therefore not surprising that the underlying order intake is weak."
This Reuters story, filed from Berlin, showed up on their website on Wednesday -- and I found it in the Thursday edition of the King Report. Another link to it is here. Gregory Mannarino's post market close rant for yesterday is linked here -- and runs for 20 minutes.
![]()
The benefits to Russia of the joining of the new BRICS Six
The choice of six new countries to join the BRICS five is not accidental. Egypt is an old ally of Russia, which has the largest army in Africa. Russia has a long history of cooperation with Ethiopia. It is the largest state on the continent in terms of population: 123 million people. It is clear that the level of GDP per capita in the country is low, but at the same time it speaks of a huge potential.
Next year, it is expect Algeria, Africa's largest economy, with which Russia is actively developing cooperation, will join the association. This is evidenced by the recent state visit of the President of the country to Russia.
To Brazil, which is already a member of the BRICS, Argentina is added - together these are the two largest economies in Latin America. In addition, the state has long dreamed of getting out of the influence of the United States . I think that next year, when Russia presides over the association, we will see Mexico, the financial center of the region, as part of it.
Saudi Arabia and the UAE are the largest countries in the Persian Gulf in terms of economy and export volumes. I think Qatar will join later, which is very important for reducing U.S. pressure and strengthening Russia's position in the region. And also for full cooperation with OPEC on the supply of petroleum products without the use of the dollar.
The long-suffering Iran, which has been under sanctions for many years, closes out the six new countries. This once again proves the multi-polarity of the world, given the fact that such diverse cultures are part of the BRICS.
This commentary by Alexey Poroshin was originally posted on the iz.ru Internet site -- and found its way onto the scobricsinsight.com Internet site on Tuesday. I thank Roy Stephens for sending it along earlier this past week. Another link to it is here.
![]()
German smelter again struck by large-scale metals theft
Copper recycler Aurubis says an audit that’s underway will reveal just how much valuable metal has been stolen from its Hamburg, Germany smelter. It could be hundreds of millions of dollars worth.
The company on August 31 disclosed that thefts of precious metals-bearing materials have likely gone far beyond what was uncovered earlier this year.
In June, the company announced that it had fired several employees and banned some third-party contractors from the facility during an investigation into a suspected theft ring targeting precious metals-bearing intermediate products.
In the latest disclosure, Aurubis said that during a scheduled review of metal inventories, the company identified “considerable discrepancies” between the inventory it should have and what was actually on site. Additionally, it found shortfalls in specific shipments of recyclable input materials it had received.
“This evidence has led Aurubis to conclude that it has been the target of further criminal activity following the cases reported in June 2023,” the notice states.
Aurubis again notified crime investigators and police, who have already arrested suspects in the previously discovered thefts.
This interesting article showed up on the resource-recycling.com Internet site on Thursday -- and I found it on Sharps Pixley. Another link to it is here.
![]()
MKS PAMP GROUP Makes Strategic Investment in APMEX
MKS PAMP GROUP, a global industrial and financial services group specialising in precious metals has made a strategic investment in APMEX, a leading online precious metals retailer. This investment aims to strengthen the group’s capabilities and leverage their collective expertise and resources to best serve their customers with cutting-edge products and services.
Both MKS PAMP GROUP and APMEX have long been rooted in common principles of integrity, innovation and customer focus. Today, with this strategic investment MKS PAMP GROUP demonstrates its commitment to continuously enhance its offering across the value chain of the precious metal industry.
APMEX has exponentially grown to become one of the largest online precious metal's retailers in the world with a focus on the North American market.
“This strategic investment in APMEX follows our vision in growing our global footprint of integrating our group throughout the precious metal value chain, embracing the digital shift in how our customers access and use precious metals today." said Marwan Shakarchi, Executive Member of the Board, MKS PAMP GROUP.
This news item appeared on the mkspampgroup.com Internet site on Wednesday -- and it comes to us courtesy of Swedish reader Patrik Ekdahl. Another link to it is here.
![]()
Gaza Gold: Little coins help the poor in Palestinian enclave to save
A Gaza dentist has developed ultra-lightweight gold coins to allow people without much money to access to one of the most widely used savings methods across the Middle East.
"The idea stemmed from the community's need to own gold amid the difficult living conditions the people live in," said Ahmed Hamdan, who developed the coins, which range in weight from half a gram to 10 grams.
"We have made gold available to people of all categories, gold that even the poor and those with low income can get some," Hamdan said.
The 21-carat-gold coin, which bears the image of the Dome of the Rock shrine in Jerusalem on one face with the word Palestine underneath, is licensed and stamped by the Ministry of Economy in Gaza, run by the Islamist Hamas group since 2007.
However Osama Nofal, the head of policy at Gaza Economy Ministry, stressed the coins were not legal tender.
"It mustn't be interpreted as if it were a future currency. It is no more than a way of saving," he said.
Palestinians have no currency of their own and use the euro, U.S. dollar, Israeli shekel, and Jordanian dinar in their daily lives. As in many parts of the Middle East, mistrust of banks means many people prefer to keep their savings in gold.
This gold-related Reuters story appeared on their Internet site on Thursday -- and I found it embedded in a GATA dispatch. Another link to it is here.
![]()
The great platinum deficit: Council forecasts record demand in 2023
The World Platinum Investment Council (WPIC) forecasts a record 1-million-oz. platinum deficit for 2023, both in absolute ounces and as a percentage of annual demand, amid a surge in automotive and industrial demand and stagnant supply.
In its Platinum Quarterly report released this week, the WPIC highlights a booming demand for the metal, slated to rocket by 27%, hitting 8.23 million ounces. This overshadows a barely changing supply forecast, stagnating at 7.22 million oz., just 31,000 oz. above last year’s figures.
“These statistics spotlight a market under intense pressure, with potential ramifications for investors and industries dependent on this precious metal,” WPIC research director Ed Sterck tells The Northern Miner in an interview.
The WPIC forecasts a record platinum deficit in 2023. Credit: World Platinum Investment Council
The recovering automotive sector drives this demand upswing, with Sterck’s data projecting a 13% (or 381,000 oz.) increase in 2023. Ramped-up vehicle production rates underpin this surge, with forecasts indicating a 6% and 7% growth for light-duty and heavy-duty vehicle production, respectively.
Simultaneously, the industrial sector is smashing records, with predictions setting the demand at 2.67 million oz., a notable 14% year-on-year increase.
This rise mainly stems from substantial capacity expansions in the glass and chemical sectors, seeing growth rates of 50% (251,000 oz.) and 12% (82,000 oz.), respectively. In contrast, the electrical and petroleum segments anticipate a dip in demand, slated to fall by 8% (9,000 oz.) and 11% (22,000 oz.).
Investment circles also embrace the platinum trend, with predictions setting the net investment demand at 386,000 oz. for 2023. Platinum ETF holdings experienced a significant surge, growing by 155,000 oz. in the June quarter, marking the most substantial quarterly increase since the third quarter of 2020.
Of course the supply/demand fundamentals don't matter when 'da boyz' control prices in the COMEX futures market -- and platinum is their No. 2 problem child after silver, as you already know. This story from the northernminer.com Internet site, was posted there on Thursday -- and I found it on Sharps Pixley. Another link to it is here.
![]()
Asia Gold India discounts widest in seven weeks, China premiums bounce back
Discounts on physical gold were highest in seven weeks in India as sturdy domestic rates restricted purchases, while premiums in China swung higher this week on some demand optimism flowing from the country's policy measures to support the economy.
In top consumer China, premiums climbed to as high as $55 an ounce over global spot prices this week, traders said, from $20-$38 last week.
The policy-measures to support the economy are expected boost physical gold demand, said Peter Fung, head of dealing at Wing Fung Precious Metals.
Official data on Thursday also showed that the People's Bank of China increased its gold holdings to 69.62 million fine troy ounces at end-August.
"China has been consistently adding to its gold reserves for the past 10 months, as part of its efforts to diversify away from the U.S. dollar," said Bernard Sin, regional director, Greater China, at MKS PAMP.
Sin highlighted that while China has implemented a series of policy measures to revive the slowing economy, there is no indication of the PBoC issuing a gold import quota.
Reader John Brimelow, who is a world authority on the subject of premiums, Tweeted out this about it yesterday..."Chinese premium $55 vs. $20-$38 last week. China is being starved of gold. (Why?) India $5 discount vs. $4 last week. Sad, given the season & little change in Rupee gold. Singapore & Hong Kong premiums lower but OK. Unusual positive comment on Japanese buying."
Well, dear reader, I'll be the first one to tell you that I don't understand this premium thingy at all, even though John explained it to me several years ago. If I understood it back then, I've forgotten it all now. This Reuters story from John put in an appearance on their Internet site at 4:14 a.m. Pacific Daylight Time on Friday morning -- and another link to it is here.
![]()
The Photos and the Funnies
Continuing in a generally west direction down Lillooet Pioneer Road/B.C. Highway 40 on May 21...the first two photos were taken looking west down the Bridge River gorge -- and towards the road ahead. The last photo was taken at the end of pavement and, with some odd exceptions, it was all gravel and rock for the rest of the trip into the unknown...unknown at least for us. Click to enlarge.


![]()
The WRAP
"Understand this. Things are now in motion that cannot be undone." -- Gandalf the White
![]()
Today's pop 'blast from the past' can only be described as iconic...as there's no other word for it. It was originally written for Gladys Knight & the Pips -- and it was a success for them. But it wasn't until Marvin Gaye got his hands on it a year and half later in 1968 that it was transformed into the acclaimed soul classic it is today. It was inducted to the Grammy Hall of Fame in 1998 for its "historical, artistic and significant" value.
It is instantly recognizable -- and the link is here.
An as an additional historical note, the uncredited bass player on this is James Lee Anderson, who is now regarded as one of the most influential bass players in modern music history. He was inducted into the Rock and Roll Hall of Fame in 2000. As a session musician he played on twenty-three Billboard Hot 100 number-one hits, as well as fifty-six R&B number-one hits.
It's not him performing the bass cover here...but it's still wonderful -- and that's linked here.
Today's classical 'blast from the past' is somewhat more ancient. It's Mozart's Piano Concerto No. 27 in B♭ major, K. 595...his last. The manuscript for it is dated 5 January 1791 -- and was first performed early that year...the same year he passed on.
Here is Portuguese-born pianist Maria João Pires doing the honours at the keyboard. She's accompanied by the Chamber Orchestra of Europe -- and world-renowned Maestro Trevor Pinnock conducts. The link is here.
![]()
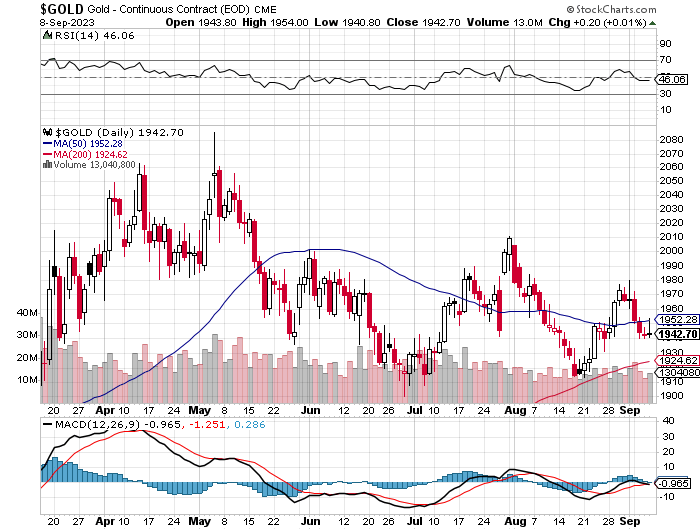
It was another day where the commercial traders of whatever stripe were taking no prisoners, as they were all over the early morning COMEX rallies in silver and gold like white on rice -- and it was most blatantly obvious in the latter. It broke above its 50-day moving average at its 10:15 a.m. EDT high tick, but was brutally engineered lower in price from there.
Although gold closed up 20 cents in its current front month...December...it was closed below its 50-day moving average for the third day in a row.
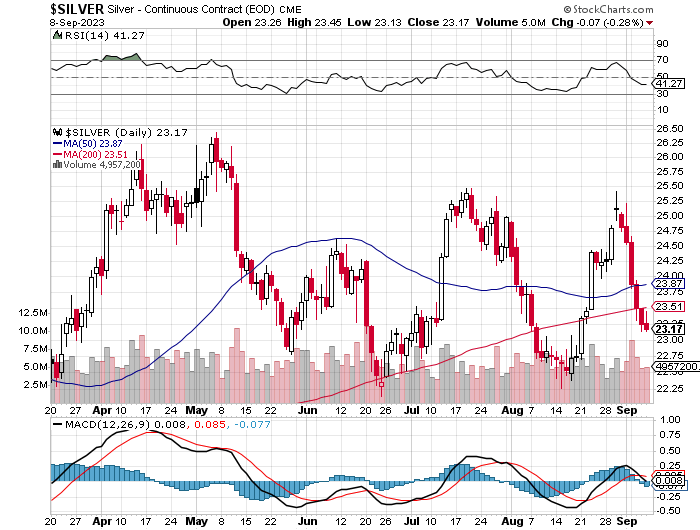
Silver was closed down 7 cents in December -- and is well below its 50-day...plus a decent amount below its 200-day moving average as well.
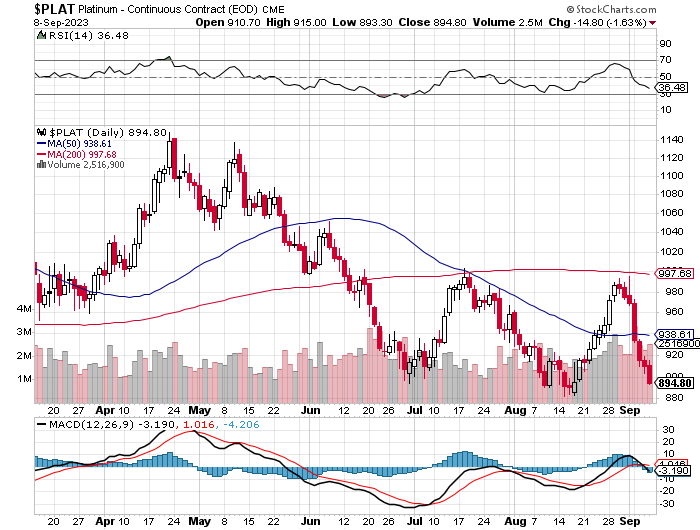
It was 'lights out' for both platinum and palladium starting at the 2:15 p.m. afternoon gold fix in Shanghai on their Friday, which was also the start of the first 'rally' in the dollar index. From there it was all down hill. Platinum's price has been engineered lower for eight straight trading sessions and, like palladium, is now a very long way below any moving average that matters. Palladium's closing price on Friday was at a price not seen since very late December of 2018.
Copper was closed down another 7 cents, finishing the Friday trading session at $3.72/pound -- and like three of the four precious metals -- and natural gas, is also back below any moving average that matters. This is a sure sign that the commercial traders have the Managed Money traders back on the short side.
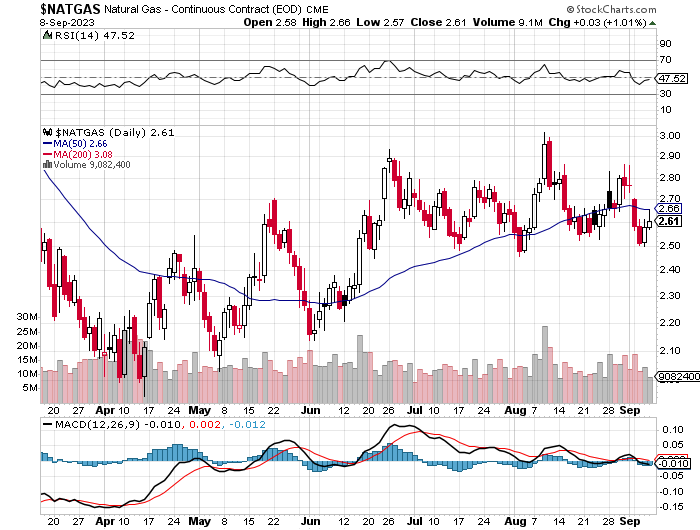
And while on the subject of natural gas...chart included...it touched its 50-day moving average in intraday trading yesterday, but was hauled lower and finished higher by only 3 cents at $2.61/1,000 cubic feet. It's below its 50-day moving average by a nickel at the moment -- and as I pointed out in Friday's column, its 200-day m.a. is so high that it's still not visible on its 6-month chart below.
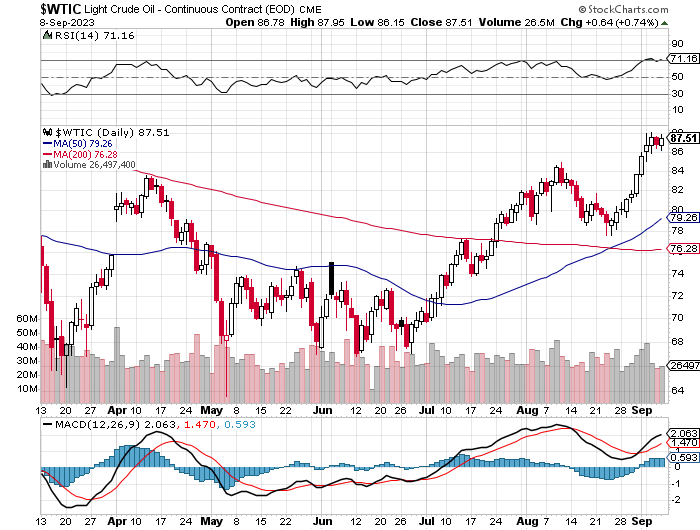
WTIC closed up 64 cents at $87.51/barrel on Friday -- and its RSI trace is showing it to be 'overbought'...so maybe a price correction is in the offing. There was a tweet about that in yesterday's edition of the King Report that went like this..."@zerohedge: "With a largely-drained U.S. Strategic Petroleum Reserve, if the Fed really is active in oil futures, as some whisper, they need to get busy again soon." – Rabobank 9:44 AM · Sep 7, 2023"
Of course the Gulf States...with the oil princes in Saudi Arabia being the most publicly vocal about it...know perfectly well that the 'fix is in' in the COMEX futures market...as do the Russians.
Here are the 6-month charts for the Big 6+1 commodities, thanks to stockcharts.com as usual and, if interested, their COMEX closing prices in their current front months on Friday should be noted. Click to enlarge.
The speed of this current -- and hopefully last "wash, rinse, spin" cycle, has been rather breathtaking to say the least. However, its ferocity appears to have a whiff of desperation about it. With the exception of crude oil, the Big 4/8 shorts have been ruthless with their engineered price declines this time around.
Although yesterday's Commitment of Traders Report was a shocking disappointment at the time both Ted and I saw the numbers early yesterday afternoon...that feeling has mostly dissipated now that I've had about nine hours to digest them.
The dramatic short covering by the embedded Managed Money traders in the Big 4/8 commercial categories in both silver and gold...plus the fact that no significant moving averages were penetrated to the downside during the reporting week...pretty much fully explains why the COT numbers were what they were. And as Ted also pointed out, the fact that it was a holiday-shortened trading/reporting week didn't help either.
However, since the Tuesday cut-off, there should be no question in anyone's mind that the brutal engineered price declines since then have negated all if not more of this past reporting week's increase in the commercial net short positions in everything except WTIC.
A peek at a COT Report generated at the close of COMEX trading on Friday would show an absolutely breathtakingly bullish set-up in the COMEX futures market in the Big 6+1 commodities...sans WTIC as just mentioned.
Not that a more bullish set-up is required in silver, as outlined in Ted's latest commentary on the 'Code Red' situation headlined "Silver: A Sure Thing?" states...but such a report would show just that.
So, we're locked and loaded one more time -- and when the next rallies are allowed to commence, we'll find out in very short order [like we did last week] whether the Big 4/8 commercial shorts...principally the Big 4...are going to step in once more.
That's all there is...there ain't no more -- and the fact that it's not transparently obvious to all -- and the talk of the town in the entire precious metals community at the moment, does not speak well for most of them.
As always, I'm still 'all in' -- and will remain that way to whatever end.
See you here on Tuesday.
Ed
About the author

SUBSCRIBE: https://edsteergoldsilver.com/

Ed Steer’s Daily Analysis of the Gold and Silver Markets
After eight years of writing about the precious metals for Casey Research, the folks at Stansberry & Associates—who just recently purchased controlling interest in the company—decided that my ‘niche market’ column didn’t fit into their plans.
Since the time that Casey Research was kind enough to offer me a stand-alone column, it became their most highly-rated blog almost from the outset—and has remained that way up to this date...