Excerpt from this week's: Technical Scoop: Bill Repercussions, Rising Debt, Divergence Hint
Gold
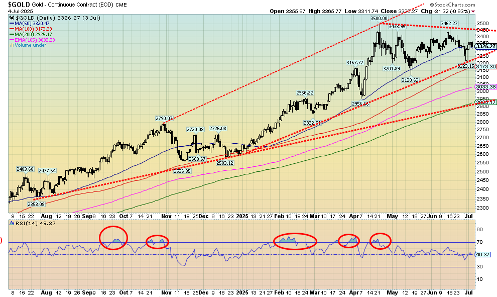
Source: www.stockcharts.com
Gold—the safe haven in times of geopolitical tensions, domestic political tensions, and an uncertain economy. It is also protection against inflation, currency devaluation, and financial volatility, including systemic financial risk. Given gold is up about 26% in 2025, it is living up to its reputation, even as the S&P 500 is up 6.8%. Gold stock indices are up even more. If you are a gold bug, 2025 has been a dream so far, allowing the disaster of 2013 to at least fade into the background.
On the week, gold was up 1.6% despite the drop of 0.9% on Friday after the stronger than expected job numbers. Silver gained 2.6%. The big star has been platinum, gaining another 2.8% this past week and making 52-week highs again. Platinum is up 50.9% so far in 2025. Of the near precious metals, palladium was up 18.3% while copper was over $5 up 0.8%. The gold stock indices continued their upward ride with the Gold Bugs Index (HUI) up 4.9% and the TSX Gold Index (TGD) up 3.9%. They are up 54.9% and 49.4 % so far in 2025. There are individual stocks up over 60%, even 100%. Even the junior mining market is showing life as we noted the TSX Venture Exchange (CDNX) was up 4.3% on the week and is now up 26.3% on the year. The TSX sub-indices of Metals & Mining (TGM) gained 3.2% while the Materials sector was up 3.2%. On the year, they are up 23.1% and 31.3% respectively.
We should note the energy sector as well as WTI oil gained 2.7% but remains down on the year, Brent crude was up 1.9%, natural gas (NG) at the Henry Hub was hit, down 7.8%, while at the EU Dutch Hub it was down 0.2%. The energy indices were up with the ARCA Oil & Gas Index (XOI) up 3.6% while the TSX Energy Index (TEN) gained a modest 0.3%.
Gold is up as the U.S. dollar continues its downward trend. The US$ Index fell 0.4% this week to once again 52-week lows. At 96.99, the US$ Index still has quite a way to go to equal its all-time low of 70.70 set in 2008 during the financial crisis. But the trend is down and still no sign of a bottom. The currencies were up with the euro gaining 0.4% and the Swiss franc up 0.5%. Both hit 52-week highs. Pound sterling actually fell 0.4% as did the Japanese yen, down 0.2%. The Canadian dollar continued its recent rise, up 1.1%. A devaluing currency is music to gold’s ears.
While the stock market continues to soar, there is apprehension about the potentially negative impact of Trump’s Big, Beautiful Bill and his trade wars. This week we’ll see if their promise to hike tariffs takes effect or whether there be a raft of trade deals. Or do we get another TACO response. Don’t hold your breath on trade deals. Gold is also ignoring slow rising yields in the bond market. Normally, higher interest rates are not friendly to gold. But yields rising is due to concern over the huge debt. As well, the Big, Beautiful Bill raises the debt ceiling by $5 trillion. All that is good for gold.
What will gold do going forward? On one hand, gold could be completing a five-point ABCDE reversal pattern with the recent low at $3,223, the E wave. To confirm, we need new highs over $3,500. But this period for gold can be tricky. Anywhere from July to September gold can be weak with the low coming somewhere during the period. Following a rally into October, gold often goes into another snooze until December where it bottoms and soars into the first few months of the new year. Note the low in December 2024 at $2,583. In April gold hit $3,500.
Gold enjoyed a run between October 2023 to a high in April/May 2024 before going into another snooze, bottoming in July/August 2024. Following a rally into October it was followed by the drop into December. The seasonal pattern was almost textbook perfect. Will this year follow the script? Even during the horrible gold years (2012–2015) the script was largely followed, even as gold fell sharply from its $1,900 top in 2011 to the low of $1,045 in December 2015. No, we are not expecting that now. The conditions remain too good for gold. We are always reminded that the 2008–2011 bull market for gold experienced a number of pullbacks on its way from $680 to $1,900. This, we believe, is just another pullback. But in the event that the recent low was not our final low, a break of $3,223 could send us tumbling to major support near $3,000. Hence, the desire for new highs.
As to new highs, gold had made a high but silver didn’t. Now recently silver (and platinum) have made new highs but gold hasn’t. We note divergences and that’s why new highs for gold are important so that all are in sync.
Gold will be going higher as the conditions are there. Raising the debt ceiling along could get gold going. Over the years it has been a long march upward. What will a $5 trillion increase in the debt ceiling do?
The Rise of Gold and Debt 2000–20
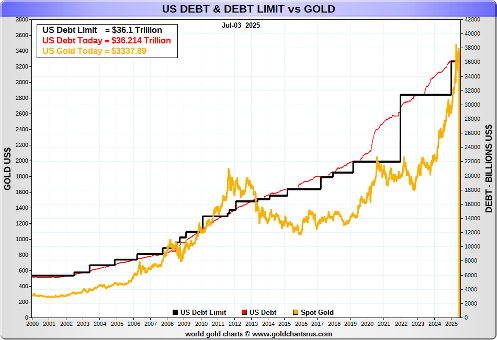
Source: www.goldchartsrus.com
Read the FULL report here: Technical Scoop: Bill Repercussions, Rising Debt, Divergence Hint
Copyright David Chapman 2025
Disclaimer
David Chapman is not a registered advisory service and is not an exempt market dealer (EMD) nor a licensed financial advisor. He does not and cannot give individualised market advice. David Chapman has worked in the financial industry for over 40 years including large financial corporations, banks, and investment dealers. The information in this newsletter is intended only for informational and educational purposes. It should not be construed as an offer, a solicitation of an offer or sale of any security. Every effort is made to provide accurate and complete information. However, we cannot guarantee that there will be no errors. We make no claims, promises or guarantees about the accuracy, completeness, or adequacy of the contents of this commentary and expressly disclaim liability for errors and omissions in the contents of this commentary. David Chapman will always use his best efforts to ensure the accuracy and timeliness of all information. The reader assumes all risk when trading in securities and David Chapman advises consulting a licensed professional financial advisor or portfolio manager such as Enriched Investing Incorporated before proceeding with any trade or idea presented in this newsletter. David Chapman may own shares in companies mentioned in this newsletter. Before making an investment, prospective investors should review each security’s offering documents which summarize the objectives, fees, expenses and associated risks. David Chapman shares his ideas and opinions for informational and educational purposes only and expects the reader to perform due diligence before considering a position in any security. That includes consulting with your own licensed professional financial advisor such as Enriched Investing Incorporated. Performance is not guaranteed, values change frequently, and past performance may not be repeated.
About the author


Website: https://www.enrichedinvesting.com
Disclaimer: David Chapman is not a registered advisory service and is not an exempt market dealer (EMD) nor a licensed financial advisor. We do not and cannot give individualised market advice. David Chapman has worked in the financial industry for over 40 years including large financial corporations, banks, and investment dealers. The information in this newsletter is intended only for informational and educational purposes. It should not be considered a solicitation of an offer or sale of any security. The reader assumes all risk when trading in securities and David Chapman advises consulting a licensed professional financial advisor before proceeding with any trade or idea presented in this newsletter. David Chapman may own shares in companies mentioned in this newsletter. We share our ideas and opinions for informational and educational purposes only and expect the reader to perform due diligence before considering a position in any security. That includes consulting with your own licensed professional financial advisor.