Excerpt from this week's: Technical Scoop: Bridge Disruption, Market Highs, Persistent Inflation
Source: www.stockcharts.com
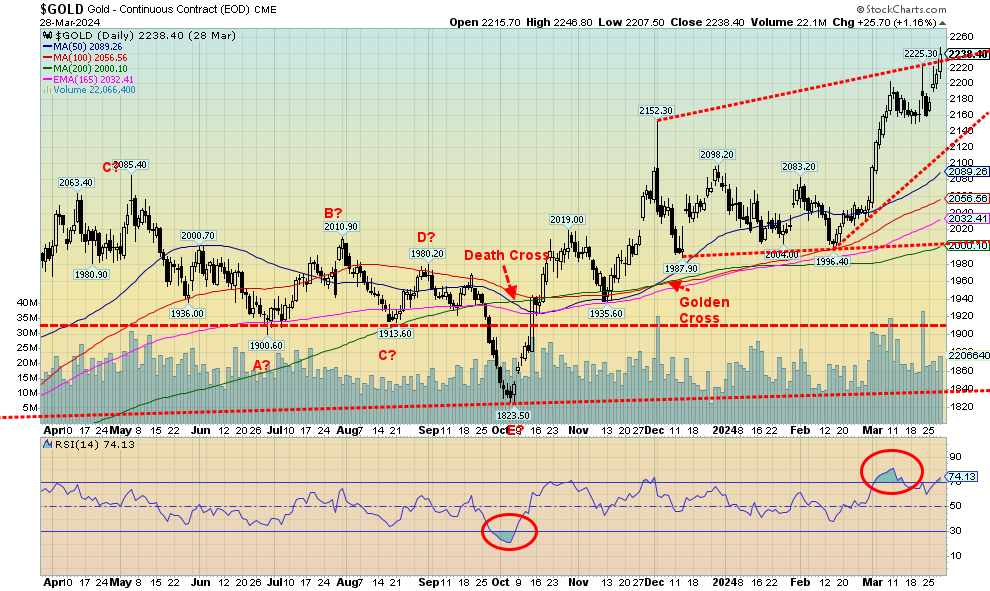
Gold bugs were ecstatic as gold prices leaped to new all-times once again, closing the week firmly over $2,200. The catalyst was, as usual, geopolitical concerns as gold becomes a safe haven. As well, there remain expectations that the Fed will cut rates as early as June. Gold not only made fresh all-time highs in U.S. dollars but also made new all-time highs in Cdn$, euros, Swiss francs, Japanese yen, and pound sterling in addition to numerous other currencies. Gold’s 3.6% gain on the week helped silver, even though it only gained 0.3%, platinum that gained 2.5%, and the near precious metals that saw palladium up 2.3% although copper pulled back a tad, off about 0.1%.
The gold stocks enjoyed a good up week with the Gold Bugs Index (HUI) up 7.2% and the TSX Gold Index (TGD) gaining 5.8%. A good week for the gold bugs, but one hopes they don’t become ecstatic too soon as, with both silver and gold stocks lagging gold, it is not yet time to celebrate. But, as we noted earlier, the gold market is quite small in comparison to the broader stock market, so a small allocation of funds into the gold market can move gold, silver, and the gold stocks up swiftly. Many others including cryptos, meme stocks, the Magnificent Seven, and more have enjoyed their day in the limelight, but gold and the gold stocks have been largely ignored as their performance lagged everyone. Gold? Considered by many as a barbarous “relic”, even though it has been around as money and currency for upwards of 5,000 years. It’s been only 53 years since the end of the last gold standard. All previous experiments in fiat currencies eventually failed. One can print an endless amount of paper dollars, but gold is limited. No wonder $1,000 today only buys about 0.5 ounces of gold, whereas just 53 years ago $1,000 could buy almost 29 ounces of gold. That’s devaluation of the fiat currency. As we’ve shown, as debt and money supply rise, gold rises as well. It is not so much gold going up but currencies going down.
With the now record run to close at $2,238 this past week, support can be seen down to around $2,160. Below that a fall to $2,100 is possible. Ultimate support is now at $2,000. We may have seen that level for some time. Gold is once again becoming a bit overbought but, given the current head of steam, we could soon see $2,300. A firm break through $2,300 could send gold to its next targets up around $2,500. The drivers as usual will be geopolitical concerns, falling confidence in government, debt growth, and fears we could fall into a recession. Now, if only silver and the gold stocks would catch up.
Source: www.stockcharts.com
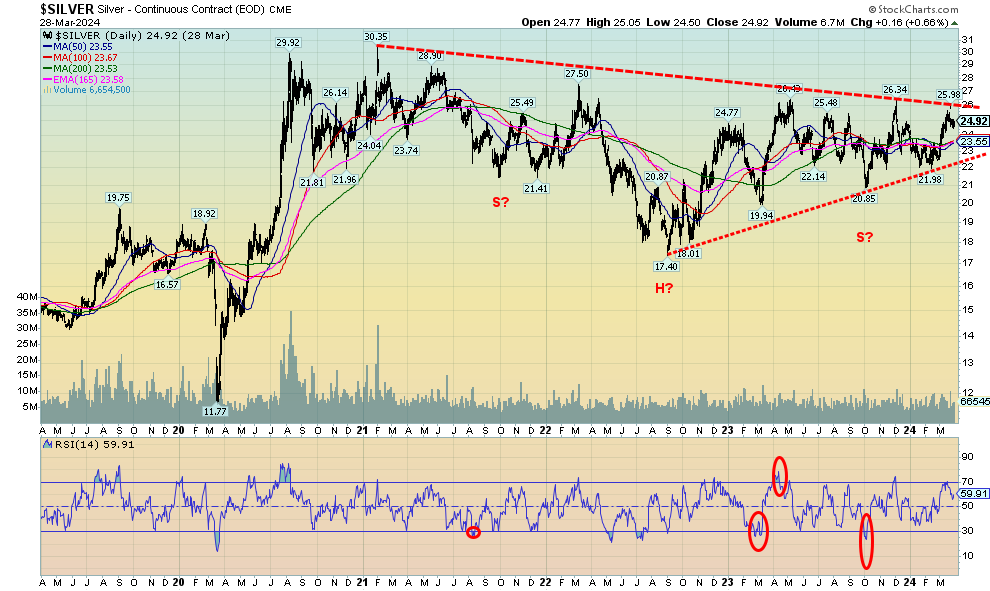
While all of the attention is focused on the record-breaking gold prices, we remain concerned about lagging silver. Yes, silver gained 0.3% this past week and is now up 3.5% on the year, but it continues to lag sorely behind gold, which was up 3.6% this past week and up 3.5% on the year. What’s worse, gold is making record prices and silver is nowhere near its all-time highs seen near $50 in 1980 and 2011. It is a divergence that has concerned us for some time. While conventional wisdom has both gold and silver going higher, one always wonders if silver is the right one and if so, it’s pointed down, not up.
However, silver has been making what appears to us as a potentially massive head and shoulders reversal pattern over the past three years or so. We just need it to bust up through the potential neckline near $26 and then take out that high of $27.50 seen back in 2022. If we do, targets may be up to $38/$40. Patience is a virtue, they say, but silver fans have been patient for too long and are due for their ray of sunshine that has so far only blessed gold. Naturally, we wouldn’t want to see a pullback that takes out that last important low at $21.98. We doubt that would happen, but a break would reward our patience. Maybe this week? Silver stocks enjoyed a good up week.
Source: www.stockcharts.com
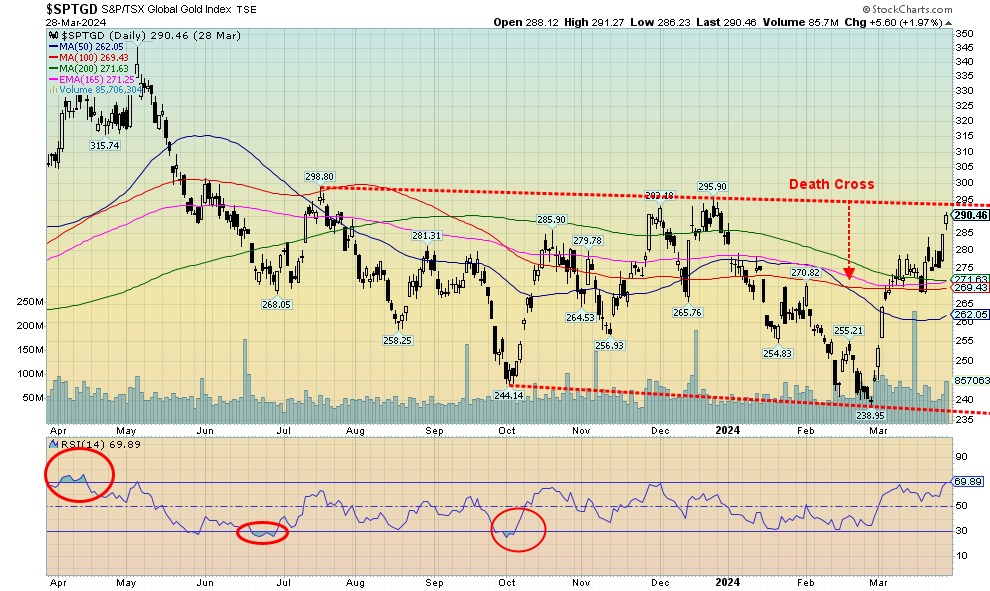
Thanks to record gold prices, the gold stock indices enjoyed a strong up week. The TSX Gold Index (TGD) gained 5.8% while the Gold Bugs Index (HUI) jumped 7.2%. Even some junior gold stocks jumped this past week but, overall, they remain well behind and undervalued. While the Gold/HUI ratio improved in favour of the HUI, the reality is that the gold stocks in general remain grossly undervalued. They still have not broken out although, as the chart notes, TGD is getting close to breaking over 295/300. Once firmly over (close basis and preferably as well over 310) potential targets are up to 350/355 and new highs over the May 2023 high. For comparison, the HUI needs to break out over 255 and has potential targets up to 310/315. That would still be short of the May 2023 high.
For the short term, the gold stock indices are approaching overbought. However, that is a condition that can remain in a strong market. The market has swiftly recovered with the TGD up 21% since that low in late February. Both the TGD and the HUI are now up on the year by 2.1% and 1.6% respectively. All is not lost for the gold bugs. The Gold Miners Bullish Percent Index (BPGDM) is up to 46.4 so it still has good room to move higher. Over 75 is getting into overbought range, but in a strong bull we could even make it to a 100.
The TGD chart looks positive, but a close over 295/300 would help convince us that we could be breaking out and on a good upward run. It’s a small market so it doesn’t take much of a shift to make the market rise quickly.
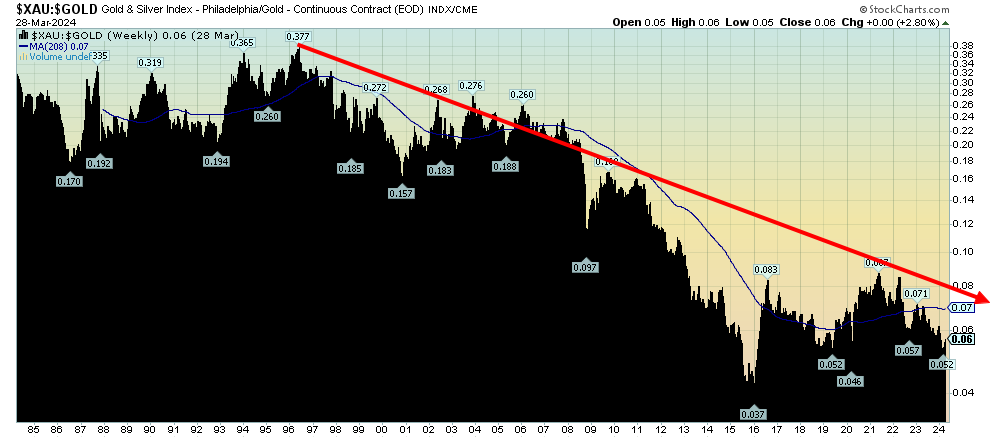
XAU/Gold Ratio
Source: www.stockcharts.com
Here’s another way of looking at how cheap gold stocks are vs. gold. Normally we look at the Gold/HUI ratio, a ratio that has shown that gold stocks are cheap vs. gold. This one is the Philadelphia Gold & Silver Index (XAU) to Gold Ratio. It has been in a steady downtrend since the mid-nineties. The worst was in 2015, when gold prices fell from a record high of $1,923 in 2011 to their nadir in December 2015 at $1,045, a decline of about 46%. The gold stocks were destroyed. The XAU fell about 84%. Arguably, the gold stocks vs. gold have been forming a bottom pattern. However, that is not as yet realized. Otavio Costa, an analyst at Crescat Capital, recently noted it is a shunned industry. Nobody is clamouring these days to become a geologist. Companies struggle to raise money. It is an industry that is mining and looking for limited product; however, it is product that is needed in industry. If so, buying into the industry is an opportunity. A breakout over 0.08 might start things percolating. It’s been down too long—and it’s a long way back to that 1995 high of 0.377.
Read the entire report: Technical Scoop: Bridge Disruption, Market Highs, Persistent Inflation
Disclaimer
David Chapman is not a registered advisory service and is not an exempt market dealer (EMD) nor a licensed financial advisor. He does not and cannot give individualised market advice. David Chapman has worked in the financial industry for over 40 years including large financial corporations, banks, and investment dealers. The information in this newsletter is intended only for informational and educational purposes. It should not be construed as an offer, a solicitation of an offer or sale of any security. Every effort is made to provide accurate and complete information. However, we cannot guarantee that there will be no errors. We make no claims, promises or guarantees about the accuracy, completeness, or adequacy of the contents of this commentary and expressly disclaim liability for errors and omissions in the contents of this commentary. David Chapman will always use his best efforts to ensure the accuracy and timeliness of all information. The reader assumes all risk when trading in securities and David Chapman advises consulting a licensed professional financial advisor or portfolio manager such as Enriched Investing Incorporated before proceeding with any trade or idea presented in this newsletter. David Chapman may own shares in companies mentioned in this newsletter. Before making an investment, prospective investors should review each security’s offering documents which summarize the objectives, fees, expenses and associated risks. David Chapman shares his ideas and opinions for informational and educational purposes only and expects the reader to perform due diligence before considering a position in any security. That includes consulting with your own licensed professional financial advisor such as Enriched Investing Incorporated. Performance is not guaranteed, values change frequently, and past performance may not be repeated.
About the author


Website: https://www.enrichedinvesting.com
Disclaimer: David Chapman is not a registered advisory service and is not an exempt market dealer (EMD) nor a licensed financial advisor. We do not and cannot give individualised market advice. David Chapman has worked in the financial industry for over 40 years including large financial corporations, banks, and investment dealers. The information in this newsletter is intended only for informational and educational purposes. It should not be considered a solicitation of an offer or sale of any security. The reader assumes all risk when trading in securities and David Chapman advises consulting a licensed professional financial advisor before proceeding with any trade or idea presented in this newsletter. David Chapman may own shares in companies mentioned in this newsletter. We share our ideas and opinions for informational and educational purposes only and expect the reader to perform due diligence before considering a position in any security. That includes consulting with your own licensed professional financial advisor.