Excerpt from this week's: Technical Scoop: Chainsaw Unemployment, Precious Haven, Market Roll
Gold appears to be correcting its recent run-up to over $2,900. Gold has failed to take out $3,000, with a high thus far of $2,974. We have now broken back under $2,900 and could now have potential targets down to $2,700/$2,750. Interim support would be seen at $2,850 and $2,800. Still, we appear to be on a fresh upward wave from lows seen in November/December 2024. Since then, we are up roughly 12.1%. We maintain targets up to $3,600 but it won’t be a straight-up move. This is the first correction since the lows in December 2024. As noted, we would not want to see a breakdown under $2,700 as that could signal the end of the current bull market.
Potentially more compelling are the undervalued gold stocks. While gold has gone to record multiple new all-time highs, the gold stocks remain moribund, undervalued and under appreciated. This is occurring even as they are up from their more recent lows seen in 2023. The Gold Bugs Index (HUI) remains down a huge 51% from its all-time high in 2011. The TSX Gold Index (TGD), on the other hand, is down just over 12% from its all-time high in 2011. Since 2020 the HUI, the weakest of the two gold stock indices, appears to be forming a large sideways pattern that ranges roughly from 200 to 370. The pattern is shown on the weekly chart below. These sideways patterns tend to be consolidation patterns not topping patterns. Ultimately, it should break to the upside. The breakout point would come at around 375. Potential targets then could be up to 575. The risk is a breakdown under 250. Then the lower end of the sideways pattern could be underway.
Gold Bugs Index (HUI) 2010–2025
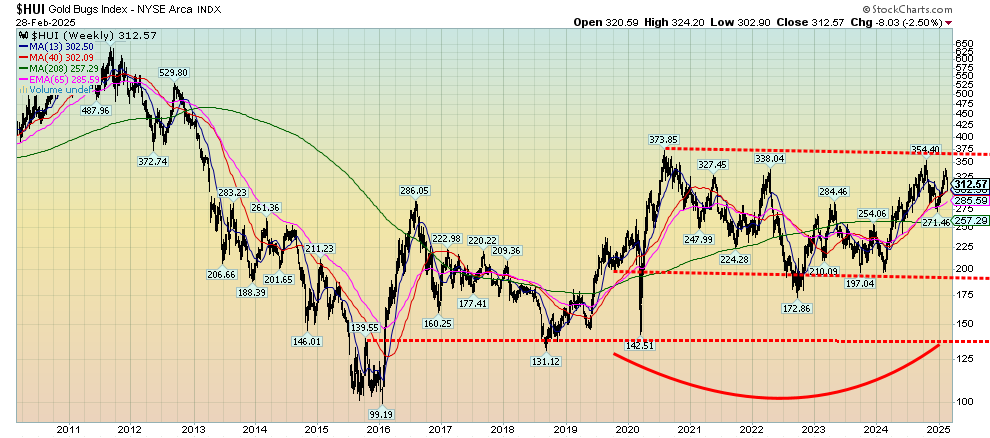
Source: www.stockcharts.com
The junior gold mining exploration stocks, which trade primarily on the TSX Venture Exchange (CDNX), are even more undervalued. Many are trading under the value of their gold holdings or valuations of under $100/ounce gold in the ground.
The most recent Personal Consumption Expenditures (PCE) prices, which the Fed tends to rely on, showed a gain of 2.5% year over year (y-o-y) which was as expected. That was only marginally better than the 2.6% rise the previous month. Month over month PCE prices were up 0.3% in February, below the expected 0.4%. Still, inflation rates remain sticky and definitely not under the Fed’s target of 2%. This suggests to us the Fed has little incentive to lower interest rates just yet. We continue to expect a clash at some point between President Trump and Fed Chair Powell. It probably won’t be a pleasant one and it could have a negative impact on the US$ Index, bond yields and the stock market. The Fed is not answerable to the White House or Congress but does report on its operations and outlook to Congress.
The Fed can control the short end of the market but not the long end, which is the purview of the bond market. The bond market cannot be controlled, primarily because it is too big and diverse and there in no one party in charge like the Fed. Right now, the bond market is being helped by the promise to slash the U.S. budget. Currently, the U.S. budget deficit is roughly 6.6% of GDP, the highest in the G7. A combination of budget cuts and tax hikes could bring the budget deficit more in line. Instead, they prefer to make huge tax cuts that will mainly benefit the wealthy and slash the civil service which could put upward pressure on unemployment as well as disrupting government services. The result is, at least in the short term, is that bond prices are rising, while yields are falling. The question is, will it last?
Globalization had a dampening effect on inflation. De-globalization will do the opposite and could cause inflation to rise, which in turn feeds into the actions of the Fed and the bond market. If the bond market sees higher inflation for a longer time, then inevitably yields will rise and prices will fall. Tariffs, combined with the geopolitics of tariffs, limit the flow of goods and stall the movement of labour. Tariffs beget tariffs and, ultimately, devastating trade wars that were behind the Great Depression (with the Smoot-Hawley tariffs of 1930). All this tends to make inflation structural, even as the economy may slow as result of rising unemployment. In a word, stagflation.
The U.S. 10-year treasury note backed off from 5%. Thus, 5% could prove to be a breakout point if interest rates were to turn back up. We have noted that the U.S. alone has some 33% or about $9.5 trillion of its public debt maturing in 2025. That’s a lot of refinancing. Foreign buyers have been pulling back. As of December 2024 foreign holdings were up $574 billion in the past year. China’s holdings are down $57 billion while Japan is down $55 billion. China and Japan are the two largest holders of U.S. treasuries. Some of the slack has been picked up by other G7 countries. But if foreigners become nervous about what is going on in the U.S., they could refuse to buy their treasuries or, worse, sell off their holdings for gold, a move that would ultimately put upward pressure on long-term yields but be very beneficial for gold.
Markets & Trends
|
|
|
|
% Gains (Losses) Trends |
|
||||
|
|
Close Dec 31/24 |
Close Feb 28/25 |
Week |
YTD |
Daily (Short Term) |
Weekly (Intermediate) |
Monthly (Long Term) |
|
|
Stock Market Indices |
|
|
|
|
|
|
|
|
|
S&P 500 |
5,881.63 |
5,954.50 |
(1.0)% |
1.2% |
down |
up |
up |
|
|
Dow Jones Industrials |
42,544.22 |
43,840.91 |
1.0% |
3.1% |
neutral |
up |
up |
|
|
Dow Jones Transport |
16,030.66 |
15,986.49 |
(0.3)% |
0.6% |
down |
up |
up |
|
|
NASDAQ |
19,310.79 |
18,847.28 |
(3.5)% |
(2.4)% |
down |
up (weak) |
up |
|
|
S&P/TSX Composite |
24,796.40 |
25,393.45 |
1.0% |
2.7% |
neutral |
up |
up |
|
|
S&P/TSX Venture (CDNX) |
597.87 |
614.64 |
(3.2)% |
2.8% |
down |
up |
neutral |
|
|
S&P 600 (small) |
1,408.17 |
1,363.73 |
(1.1)% |
(3.2)% |
down |
down (weak) |
up |
|
|
MSCI World |
2,304.50 |
2,447.54 |
(1.3)% |
6.2% |
up |
up |
up |
|
|
Bitcoin |
93,467.13 |
84,237.84 |
(11.9)% |
(9.9)% |
down |
up (weak) |
up |
|
|
|
|
|
|
|
|
|
|
|
|
Gold Mining Stock Indices |
|
|
|
|
|
|
|
|
|
Gold Bugs Index (HUI) |
275.58 |
312.57 |
(2.5)% |
13.4% |
neutral |
up (weak) |
up |
|
|
TSX Gold Index (TGD) |
336.87 |
400.17 |
(0.6)% |
18.8% |
up (weak) |
up |
up |
|
|
|
|
|
|
|
|
|
|
|
|
% |
|
|
|
|
|
|
|
|
|
U.S. 10-Year Treasury Bond yield |
4.58% |
4.21% |
(5.0)% |
(8.1)% |
|
|
|
|
|
Cdn. 10-Year Bond CGB yield |
3.25% |
2.92% |
(6.7)% |
(10.2)% |
|
|
|
|
|
Recession Watch Spreads |
|
|
|
|
|
|
|
|
|
U.S. 2-year 10-year Treasury spread |
0.33% |
0.21% |
(8.7)% |
(36.4)% |
|
|
|
|
|
Cdn 2-year 10-year CGB spread |
0.30% |
0.34% |
(12.8)% |
13.3% |
|
|
|
|
|
|
|
|
|
|
|
|
|
|
|
Currencies |
|
|
|
|
|
|
|
|
|
US$ Index |
108.44 |
107.56 |
0.9% |
(0.8)% |
down (weak) |
up |
up |
|
|
Canadian $ |
69.49 |
.6913 |
(1.6)% |
0.5% |
down |
down |
down |
|
|
Euro |
103.54 |
103.74 |
(0.8)% |
0.2% |
neutral |
down |
down |
|
|
Swiss Franc |
110.16 |
110.71 |
(0.7)% |
0.5% |
up (weak) |
down |
neutral |
|
|
British Pound |
125.11 |
125.79 |
(0.4)% |
0.5% |
up |
down |
neutral |
|
|
Japanese Yen |
63.57 |
66.41 |
(0.9)% |
4.5% |
up |
neutral |
down |
|
|
|
|
|
|
|
|
|
|
|
|
|
|
|
|
|
|
|
|
|
|
Precious Metals |
|
|
|
|
|
|
|
|
|
Gold |
2,641.00 |
2,848.50 |
(3.6)% |
7.9% |
up (weak) |
up |
up |
|
|
Silver |
29.24 |
31.50 |
(4.6)% |
7.7% |
neutral |
up |
up |
|
|
Platinum |
910.50 |
937.90 |
(5.0)% |
3.0% |
down |
down |
neutral |
|
|
|
|
|
|
|
|
|
|
|
|
Base Metals |
|
|
|
|
|
|
|
|
|
Palladium |
909.80 |
911.90 |
(8.0)% |
0.2% |
down |
down |
down |
|
|
Copper |
4.03 |
4.55 |
(0.2)% |
12.9% |
up |
up |
up (weak) |
|
|
|
|
|
|
|
|
|
|
|
|
Energy |
|
|
|
|
|
|
|
|
|
WTI Oil |
71.72 |
69.76 |
(0.9)% |
(2.7)% |
down |
down |
down |
|
|
Nat Gas |
3.63 |
3.83 |
(10.3)% |
5.5% |
up (weak) |
up |
neutral |
|
Source: www.stockcharts.com
* New All-Time Highs
Note: For an explanation of the trends, see the glossary at the end of this article.
New highs/lows refer to new 52-week highs/lows and, in some cases, all-time highs.
Under the Trump administration, things are beginning to implode both domestically and internationally. The actions of the Trump administration are impacting international relations (see the weekend “brawl” between Trump and Zelensky), by pulling out of international institutions such as WHO, and threatening to pull out of the WTO, NATO, and even the U.N. They are threatening to take over nations such as Canada, imposing tariffs that stall globalization, potentially leading to a severe recession or worse, firing potentially thousands in the U.S. civil service which would not only negatively impact delivery of government services but also directly negatively impact other businesses. It then feeds on itself.
Many are already feeling the negative impacts of the White House’s actions. Unemployment claims are rising, interest rates remain sticky, real estate markets are under pressure, the housing market is faltering, delinquencies are rising on a host of consumer debt, consumer sentiment is falling along with retail sales, commercial real estate is under pressure, and inevitably the banks will be under pressure. Finally as well, protests are rising. Could they turn violent?
Yet on Friday, despite bad news elsewhere and the brawl between Trump and Zelensky, the stock market rose, then it fell, then surged ahead as the DJI finished up 600 points. Volatility reigns. Is Friday’s action a sign we’ve bottomed? Not likely. We are reminded how in 1987 the stock market topped in August, then fell into a low on September 21. September 22 saw the market make a mild new low, then it rebounded with the DJI up over 3%. Yes, we rallied for the next eight days, but that was it. No new highs. On October 6, 1987, the market turned down sharply and what followed was the record-breaking collapse of October 1987, culminating in the October 19 stock market crash. A crash in March? We are reminded of the gyrations in March/April 2000 when things unraveled for the dot.com/high-tech market of the 1990s. Today it’s the MAG7 and AI. Friday’s sharp gain for the DJI was only 1.4%. Nonetheless, a 600-point move was dramatic after being down earlier. The DJI is outperforming the other indices in this downtrend. A sign of flight to quality.
The stock market appears to have made a potentially important top, but the major breakdown zones lie ahead. Bitcoin is breaking down, having plunged under $90,000. Even gold is faltering, despite being a safe haven. In past sharp declines, gold has tended to follow the market down, but then it is the first out of the chute. We saw that, especially in the 2008 financial crisis panic and again in the 2020 pandemic crisis. Oil prices are under pressure from a global supply glut and all is quiet for now on the geopolitical front, which could impact oil.
Chaos and volatility continue. But a warning. Warren Buffett dumped all his S&P 500 ETFs, and then Buffett’s company Berkshire Hathaway (BRK.A) made all-time highs. Buffett is sitting on a mountain of cash, even as the broader market of funds, etc. are at their lowest cash position in years.
Markets and trends follow. A lot of red ink this past week.
Markets & Trends
|
|
|
|
% Gains (Losses) Trends |
|
||||
|
|
Close Dec 31/24 |
Close Feb 28/25 |
Week |
YTD |
Daily (Short Term) |
Weekly (Intermediate) |
Monthly (Long Term) |
|
|
Stock Market Indices |
|
|
|
|
|
|
|
|
|
S&P 500 |
5,881.63 |
5,954.50 |
(1.0)% |
1.2% |
down |
up |
up |
|
|
Dow Jones Industrials |
42,544.22 |
43,840.91 |
1.0% |
3.1% |
neutral |
up |
up |
|
|
Dow Jones Transport |
16,030.66 |
15,986.49 |
(0.3)% |
0.6% |
down |
up |
up |
|
|
NASDAQ |
19,310.79 |
18,847.28 |
(3.5)% |
(2.4)% |
down |
up (weak) |
up |
|
|
S&P/TSX Composite |
24,796.40 |
25,393.45 |
1.0% |
2.7% |
neutral |
up |
up |
|
|
S&P/TSX Venture (CDNX) |
597.87 |
614.64 |
(3.2)% |
2.8% |
down |
up |
neutral |
|
|
S&P 600 (small) |
1,408.17 |
1,363.73 |
(1.1)% |
(3.2)% |
down |
down (weak) |
up |
|
|
MSCI World |
2,304.50 |
2,447.54 |
(1.3)% |
6.2% |
up |
up |
up |
|
|
Bitcoin |
93,467.13 |
84,237.84 |
(11.9)% |
(9.9)% |
down |
up (weak) |
up |
|
|
|
|
|
|
|
|
|
|
|
|
Gold Mining Stock Indices |
|
|
|
|
|
|
|
|
|
Gold Bugs Index (HUI) |
275.58 |
312.57 |
(2.5)% |
13.4% |
neutral |
up (weak) |
up |
|
|
TSX Gold Index (TGD) |
336.87 |
400.17 |
(0.6)% |
18.8% |
up (weak) |
up |
up |
|
|
|
|
|
|
|
|
|
|
|
|
% |
|
|
|
|
|
|
|
|
|
U.S. 10-Year Treasury Bond yield |
4.58% |
4.21% |
(5.0)% |
(8.1)% |
|
|
|
|
|
Cdn. 10-Year Bond CGB yield |
3.25% |
2.92% |
(6.7)% |
(10.2)% |
|
|
|
|
|
Recession Watch Spreads |
|
|
|
|
|
|
|
|
|
U.S. 2-year 10-year Treasury spread |
0.33% |
0.21% |
(8.7)% |
(36.4)% |
|
|
|
|
|
Cdn 2-year 10-year CGB spread |
0.30% |
0.34% |
(12.8)% |
13.3% |
|
|
|
|
|
|
|
|
|
|
|
|
|
|
|
Currencies |
|
|
|
|
|
|
|
|
|
US$ Index |
108.44 |
107.56 |
0.9% |
(0.8)% |
down (weak) |
up |
up |
|
|
Canadian $ |
69.49 |
.6913 |
(1.6)% |
0.5% |
down |
down |
down |
|
|
Euro |
103.54 |
103.74 |
(0.8)% |
0.2% |
neutral |
down |
down |
|
|
Swiss Franc |
110.16 |
110.71 |
(0.7)% |
0.5% |
up (weak) |
down |
neutral |
|
|
British Pound |
125.11 |
125.79 |
(0.4)% |
0.5% |
up |
down |
neutral |
|
|
Japanese Yen |
63.57 |
66.41 |
(0.9)% |
4.5% |
up |
neutral |
down |
|
|
|
|
|
|
|
|
|
|
|
|
|
|
|
|
|
|
|
|
|
|
Precious Metals |
|
|
|
|
|
|
|
|
|
Gold |
2,641.00 |
2,848.50 |
(3.6)% |
7.9% |
up (weak) |
up |
up |
|
|
Silver |
29.24 |
31.50 |
(4.6)% |
7.7% |
neutral |
up |
up |
|
|
Platinum |
910.50 |
937.90 |
(5.0)% |
3.0% |
down |
down |
neutral |
|
|
|
|
|
|
|
|
|
|
|
|
Base Metals |
|
|
|
|
|
|
|
|
|
Palladium |
909.80 |
911.90 |
(8.0)% |
0.2% |
down |
down |
down |
|
|
Copper |
4.03 |
4.55 |
(0.2)% |
12.9% |
up |
up |
up (weak) |
|
|
|
|
|
|
|
|
|
|
|
|
Energy |
|
|
|
|
|
|
|
|
|
WTI Oil |
71.72 |
69.76 |
(0.9)% |
(2.7)% |
down |
down |
down |
|
|
Nat Gas |
3.63 |
3.83 |
(10.3)% |
5.5% |
up (weak) |
up |
neutral |
|
Source: www.stockcharts.com
* New All-Time Highs
Note: For an explanation of the trends, see the glossary at the end of this article.
New highs/lows refer to new 52-week highs/lows and, in some cases, all-time highs.
Read the FULL report here: Technical Scoop: Chainsaw Unemployment, Precious Haven, Market Roll
Disclaimer
David Chapman is not a registered advisory service and is not an exempt market dealer (EMD) nor a licensed financial advisor. He does not and cannot give individualised market advice. David Chapman has worked in the financial industry for over 40 years including large financial corporations, banks, and investment dealers. The information in this newsletter is intended only for informational and educational purposes. It should not be construed as an offer, a solicitation of an offer or sale of any security. Every effort is made to provide accurate and complete information. However, we cannot guarantee that there will be no errors. We make no claims, promises or guarantees about the accuracy, completeness, or adequacy of the contents of this commentary and expressly disclaim liability for errors and omissions in the contents of this commentary. David Chapman will always use his best efforts to ensure the accuracy and timeliness of all information. The reader assumes all risk when trading in securities and David Chapman advises consulting a licensed professional financial advisor or portfolio manager such as Enriched Investing Incorporated before proceeding with any trade or idea presented in this newsletter. David Chapman may own shares in companies mentioned in this newsletter. Before making an investment, prospective investors should review each security’s offering documents which summarize the objectives, fees, expenses and associated risks. David Chapman shares his ideas and opinions for informational and educational purposes only and expects the reader to perform due diligence before considering a position in any security. That includes consulting with your own licensed professional financial advisor such as Enriched Investing Incorporated. Performance is not guaranteed, values change frequently, and past performance may not be repeated.
About the author


Website: https://www.enrichedinvesting.com
Disclaimer: David Chapman is not a registered advisory service and is not an exempt market dealer (EMD) nor a licensed financial advisor. We do not and cannot give individualised market advice. David Chapman has worked in the financial industry for over 40 years including large financial corporations, banks, and investment dealers. The information in this newsletter is intended only for informational and educational purposes. It should not be considered a solicitation of an offer or sale of any security. The reader assumes all risk when trading in securities and David Chapman advises consulting a licensed professional financial advisor before proceeding with any trade or idea presented in this newsletter. David Chapman may own shares in companies mentioned in this newsletter. We share our ideas and opinions for informational and educational purposes only and expect the reader to perform due diligence before considering a position in any security. That includes consulting with your own licensed professional financial advisor.