Excerpt from this week's: Technical Scoop: Cliff Leap, Dollar Breakdown, High Energy
Was silver in a mania? It certainly looked like it. However, this past week’s wipeout is putting a check on the mania. Silver soared 143% in 2025 and is still up 18% so far in 2026, despite the sharp setback. Were investors just chasing the latest meme/pet rock craze? Gold too has been rising, up 63% in 2025, and has already added another 12.6% in January. Retail investors are starting to jump in. When retail jumps in, it is sometimes a signal that a top is nigh. Yes, physical silver is in short supply and the premiums are huge. Go to SilverGoldBull.com www.silvergoldbull.com, www.silvergoldbull.ca where an ounce of an American silver eagle is offered at US$96, a 12% premium to spot. That is, if they have the product. However, we’ve seen silver offered at 25% premiums, particularly in Asia, and despite the premiums it’s selling.
It all sounds insane. But maybe it isn’t. It should be. Interest rates are positive, yet both gold and silver have been rising at a much faster pace. We don’t have the inflation/stagflation of the 1970s, a period that saw silver soar to $50 when the Hunt Brothers were trying to corner the market (they failed). Nor even 2009–2011 when both gold and silver were rising rapidly because of the 2008 financial crisis, with the saviour being 0% interest rates and massive doses of quantitative easing (QE).
So, what’s going on? As we have explained, this is not an inflation hedge. It’s a solvency crisis. The world is awash with debt and no more so than the U.S. But the U.S. can’t go bankrupt, can it? Or even Japan and they have a bigger debt crisis against the backdrop of sharply rising interest rates. The U.S. dollar is the world’s reserve currency. So, they can bail themselves out even as they add upwards of $2 trillion new debt every year, can’t they?
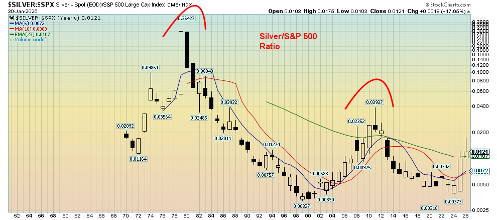
A way of looking at this is through the silver/S&P 500 ratio. We flipped it on its end and, instead of the Dow/Gold ratio, we’re using silver compared to the S&P 500. At the 1980 peak, an ounce of silver could buy 36.5₵ of the S&P 500. Of course, that changed and by 1999 an ounce of silver could only purchase 0.3₵ of the S&P 500. Fast forward to the 2011 peak where silver could buy 4₵ of the S&P 500. Silver plunged again and by 2020 an ounce of silver would again only get you 0.3₵ of the S&P 500. Today, even with silver at record prices that many think are insane, an ounce of silver can only buy 1.2₵ of the S&P 500. That’s a 97% discount to the 1980 peak and a 70% discount to the 2011 peak.
By comparison, silver is cheap today (gold too), or the S&P 500 is too expensive. To reach that 1980 peak, the S&P 500 would have to fall to 305 (which is not likely). Even to reach the 2011 peak the S&P 500 would have to fall to around 2,800, a 60% drop (note that the S&P 500 fell 57% in 2007–2009). The stock market is pricing in confidence with the U.S. dollar and that the debt is manageable, even with deficits of 6% annually. But now the U.S. dollar is falling (loss of confidence?) and both gold and silver are pricing in loss of confidence as their prices soar. We are nowhere near the levels seen in 1980 and 2011. Today, the stock market does not look like a good bet.
Silver/S&P 500 Ratio 1970–2026 Yearly

Source: www.stockcharts.com
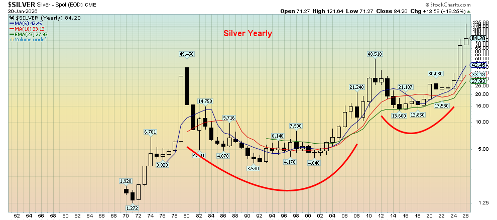
Silver rose over 2,500% from 1971 when the gold standard ended to its 1980 peak (close basis). Where are the Hunt Brothers when you need them? That cup and handle pattern initially projected to around $85. We surpassed that and the next target was near $108. We have now surpassed that. Third target $144. We’re working on it. A 2,500% move today from that low in 2015 would take us to $340. Stay tuned.
Source: www.stockcharts.com
Following a $1,268 move for gold prices in 2026 the inevitable correction came. It was a doozy. Gold peaked at $5,608 on Thursday before the correction (crash?) got underway. Then gold fell $754 in two days or 13.4%. A mini-crash? Silver was worse, falling 27% on Friday. Definitely a crash. Platinum dropped almost 17%. On the week gold doesn’t look too bad, losing only 2.5%. Silver lost 17.8% while platinum fell 22.5%. Palladium was off 18.2%. Copper was up 0.5% but well down from its all-time high at $6.58 seen this past week. The gold stocks took it on the chin as well with the Gold Bugs Index (HUI) down 11.7% and the TSX Gold Index (TGD) down 11.8%.
So, what was this estimated $7 trillion wipeout all about? Derivatives played a big role. Gold’s derivatives through futures, options, future rate agreements, ETFs, etc. had a crypto moment. Too much leverage and when the avalanche started it couldn’t be stopped. There were announcements of more margin requirements at the Chicago Mercantile Exchange (CME). Then we suspect the bullion banks stepped in and added and along the way stops were triggered. Nervous nellies panicked and the crash was on. Gold was dumped. Silver was slaughtered. There was also east/west arbitrage: one could buy physical in the U.S. and sell in Asia and take advantage of higher price levels. Nonetheless, for long-term buyers the fundamentals remain the same, particularly for silver which is in short supply physically but with lots of paper silver (note the silver chart that follows). It’s the same situation with gold where there is an estimated 100–300 ounces of paper gold for every ounce of physical gold.
The reasons for holding gold haven’t gone away. We’re still grappling with too much debt, the potential for a sovereign debt crisis, and ongoing geopolitical conflicts with Russia/Ukraine, Israel/and everyone else. Add in threats to bomb Iran and an oil embargo on Cuba. As well, ongoing domestic political conflicts on the streets of the U.S. and in the halls of the Capitol in Washington D.C. and an erratic president who threatens other countries with annexation.
Nonetheless, Friday’s action saw that what goes up fast comes down even faster. A week and half gains were wiped out in a nanosecond.
Gold hit some support this past week. But a drop through $4,600 could trigger more losses. Long-term support and the 200-DMA isn’t until around $3,800. Regaining back above $5,400 could trigger new highs. However, given the strength of the drop, we at best face a period of consolidation before another leg up gets underway. And the sell-off may not yet be over. Next support is in the $4,300/$4,400 zone. All this was a caution to not get complacent. We were originally looking for a high for gold/silver in February. It came early. Could February now give us a low?
Source: www.stockcharts.com
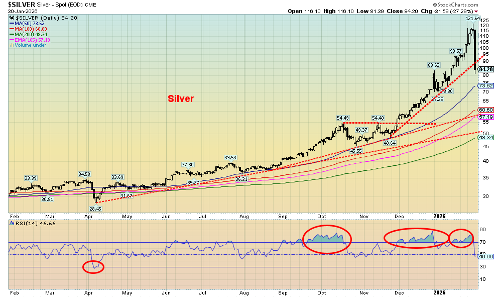
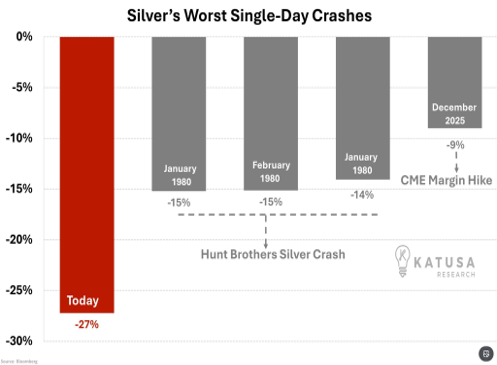
WIPEOUT! That’s about all we can say about the devastating but also surprising collapse of silver this past week. After screaming through $100 and then $110, hitting an all-time high peak of $121.64, silver turned tail and collapsed almost 31% in a mere two days to $84.20, going through $100 again only this time to the downside. The collapse on Friday of 27.3% was a record day. Not even the Hunt Brothers could pull that one off. On the following page there’s a nifty chart showing the worst silver crashes.
So, what gives? After all, silver has become a critical mineral used in all sorts of stuff, especially in the defense industry, EVs, solar panels etc. But, as we have noted, there are some 200–400 (some say around 350) paper ounces for every one ounce of physical silver. That’s a lot of leverage, both up and down. If an avalanche starts, it may be impossible to get out of the way. Spreads between London and Shanghai exploded. Spreads between paper silver and physical silver also rose. This was a technical collapse, not a fundamental one.
All this all started after President Trump announced Kevin Warsh as the next Fed Chair. Despite many questions about Warsh – i.e., is he a hawk or a dove, is he a puppet of President Trump or not – the market perceived it as negative for the precious metals and positive for the U.S. dollar. The CME raised margin requirements. Margin calls came, liquidation got underway. It cascades onto itself. Silver was still offered at a $10 premium to spot in North America but could be as high as $25 in Asia.
Before this drop, silver soared 72% in January or roughly $50. That’s clearly a bit overdone. The Relative Strength Index (RSI) consistently showed as overbought. Not so much anymore, having fallen to a neutral 47. But oversold undoubtedly beckons. What’s key is below $69/$70, the most recent daily low. As long as we can hold that level, we should be okay, although the repair to this wipeout won’t happen overnight. If that zone fails, then we don’t see any strong support until we get to $57/$60.
It was a dramatic wipeout. But, as with gold, the conditions and reasons behind the rise have not gone away. The 1980 peak was the Hunt Brothers’ attempt to corner the silver market. Fallout from the 2008 financial crisis, QE, and a government shutdown helped drive the 2011 peak. But this time, outside of the appointment of Warsh, there was no other obvious reason. Chaos continues on the streets of the U.S., and no peace deals exist for Russia/Ukraine or Israel/Gaza. President Trump continues to threaten everyone with annexation. There are growing signs that the U.S. could tip over into recession.
Source: www.bloomberg.com, www.katusaresearch.com, www.syzgroup.com
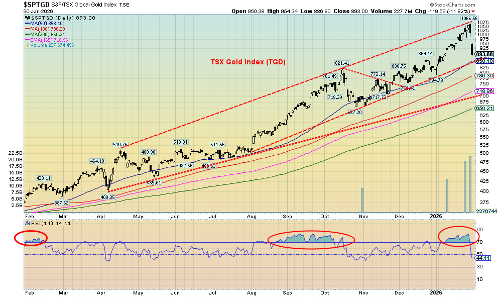
Source: www.stockcharts.com
The bad news is that the gold stocks were clobbered this past week. The good news is that they did better than silver. Over two days, Thursday and Friday, of this past week the TSX Gold Index (TGD) fell 16.3%. On the week, the TGD was down 11.8%. It was the same for the Gold Bugs Index (HUI) as it fell 11.7% on the week. Individual stocks fell, in some cases more, others less. The trigger, of course, was the massive liquidation in the gold and silver paper markets. The RSI for the TGD went from overbought to close at a neutral 44.1 this past week.
We are now fast approaching channel support near 860 and the 50-day MA. As long as that holds, the trend remains up. Below that, support appears more solid in the 650/660 zone. Unfortunately, that is another drop of 27%. The 200-DMA is at 650. Interim support can be seen around 790 and 715. For the long-term, a drop under 650 would signal the bull market is officially over. There is a gap just above that could be enticing to fill. Returning back above 1,000 would be positive and suggest possible new highs ahead. We don’t see that happening soon. A period of consolidation should follow any final low. That could begin as early as this coming week.
Read the FULL report here: Technical Scoop: Cliff Leap, Dollar Breakdown, High Energy
DisclaimerDavid Chapman is not a registered advisory service and is not an exempt market dealer (EMD) nor a licensed financial advisor. He does not and cannot give individualised market advice. David Chapman has worked in the financial industry for over 40 years including large financial corporations, banks, and investment dealers. The information in this newsletter is intended only for informational and educational purposes. It should not be construed as an offer, a solicitation of an offer or sale of any security. Every effort is made to provide accurate and complete information. However, we cannot guarantee that there will be no errors. We make no claims, promises or guarantees about the accuracy, completeness, or adequacy of the contents of this commentary and expressly disclaim liability for errors and omissions in the contents of this commentary. David Chapman will always use his best efforts to ensure the accuracy and timeliness of all information. The reader assumes all risk when trading in securities and David Chapman advises consulting a licensed professional financial advisor or portfolio manager such as Enriched Investing Incorporated before proceeding with any trade or idea presented in this newsletter. David Chapman may own shares in companies mentioned in this newsletter. Before making an investment, prospective investors should review each security’s offering documents which summarize the objectives, fees, expenses and associated risks. David Chapman shares his ideas and opinions for informational and educational purposes only and expects the reader to perform due diligence before considering a position in any security. That includes consulting with your own licensed professional financial advisor such as Enriched Investing Incorporated. Performance is not guaranteed, values change frequently, and past performance may not be repeated.
About the author


Website: https://www.enrichedinvesting.com
Disclaimer: David Chapman is not a registered advisory service and is not an exempt market dealer (EMD) nor a licensed financial advisor. We do not and cannot give individualised market advice. David Chapman has worked in the financial industry for over 40 years including large financial corporations, banks, and investment dealers. The information in this newsletter is intended only for informational and educational purposes. It should not be considered a solicitation of an offer or sale of any security. The reader assumes all risk when trading in securities and David Chapman advises consulting a licensed professional financial advisor before proceeding with any trade or idea presented in this newsletter. David Chapman may own shares in companies mentioned in this newsletter. We share our ideas and opinions for informational and educational purposes only and expect the reader to perform due diligence before considering a position in any security. That includes consulting with your own licensed professional financial advisor.