Silver Excerpt -- Read the full weekly report on GoldSeek.com (Technical Scoop: Financial floods, bubble busts, inflation solution, currency strain, stalemate rally, value up, commodity shine)

Source: www.stockcharts.com
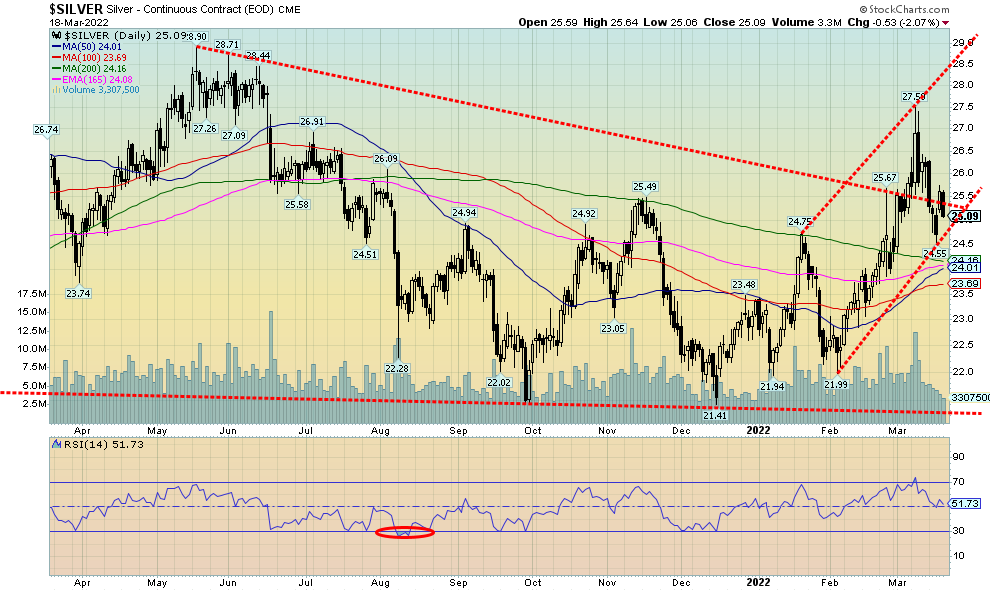
Silver fell 4.1% this past week, hitting a low of $24.55 just above the 200-day MA currently at $24.16. So far, this looks like a normal correction and a test of the 200-day MA. We’d be more concerned if we were to break under $24 and especially under $23.50. At that level we’d have to consider the bull move over. The decline from the high of $27.50 was roughly 11%, a fairly normal correction. The decline this past week appears to have created a well-defined bull channel. But breakdowns under our points would put us on the defensive. We continue to be concerned that gold made new highs but silver isn’t even close. These are divergences that at help maintain some degree of caution and not get overly bullish as the gold people tend to do. But we like the looks of the bottom pattern that was made between the May high and the recent breakout of the downtrend line. Yes, we tested back under but so far it appears as a normal correction. We may not be quite finished, but as long as we hold the low of the past week at $24.55, we should be okay. However, as noted, the real line in the sand comes at $24 and $23.50. To the upside, we need to regain above $26.50 and above $26.80 new highs are probable. Above those levels the next band of resistance can be seen at the May highs between $27.25 and $29.

Source: www.cotpricecharts.com
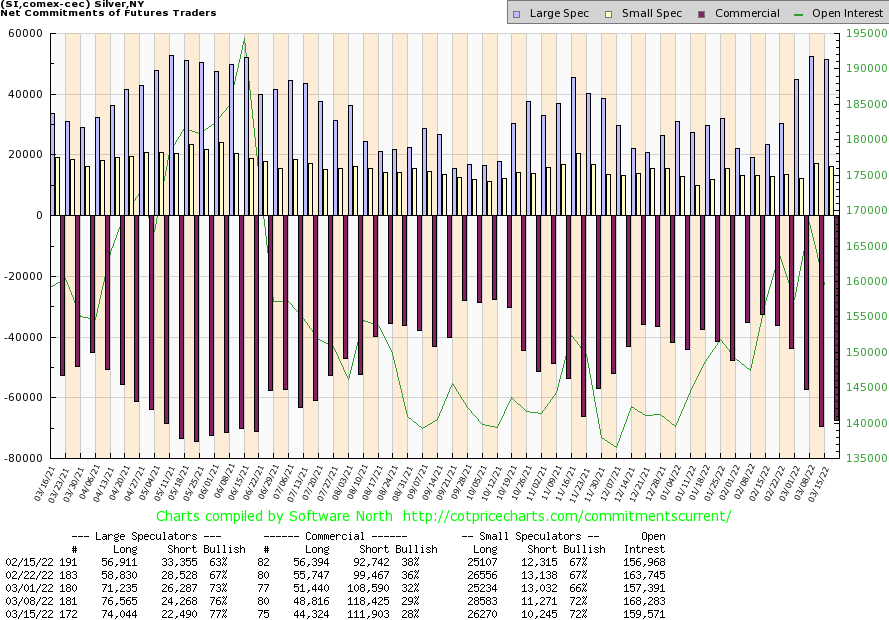
The silver commercial COT slipped to 28% this past week from 29% as long open interest fell over 4,000 contracts but short open interest also declined off about 7,000 contracts. Overall open interest fell about 9,000 contracts on a down week, suggesting that the decline was corrective only and not the start of a new move to the downside. The large speculators COT rose to 77% from 76% as their long open interest fell over 2,000 contracts while short open interest also fell down about 2,000 contracts. The COT, as we note, only goes to Tuesday so next week’s COT will determine whether any further shorts were covered in this sell-off.

Source: www.stockcharts.com
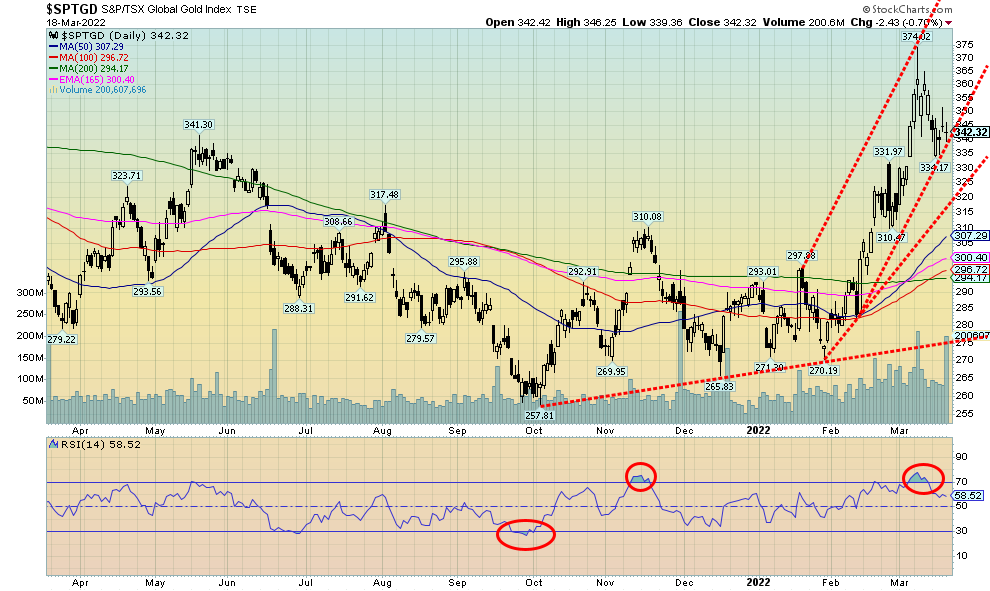
The gold stocks followed gold/silver lower this past week with the TSX Gold Index (TGD) falling 3.8% and the Gold Bugs Index (HUI) off 2.7%. That still leaves them up in 2022 17.2% and 17.5% respectively. Given the decline for both gold and silver the gold stocks, we believe, held in quite well. Even the Gold Miners Bullish Percent Index (BPGDM) pulled back to 72 from 80. That puts the sentiment indicator back in high neutral territory. Over 80 is considered overbought. During the 2020 run to new all-time highs the BPGDM hit 100.
What we appear to have done this past week is to create a more balanced bull channel. The TGD would have had to break down under 320 to consider a top confirmed. But now we have a good parallel channel. A breakdown under 340, which we admit is very close, could suggest further declines. Regaining above 350 would be positive and above 365 would suggest new highs. We are reminded that during the run-up to new all-time highs in 2011 there were at least three pullbacks of 20% or more. Thin markets, such as gold stocks, are subject to some volatile moves. This initial pullback was about 11% and a further decline would not be a surprise. As long as we were to hold 320, we’d consider the bull market intact.
The decline has eased overbought conditions and moved the RSI down into neutral territory. There were no negative divergences on the daily charts at the recent highs. For these reasons we remain positive on gold stocks going forward. As well, the gold/HUI ratio at 6.34 is still showing gold stocks as cheap vs. gold. Gold stocks aren’t expensive vs. gold until under 2.5. We haven’t seen that since 2010/2011. The all-time high was 10.9 back in 2015.
Read the full report on GoldSeek:
Technical Scoop: Financial floods, bubble busts, inflation solution, currency strain, stalemate rally, value up, commodity shine


