Excerpt from this week's: Technical Scoop: Contention Countdown, Halloween Scare, Precious Warning

Source: www.stockcharts.com
Gold is the safe haven against geopolitical gyrations, domestic political gyrations, and accumulation of massive debt by governments, corporations, and individuals. It is nobody’s liability. It is not necessarily a hedge against inflation or deflation but could turn out to be. It rises when faith is lost in the system and gold becomes the safety valve. And that is real bullion—not gold stocks, not ETFs, mutual funds, or any other way that could hold gold. Bitcoin is not the safe haven. It’s virtual. If there is a fear about gold, it is the fear of government confiscation. It happened before in the 1930s when gold was revalued to $35/ounce. It was at the time a devaluation of the U.S. dollar and a revaluation of gold. But only gold bars, etc. were confiscated, not gold collectible coins. President Nixon ended the gold standard for good in August 1971 when he closed the gold window and the world turned to floating fiat currencies, backed by nothing except a government’s promise to pay—an IOU.
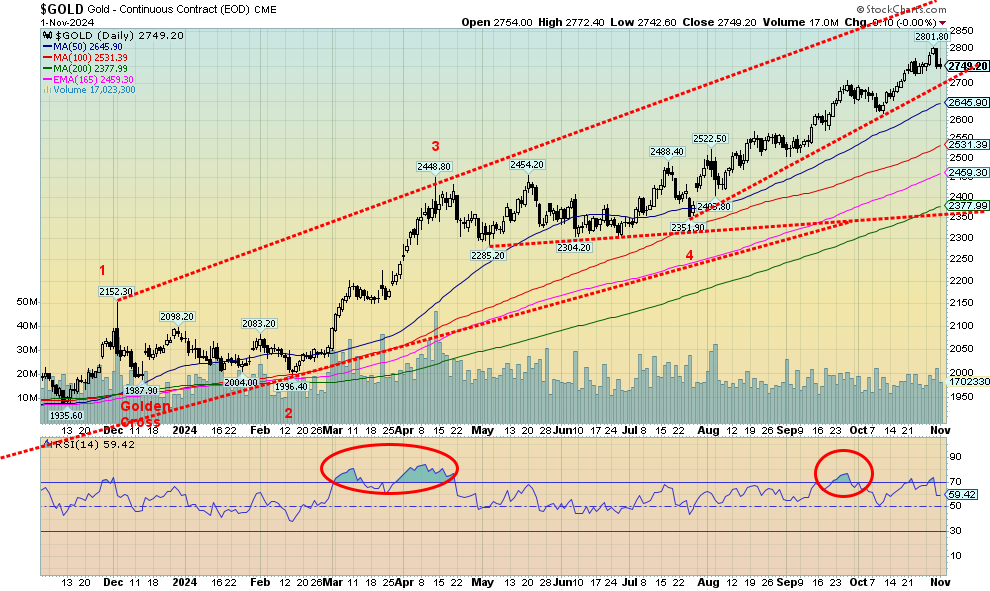
Against this backdrop, gold once again made fresh all-time highs, but then yanked back to a small loss due to some better than expected U.S. economic numbers sparking the US$ Index up. Also, we still have the ongoing turmoil in the Middle East and the extremely contentious U.S. election where one candidate has already declared that if he doesn’t win it was fraudulent. Gold has been rising steadily with periodic pullbacks that are inevitably bought. Yes, we have a breakdown point that would signal a much bigger correction. That comes in initially at $2,700. It could set off a deeper correction, but gold remains a bull as long as we remain over $2,400. It was just a steep correction. We note as well how gold has pulled back every time it became overbought with an RSI over 30 (circles). The RSI only briefly touched over 70 the last couple of weeks so we didn’t circle those.
On the week, gold made all-time highs, then reversed and closed lower by 0.2%. That’s not much so the reversal is not damaging for the longer term. Silver was hit harder, down 3.3%. Platinum fell 3.3% as well. Of the near precious metals, palladium fell 7.8% but copper was flat. The gold stocks were hit as the Gold Bugs Index (HUI) fell 4.1% and the TSX Gold Index (TGD) was off 3.6%. Both remain up over 30% in 2024 as do gold and silver. But palladium and platinum are down on the year, although copper is up a modest 12%. You want to see palladium, platinum, and copper rising as well. It’s the old Dow Theory that the indices (commodities) must confirm each other.
Our targets remain for $3,000 and possibly up to $3,600. This coming week should be filled with drama. No matter what and regardless of the temporary pullback, gold is going higher.

Source: www.stockcharts.com
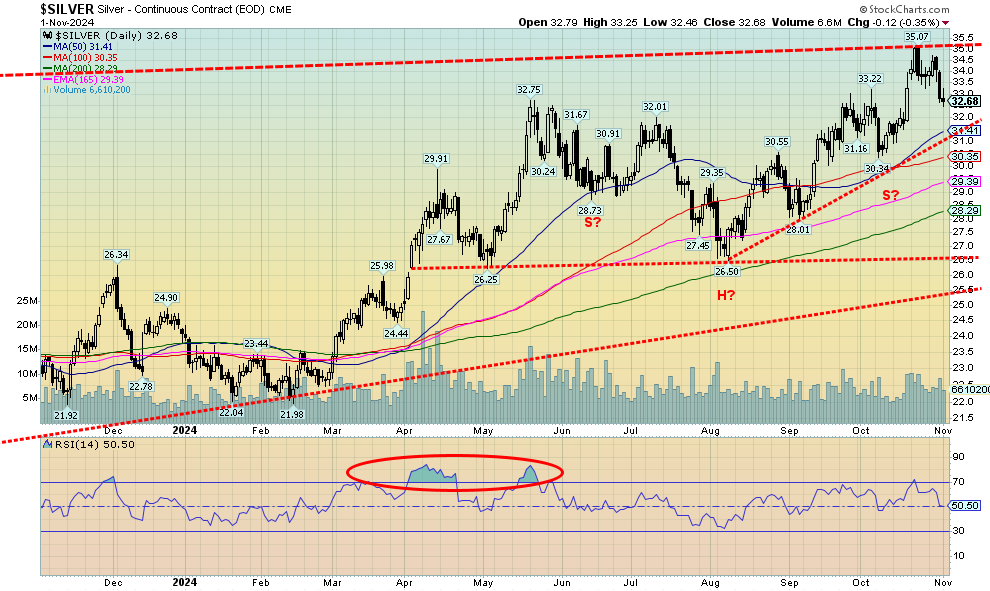
Silver followed gold lower this past week, except it got hit harder. That’s not unusual as we have noted that silver tends to lead both up and down. Silver fell 3.3% this past week to gold’s drop of 0.2%. We are now down 7% from that high seen a week or so ago. But we continue to hold well above the uptrend line from that last low at $26.50 in early August. On the year, silver remains up 35.7%, outpacing gold. But it’s been a back-and-forth effort as a rise is met by a pullback. Some of it, we know, is nervous nellies selling at the first sign of trouble, especially if they have a profit. That pattern still looks like an awkward head and shoulders bottom and we did break over $33/$33.50 where the neckline would have been. So, is this just the pullback to test the breakout? If we break down under $30.35, we’ll confirm a false breakout. Our targets on the breakout were to be $39/$40. They still can be, but we must hold above $31.50 now. Predictably, volume on the pullback has eased. A breakout further now is new highs above $35.07. A move back above $34.50 would be positive.

Source: www.stockcharts.com
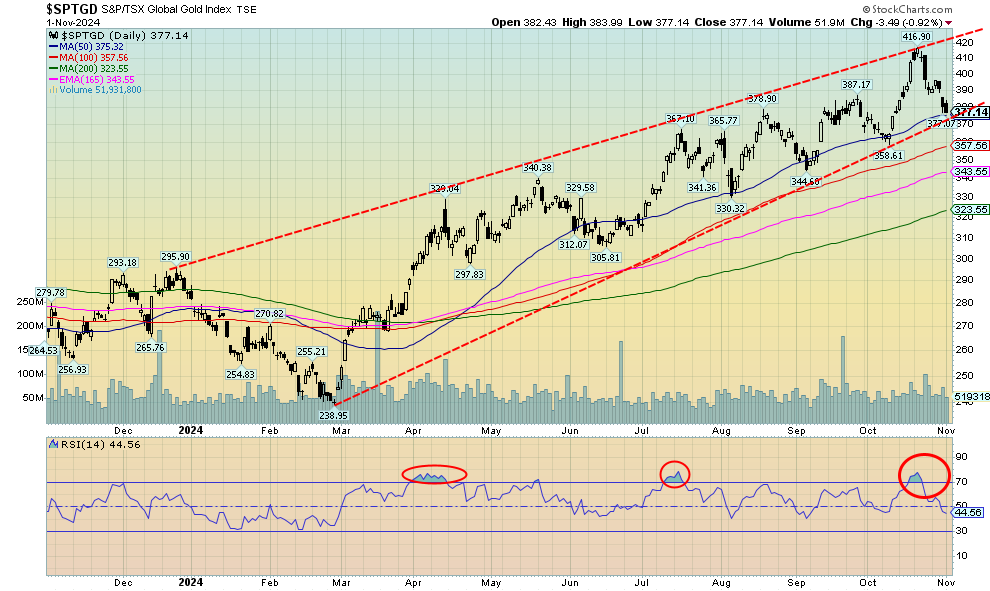
If there is a positive to be taken from the pullback in the gold stocks, it’s that this is the fifth pullback from that low in February 2024. The pullbacks have been 10%, 10%, 9%, 7%, and this time about 10% so far. Each time the pullback saw the RSI dip to 50 or a bit under. The current RSI is 44.6. We are also close to an uptrend line from that February 2024 low. The constant pullbacks indicate strength to us. So far, we see no topping signs. Our expectations remain that once this pullback is finished, we should move higher once again. Grant you, a break under 370 would break the uptrend line and potentially set us up for a further pullback in the 15%–20% range. Support can be seen at 355, 340, and finally 320. For now, it is wait and see through the election and the Fed this coming week. But the trend is up and we would not consider it over until we bust under 320.
Read the FULL report here: Technical Scoop: Contention Countdown, Halloween Scare, Precious Warning
Disclaimer
David Chapman is not a registered advisory service and is not an exempt market dealer (EMD) nor a licensed financial advisor. He does not and cannot give individualised market advice. David Chapman has worked in the financial industry for over 40 years including large financial corporations, banks, and investment dealers. The information in this newsletter is intended only for informational and educational purposes. It should not be construed as an offer, a solicitation of an offer or sale of any security. Every effort is made to provide accurate and complete information. However, we cannot guarantee that there will be no errors. We make no claims, promises or guarantees about the accuracy, completeness, or adequacy of the contents of this commentary and expressly disclaim liability for errors and omissions in the contents of this commentary. David Chapman will always use his best efforts to ensure the accuracy and timeliness of all information. The reader assumes all risk when trading in securities and David Chapman advises consulting a licensed professional financial advisor or portfolio manager such as Enriched Investing Incorporated before proceeding with any trade or idea presented in this newsletter. David Chapman may own shares in companies mentioned in this newsletter. Before making an investment, prospective investors should review each security’s offering documents which summarize the objectives, fees, expenses and associated risks. David Chapman shares his ideas and opinions for informational and educational purposes only and expects the reader to perform due diligence before considering a position in any security. That includes consulting with your own licensed professional financial advisor such as Enriched Investing Incorporated. Performance is not guaranteed, values change frequently, and past performance may not be repeated.


