Silver Excerpt -- Read the full weekly report on GoldSeek.com
The most interesting story of the week was the West’s announced attempts to prevent Russia from utilizing its gold reserves. Russia’s foreign reserves have been effectively frozen to the extent that they are held with the Fed, the ECB, etc., but Russia’s gold is held in Russia and Russia also has substantial yuan reserves held with PBOC. China has shown no propensity to go along with Western sanctions. However, freezing foreign reserves puts all countries on notice as to whether your reserves are really yours. With the sanctions on gold, many countries that hold gold with the Fed and other central banks could get nervous and demand that their gold be repatriated. But does the Fed have the gold? When Germany asked for its gold back, the Fed said it would take seven years. Ultimately, it took four. But would the Fed even adhere to requests to repatriate other countries’ gold? That, given the current climate, is questionable.
While the West can put sanctions on Russian gold, Russia could easily have its gold sold in markets in Asia in small amounts. That gold can then be melted down and refined under the stamp of another country. China, who has been accumulating gold, would be a natural source for sales. As well, Russia can easily replenish its gold supply, given they are the world’s third largest producer behind China and Australia and hold the world’s second largest reserves of gold behind Australia. The CBR could purchase all gold produced in Russia and that would not be subject to sanctions. But the fact that they are attempting to sanction Russia’s gold could spark turmoil in the gold market. And that would be bullish for gold. Finally, as we noted Russia could demanding payment from unfriendly countries for Russia’s oil and gas. But if that didn’t work, could Russia demand payment in gold and silver? It could happen. The gold market would descend into chaos. There is simply not enough gold and silver.
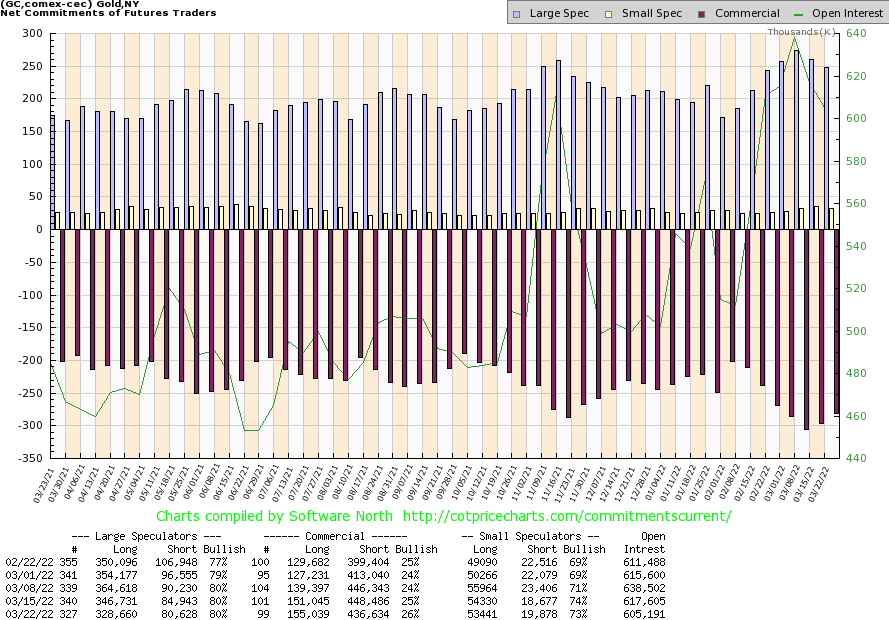
Source: www.cotpricecharts.com
The gold commercial COT (bullion companies and banks) rose to 26% this past week from 25%. The improvement is welcomed. Long open interest rose about 4,000 contracts while short open interest fell about 12,000 contracts—the best combination. As to the large speculators (hedge funds, managed futures, etc.), their COT was steady at 80% but longs fell about 18,000 contracts even as shorts also fell down just over 4,000 contracts. Overall open interest fell by over 12,000 contracts. We are encouraged by the rise in the gold commercial COT but, overall, the week saw basically short covering as opposed to new longs.
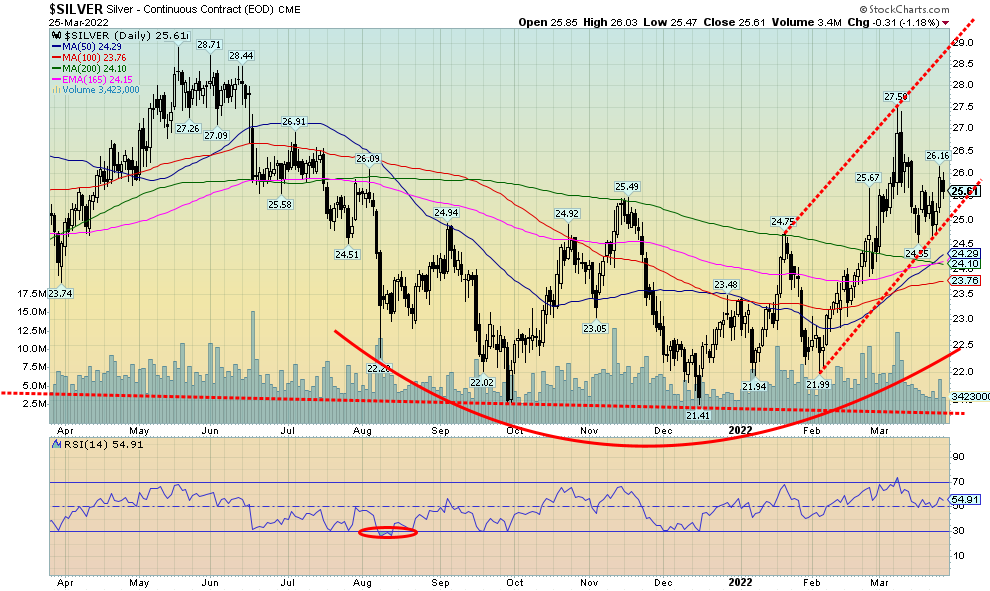
Source: www.stockcharts.com
Silver prices rose about 50 cents this past week or 2.1%. Silver is now up 9.7% on the year. Silver held its uptrend line with the low this week at $24.70. Silver’s recent spike took it to $27.50, so that level remains a target to be taken out. Silver broke out of a wedge triangle back in February. That breakout projects up to at least $31/$32. Many believe that over $30 silver has even higher potential. The high last February 2021 was $30.35. The top of the channel right now is up around $29. A move over $28.25 would suggest that new highs are probable. Meanwhile, silver needs to hold above $25 support and the uptrend line. The moving averages are turning up and MA followers can note the golden cross of the 50-day moving above both the 100 and 200-day MAs. The 100-day MA still lags behind the 200-day MA but is rising nicely now. The trend is up across all time frames. While $25 is important support, the drop-dead zone is a breakdown under $23.75. Under $22.85 new lows are probable. One thing we can’t help but notice is the huge premiums for silver coins. One-ounce Maple Leafs at SilverGoldBull (www.silvergoldbull.ca) are trading at a 38% premium to spot silver in Cdn$, although that drops if you were purchasing more in bulk. That tells us the demand is there and continues to support potentially higher prices for silver.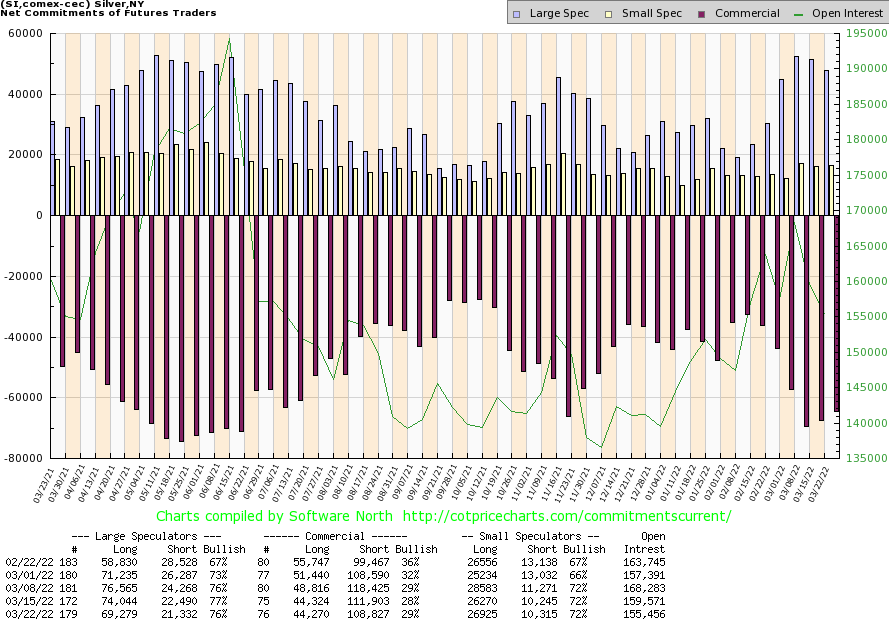
Source: www.cotpricecharts.com
The silver commercial COT improved to 29% this past week from 28%. Long open interest was largely unchanged but short open interest fell about 3,000 contracts. Overall open interest contracted around 4,000 contracts, suggesting that much of the action again this past week was short covering. The large speculators COT slipped to 76% from 77% as they lost almost 5,000 longs but also 1,000 or so shorts. The improvement is welcome but, overall, this week’s silver was underwhelming, given that there were no new longs.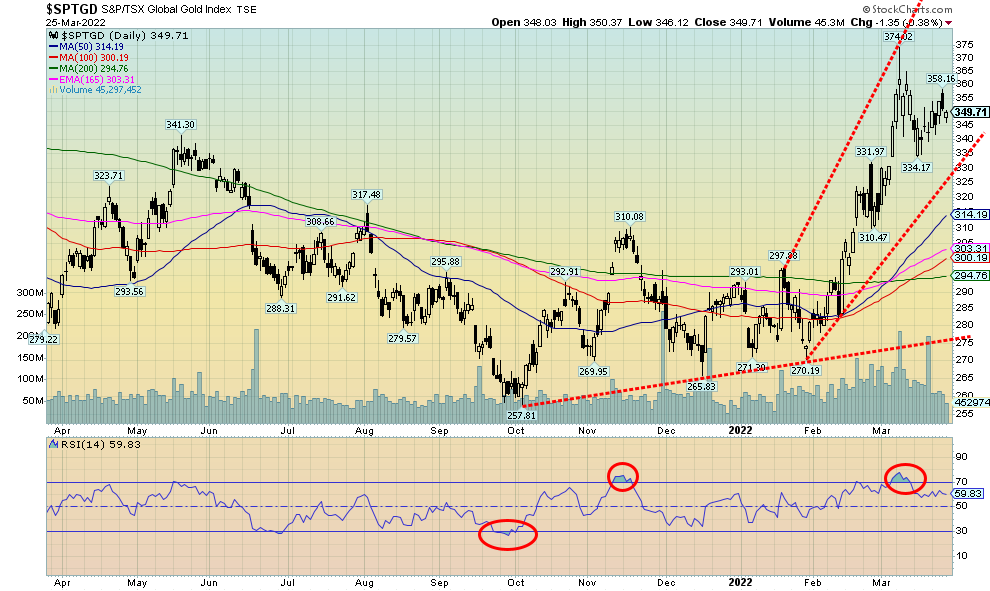
Source: www.stockcharts.com
Both gold stock indices gained this past week with the TSX Gold Index (TGD) up 2.2% and the Gold Bugs Index (HUI) up 3.5%. However, for the TGD the recent 374 spike remains in place. The correction took the TGD down 10.7% from the spike high. So far, a fairly normal correction that fell in an abc corrective fashion. The question is, this just an upward correction to the recent decline or the start of a new up leg? A rise above 365 would suggest new highs ahead. But a decline now back through 340 could suggest new lows ahead. The uptrend line currently near 330 could be a draw. Whenever markets get too far from their 200-day MA a correction usually follows. At the recent high the TGD was almost 28% above its 200-day MA. Now it is only 18% above the key 200-day MA. The 200-day MA is just starting to turn up. The other key MAs have all crossed over to the upside, suggesting that we are embarked on a bull move to the upside. Targets should be at least 362 (recent high 358) or even up to 390. We have further potential targets up to 455 which would equal the 2011 high. The uptrend line appears to be around 330, so on any further pullback we’d prefer we hold that level. A drop under 330 would question the uptrend and minimum we’d look for a test of the 200-day MA near 295. The Gold Miners Bullish Percent Index (BPGDM) is still at 72.40 so there is plenty of room for that indicator to move higher. In 2016 the BPGDM hit 100 and more recently at the August 2020 high it also hit 100. Those are normally signals to at least take profits. The uptrend for the gold stock indices appears to be in place. Gold stocks remain cheap relative to gold. However, what we can’t say for sure yet is whether this recent pullback is over. As noted, a move above 365 would suggest new highs ahead. The trend is up, but the recent correction may not be over just yet.
Silver Excerpt -- Read the full weekly report on GoldSeek.com
About the author


Website: https://www.enrichedinvesting.com
Disclaimer: David Chapman is not a registered advisory service and is not an exempt market dealer (EMD) nor a licensed financial advisor. We do not and cannot give individualised market advice. David Chapman has worked in the financial industry for over 40 years including large financial corporations, banks, and investment dealers. The information in this newsletter is intended only for informational and educational purposes. It should not be considered a solicitation of an offer or sale of any security. The reader assumes all risk when trading in securities and David Chapman advises consulting a licensed professional financial advisor before proceeding with any trade or idea presented in this newsletter. David Chapman may own shares in companies mentioned in this newsletter. We share our ideas and opinions for informational and educational purposes only and expect the reader to perform due diligence before considering a position in any security. That includes consulting with your own licensed professional financial advisor.