Source: www.stockcharts.com
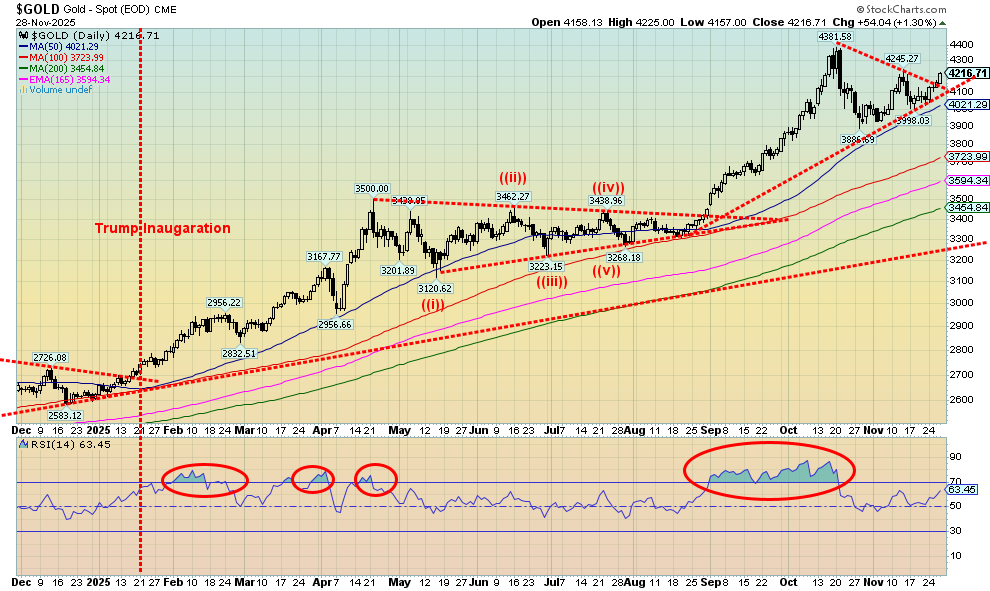
For the fourth consecutive month gold rose. Gold has been up 10 of the 11 months of 2025 so far with July being the only blemish. We are currently headed for our best year since 1979. Thoughts of a Fed rate cut at the December FOMC are driving gold higher. There are also thoughts of Kevin Hassett, a well-known dove who is closely associated with President Trump, becoming Fed Chairman once Powell’s term is up in May 2026. Since gold is a safe haven, one can’t ignore the continued huge buying of gold by central banks. This is against the backdrop of continued geopolitical issues, domestic issues in the U.S., threats of war against Venezuela by the U.S., and growing economic uncertainty, with some of the worst consumer sentiment since the Great Recession and the pandemic.Gold rose 3.8% this past week, silver hit record highs up 12.9%, and platinum was up almost 11.0%. For the near precious metals, palladium gained 5.1% and copper was up almost 4.0%. The gold stocks soared, with the Gold Bugs Index (HUI) up 14.1% and the TSX Gold Index (TGD) gaining 11.3%. Despite the gain, gold’s RSI is 63.45, suggesting we have further to move. We haven’t yet made new highs, but we appear to be breaking out over the consolidation pattern. We are still shy of the point at $4,265 that would suggest new highs above $4,381 are probable. Once new highs are made, gold could then project up to $4,650. What’s interesting for 2025 is that gold, considered a barbarous relic, is up for 2025 while Bitcoin, that was supposed to be the saviour, is down on the year. Gold, silver, and the gold stocks have sharply outpaced everyone else in 2025. One could call it a golden year.
Source: www.stockcharts.com
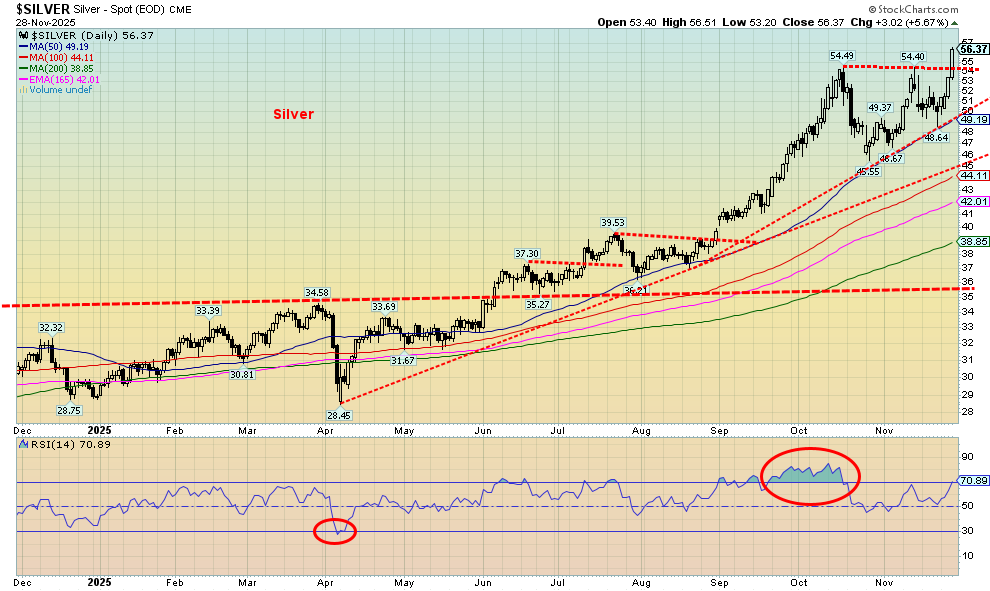
Hi yo, Silver, away! Echoes of the Lone Ranger. Yes, silver has been the star this past week, jumping 12.9% to new all-time highs. What’s more, silver is up 92.8% so far in 2025, guaranteeing that silver should have its best year since 1979. In thrusting out to new all-time highs, the breakout suggests that silver could make even higher highs. The current projection is potentially up to around $63.50. That sounds great until you realize we have to get to $197 to equal that 1980 high, inflation-adjusted. The 2011 high, inflation-adjusted, comes more into focus. We only have to rise to $71/$72 to equal that high. After being mostly overbought throughout September and October, we are once again approaching overbought. So, it’s a note of caution as divergences emerge. The Gold/Silver ratio has fallen to 74.80. Below 72.90 we will break the 2024 low and suggest that we have further to fall. Helping silver is a worldwide deficit of silver, a commodity used in numerous applications, electronics, solar energy, chemical production, and more.
So, we say it once again, hi yo, Silver!
Source: www.stockcharts.com
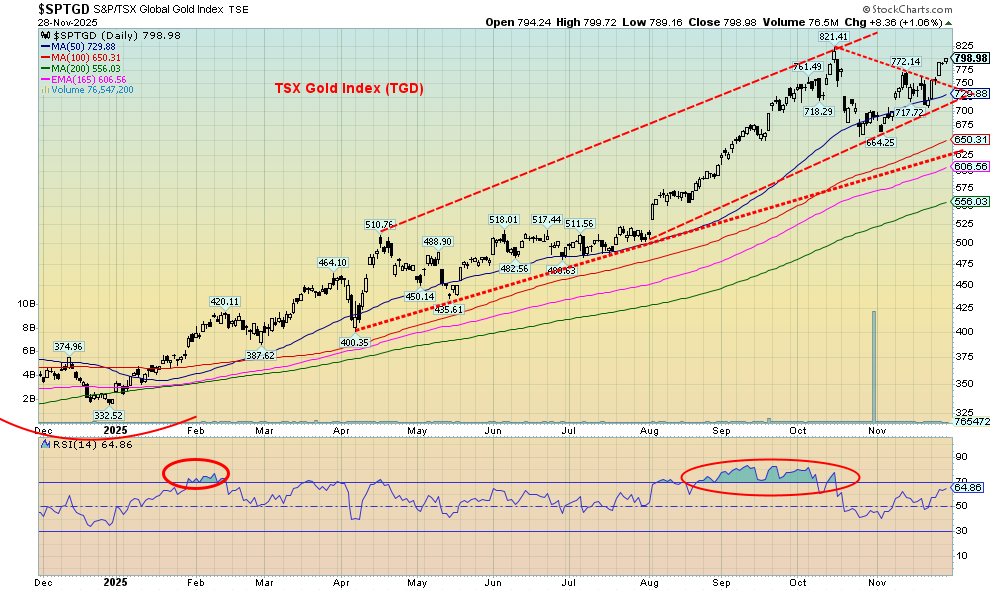
It has been a good year to be a gold bug and owning gold stocks. With gold up almost 60% and silver up about 93% in 2025, the gold stock indices have soared. The TSX Gold Index (TGD) gained 11.3% this past week and is now up 137.2% on the year. The Gold Bugs Index (HUI) rose 14.1% and is up 145.9% in 2025. Some individual stocks are up even more, while the junior developers have also enjoyed a good year with numerous stocks up over 100% and some up 200%, even 300%, on the year. The TGD appears to have broken out of the recent consolidation. The pattern could project to 980 which, of course, would mean new all-time highs. The only down month was October. We did have about three months of extreme overbought conditions, so in some respects, the pullback in October shouldn’t have been a surprise. But are we now on another run? We are not yet overbought.
Read the FULL report here: Technical Scoop: Division Precedence, Volatility Turn, Precious Lead
Copyright David Chapman 2025
Disclaimer David Chapman is not a registered advisory service and is not an exempt market dealer (EMD) nor a licensed financial advisor. He does not and cannot give individualised market advice. David Chapman has worked in the financial industry for over 40 years including large financial corporations, banks, and investment dealers. The information in this newsletter is intended only for informational and educational purposes. It should not be construed as an offer, a solicitation of an offer or sale of any security. Every effort is made to provide accurate and complete information. However, we cannot guarantee that there will be no errors. We make no claims, promises or guarantees about the accuracy, completeness, or adequacy of the contents of this commentary and expressly disclaim liability for errors and omissions in the contents of this commentary. David Chapman will always use his best efforts to ensure the accuracy and timeliness of all information. The reader assumes all risk when trading in securities and David Chapman advises consulting a licensed professional financial advisor or portfolio manager such as Enriched Investing Incorporated before proceeding with any trade or idea presented in this newsletter. David Chapman may own shares in companies mentioned in this newsletter. Before making an investment, prospective investors should review each security’s offering documents which summarize the objectives, fees, expenses and associated risks. David Chapman shares his ideas and opinions for informational and educational purposes only and expects the reader to perform due diligence before considering a position in any security. That includes consulting with your own licensed professional financial advisor such as Enriched Investing Incorporated. Performance is not guaranteed, values change frequently, and past performance may not be repeated.
About the author


Website: https://www.enrichedinvesting.com
Disclaimer: David Chapman is not a registered advisory service and is not an exempt market dealer (EMD) nor a licensed financial advisor. We do not and cannot give individualised market advice. David Chapman has worked in the financial industry for over 40 years including large financial corporations, banks, and investment dealers. The information in this newsletter is intended only for informational and educational purposes. It should not be considered a solicitation of an offer or sale of any security. The reader assumes all risk when trading in securities and David Chapman advises consulting a licensed professional financial advisor before proceeding with any trade or idea presented in this newsletter. David Chapman may own shares in companies mentioned in this newsletter. We share our ideas and opinions for informational and educational purposes only and expect the reader to perform due diligence before considering a position in any security. That includes consulting with your own licensed professional financial advisor.