Excerpt from this week's: Technical Scoop: Dollar Higher, Gold Small, Recession Indicator
Source: www.stockcharts.com
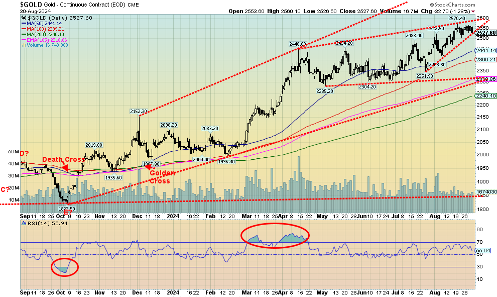
Gold continues to shine, even though it still seems no one is paying any attention. It has been described as the canary in the coal mine, warning us that something negative is afoot. Too bad silver is still struggling to get the message. But we did see some positive moves by silver over the past couple of weeks. This past week gold fell 0.7%, thanks to a strong U.S. dollar as the US$ Index, sparked by the better than expected economic numbers, rose 1.0%. Silver fell 2.3%. But gold remains up 22.0% on the year and silver up 21.0%. Platinum continues to struggle, falling 3.5%, but palladium continues to recover, up 2.2%, while copper was up 0.2%. The gold stocks suffered as a result, with the Gold Bugs Index (HUI) falling 2.0% and the TSX Gold Index (TGD) off 1.5%. Both remain up on the year at 28.7% and 27.7% respectively.
Gold is still rising, but below $2,500 a temporary top may be in. We still seem to be headed inexorably for $2,600 next. There is good support down to $2,400. Silver has support here at $29, but below that we could fall to $28. The TGD has good support down to 347 and 340. We may not have made a seasonal bottom in September yet, so some more work may need to be done on the current corrective state. Once we find a bottom, we could rise into November before correcting again into December. After that, gold enjoys its best seasonal pattern of the year with good rises into March.
A quick note on oil that continues to suffer some demand concerns. And with the Middle East relatively quiet, especially on the Iran front, that keeps a lid on oil rising. WTI oil fell 1.7% this past week, Brent was down 1.6%, natural gas (NG) fell 2.3%, but EU NG at the Dutch Hub was up 7.6%. Energy stocks were mixed, with the ARCA Oil & Gas Index (XOI) up 0.7% but the TSX Energy Index (TEN) was down 1.4%. We’re still a couple of months away from the strong seasonals for oil.
Gold is going higher. But we need silver to assume leadership, and it still needs to take out $31.50 to tell us new highs are ahead. In the interim, we still might face some further corrective action. Into 2025 things might get quite golden.
Chart of the Week
Source: www.stockcharts.com
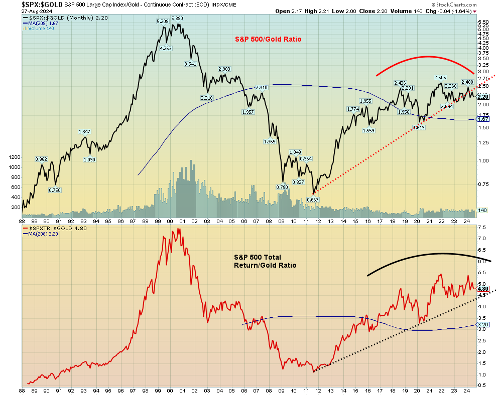
Most followed is the Dow Jones Industrials/Gold ratio, or simply the DJI/Gold ratio. It is useful in determining whether one should be long stocks or long gold. The ratio showed you should be long gold 1929–1932, 1966–1980, and 1999–2011. And long stocks 1932–1966, 1980–1999, and 2011–2018. It is indeterminate since then as the pattern has moved largely sideways, with some bias towards gold.
However, this looks at the S&P 500/Gold ratio as well as the S&P 500 Total Return/Gold ratio. The patterns and when to be long or short (out of) gold are the same, but the message seems to be that over time the S&P 500 total return has outperformed by more than double. When, as we show below, Chen Zhao’s chart rebased to 1969, it shows it is more than four times better. It shows the power of dividends. What it seems to suggest is that while there is a time to hold gold or even increase one’s exposure to it over the long term, it is better to collect dividends. Both patterns are now indicating that the ratio is topping, suggesting one should increase their exposure to gold.
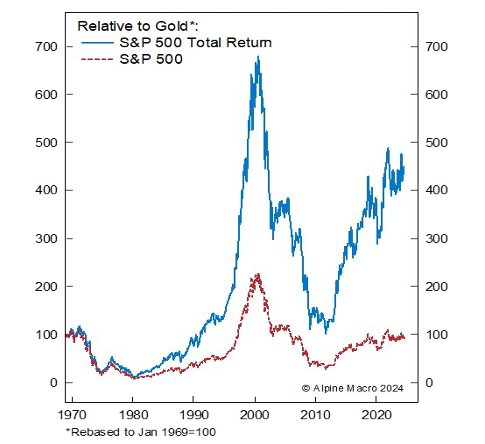
Source: www.alpinemacro.com, courtesy of Chen Zhao
Read the FULL report here: Technical Scoop: Dollar Higher, Gold Small, Recession Indicator
Copyright David Chapman 2024
Disclaimer
David Chapman is not a registered advisory service and is not an exempt market dealer (EMD) nor a licensed financial advisor. He does not and cannot give individualised market advice. David Chapman has worked in the financial industry for over 40 years including large financial corporations, banks, and investment dealers. The information in this newsletter is intended only for informational and educational purposes. It should not be construed as an offer, a solicitation of an offer or sale of any security. Every effort is made to provide accurate and complete information. However, we cannot guarantee that there will be no errors. We make no claims, promises or guarantees about the accuracy, completeness, or adequacy of the contents of this commentary and expressly disclaim liability for errors and omissions in the contents of this commentary. David Chapman will always use his best efforts to ensure the accuracy and timeliness of all information. The reader assumes all risk when trading in securities and David Chapman advises consulting a licensed professional financial advisor or portfolio manager such as Enriched Investing Incorporated before proceeding with any trade or idea presented in this newsletter. David Chapman may own shares in companies mentioned in this newsletter. Before making an investment, prospective investors should review each security’s offering documents which summarize the objectives, fees, expenses and associated risks. David Chapman shares his ideas and opinions for informational and educational purposes only and expects the reader to perform due diligence before considering a position in any security. That includes consulting with your own licensed professional financial advisor such as Enriched Investing Incorporated. Performance is not guaranteed, values change frequently, and past performance may not be repeated.
About the author


Website: https://www.enrichedinvesting.com
Disclaimer: David Chapman is not a registered advisory service and is not an exempt market dealer (EMD) nor a licensed financial advisor. We do not and cannot give individualised market advice. David Chapman has worked in the financial industry for over 40 years including large financial corporations, banks, and investment dealers. The information in this newsletter is intended only for informational and educational purposes. It should not be considered a solicitation of an offer or sale of any security. The reader assumes all risk when trading in securities and David Chapman advises consulting a licensed professional financial advisor before proceeding with any trade or idea presented in this newsletter. David Chapman may own shares in companies mentioned in this newsletter. We share our ideas and opinions for informational and educational purposes only and expect the reader to perform due diligence before considering a position in any security. That includes consulting with your own licensed professional financial advisor.