Excerpt from this week's: Technical Scoop: Economic Threats, Precious Win, Waking Oil
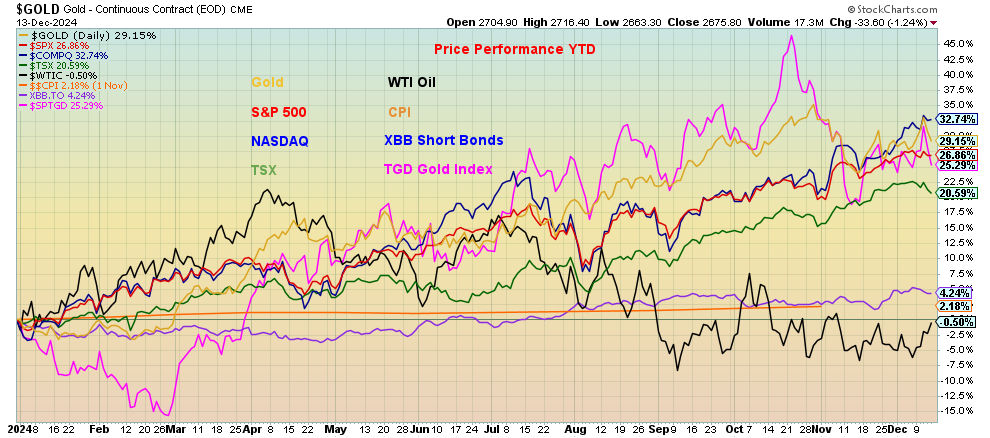
The best performer of the year of major indices has been the NASDAQ up 32.7%. Gold has outperformed the others up 29.2%. Silver is up 28.8% to date. The S&P 500 has gained 26.9% to date. The TSX Gold Index (TGD) up 25.3% has outperformed the Gold Bugs Index (HUI) up 22.4%. The TGD outperformed the TSX up 20.6% thus far in 2024.

Source: www.stockcharts.com
We are living in a world of chaos: wars, culture wars, deep divisions, rising fascism, increasing intensity and rising costs of storms including wildfires, floods, and hurricanes. The latter is due to climate change, where we are coming off the hottest decade and year on record. Climate change is causing storms to become more intense and costly due to rising sea temperatures which provide more energy to fuel storms, leading to stronger winds, heavier rainfall, and increased storm surges, resulting in greater damage to coastal areas and infrastructure; this trend is reflected in a significant increase in the economic cost of weather-related disasters globally.
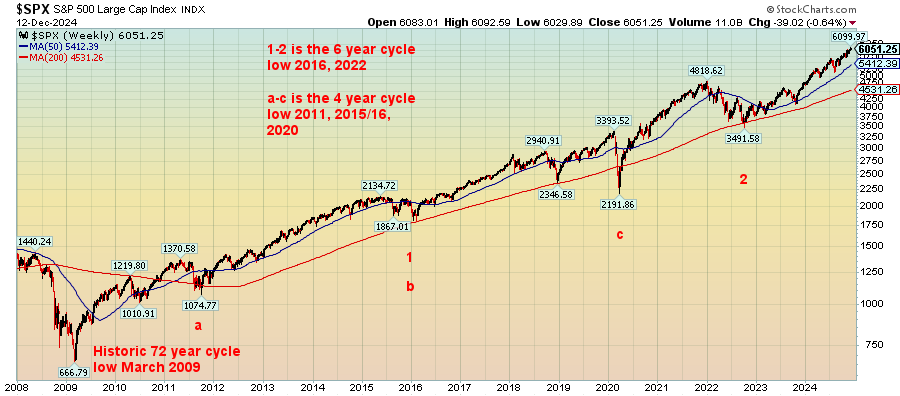
As you can see, all these cycles, 90, 18, 6, and 4 are collecting and overlapping in the upcoming period. The odds then favour the upcoming period, given that everything going on behind could be volatile and we see a significant stock market low, if not in 2025, then sometime later in the decade.

Source: www.stockcharts.com
What about gold? Gold does not have the free trading history that the stock market has; therefore, a history of cycles is still developing. Here Merriman emphasizes what he sees as a 7.83-year cycle. From that important low in 1976 we did see important lows in 1985, 1993, 2001, 2008, and 2015. Following the 2015 low, the next 7.83-year cycle low would be due in 2023. We had what has proven to be an important low in November 2022. Could that have been our 7.83-year cycle low? The range would be 7–9 years. If that’s correct, then we know we are in the up phase of the current 7.83-year cycle. That cycle breaks down into three 31.3-month cycles or two 47-month cycles. If it is the 31.3-month cycle, it is due in 2025 centered around June. That suggests to us that the next peak, whenever that comes, could be our temporary top. Once the next 31.3-month cycle low is determined, we should embark on the next up move. We continue to have targets up to $3,600.
Overall, our expectations for gold in 2025 are positive, but it will not be a straight-up move. The 10-year cycle for gold is not much help as we have yet to find any consistency. The record is three up and two down with the two down years coming in 1975 and 2015. We remain concerned that silver continues to lag as do the gold stocks, as represented by the Gold Bugs Index (HUI) and the TSX Gold Index (TGD). Silver is currently down about 36% from its all-time high. The HUI remains down over 50% from its all-time high and the TGD is still down around 18% from its all-time high.
We mustn’t ignore junior mining stocks including the junior gold mining stocks. The TSX Venture Exchange (CDNX) which is made up of roughly 50% junior mining companies remains down an astounding 82% from its all-time high seen in 2007. The CDNX is even down 45% from its 2021 high. Junior miners are unloved and under owned at least by anybody that is not an insider or billionaire Eric Sprott. The current period reminds us of the late 1990’s when tech was all the rage and junior mining stocks were unloved and under owned. By 2000 the rebound was underway and the next seven years saw the CDNX rise 433% from its humble beginnings in 1999. We thought at the time that they would become the next big thing when we witnessed junior miners turning into tech companies. As we know, tech crashed while commodities and commodity stocks rose.
10-Year Gold Cycle
Annual % Change in Gold
Year of Decade
|
Decades |
1st |
2nd |
3rd |
4th |
5th |
6th |
7th |
8th |
9th |
10th |
|
1961–70 |
|
|
|
|
|
|
-0.5 |
10.7 |
6.2 |
-8.9 |
|
1971–80 |
16.5 |
48.9 |
75.6 |
60.6 |
-23.3 |
-3.8 |
23.4 |
36.5 |
134.8 |
10.9 |
|
1981–90 |
-32.5 |
12.7 |
-14.4 |
-20.0 |
6.9 |
23.1 |
20.1 |
-15.7 |
-1.8 |
-1.6 |
|
1991–00 |
-10.6 |
-5.9 |
17.6 |
-1.9 |
1.0 |
-4.9 |
-21.5 |
-0.2 |
0.1 |
-6.0 |
|
2001–10 |
2.6 |
24.8 |
flat |
25.6 |
18.2 |
22.8 |
31.4 |
5.8 |
23.9 |
29.8 |
|
2011–20 |
10.2 |
7.0 |
-28.2 |
-1.5 |
-10.4 |
8.6 |
13.7 |
-2.1 |
18.9 |
24.4 |
|
2021–30 |
-3.5 |
-0.1 |
13.5 |
29.2* |
|
|
|
|
|
|
|
|
3 up 3 dn |
4 up 2 dn |
4 up 2 dn |
3 up 3 dn |
3 up 2 dn |
3 up 2 dn |
4 up 2 dn |
3 up 3 dn |
5 up 1 dn |
3 up 3 dn |
Source: www.stockcharts.com
* To date

Source: www.stockcharts.com
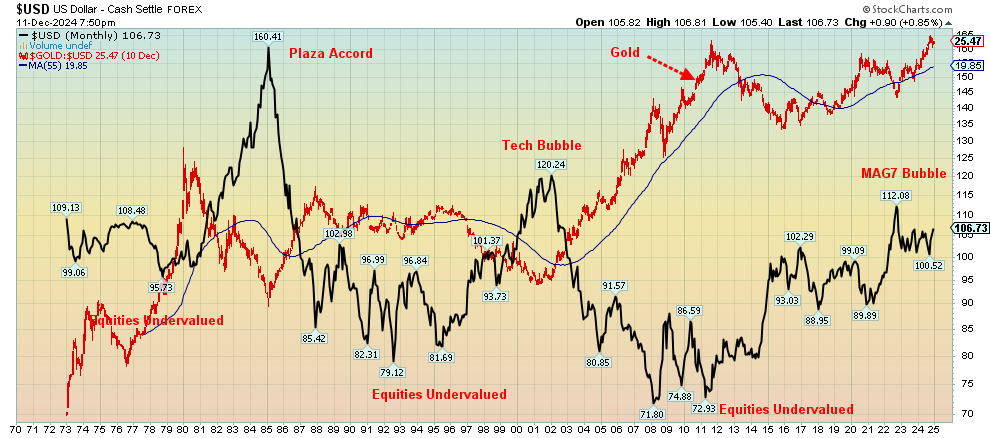
Gold has a history of inversely trading with the US$ Index: if the US$ Index rises, gold weakens and vice versa. Equities tend to be undervalued when the US$ Index is low and overvalued when the US$ Index is high. What’s intriguing here is that since the start of the US$ Index in the 1970s it has had three peaks: one coinciding with the Plaza Accord of 1985, designed to bring down the value of the U.S. dollar, the second at the peak of the tech/dot.com bubble, then triggered lower by the events of 9/11, and the most recent high coinciding with a potential peak of the MAG7 bubble. Each subsequent high has been lower. What this chart suggests is that the odds favour the next move for the US$ Index going down. That in turn would be positive for gold
Read the FULL report here: Technical Scoop: Economic Threats, Precious Win, Waking Oil
Disclaimer
David Chapman is not a registered advisory service and is not an exempt market dealer (EMD) nor a licensed financial advisor. He does not and cannot give individualised market advice. David Chapman has worked in the financial industry for over 40 years including large financial corporations, banks, and investment dealers. The information in this newsletter is intended only for informational and educational purposes. It should not be construed as an offer, a solicitation of an offer or sale of any security. Every effort is made to provide accurate and complete information. However, we cannot guarantee that there will be no errors. We make no claims, promises or guarantees about the accuracy, completeness, or adequacy of the contents of this commentary and expressly disclaim liability for errors and omissions in the contents of this commentary. David Chapman will always use his best efforts to ensure the accuracy and timeliness of all information. The reader assumes all risk when trading in securities and David Chapman advises consulting a licensed professional financial advisor or portfolio manager such as Enriched Investing Incorporated before proceeding with any trade or idea presented in this newsletter. David Chapman may own shares in companies mentioned in this newsletter. Before making an investment, prospective investors should review each security’s offering documents which summarize the objectives, fees, expenses and associated risks. David Chapman shares his ideas and opinions for informational and educational purposes only and expects the reader to perform due diligence before considering a position in any security. That includes consulting with your own licensed professional financial advisor such as Enriched Investing Incorporated. Performance is not guaranteed, values change frequently, and past performance may not be repeated.


