Excerpt from this week's: Technical Scoop: Gold Depletion, Trajectory Comparison, Languishing Oil
So, what’s happening today? Gold has been free-floating now for nearly 54 years. Today it is setting records as we approach US$3,000. That’s a long way from $35. The London gold market is experiencing shortages. Why?
The answer is economic anxiety and sharply increased demand, particularly from Asia. Futures contracts that are normally rolled over or cashed out are instead demanding delivery of the gold. Each futures contract represents 100 ounces of gold. Fearing tariffs and more, traders are rushing to convert to gold and get it out of the U.K. before tariffs hit it. With supplies dwindling in London, there is also a rush for central banks to borrow gold. Apparently, it now takes up to four weeks to get gold out of the Bank of England (BOE) vs. the normal few days or up to a week. Traders want to hedge their position in the NY COMEX market where futures now trade above the London spot market. The pressure is causing gold prices to rise.
Don’t expect this to end any time soon. The following chart shows the LBMA London Gold Holdings. The one to focus on is the available stocks (green). None of the other categories are available for delivery. That includes ETF holdings, BOE holdings, and reserves.
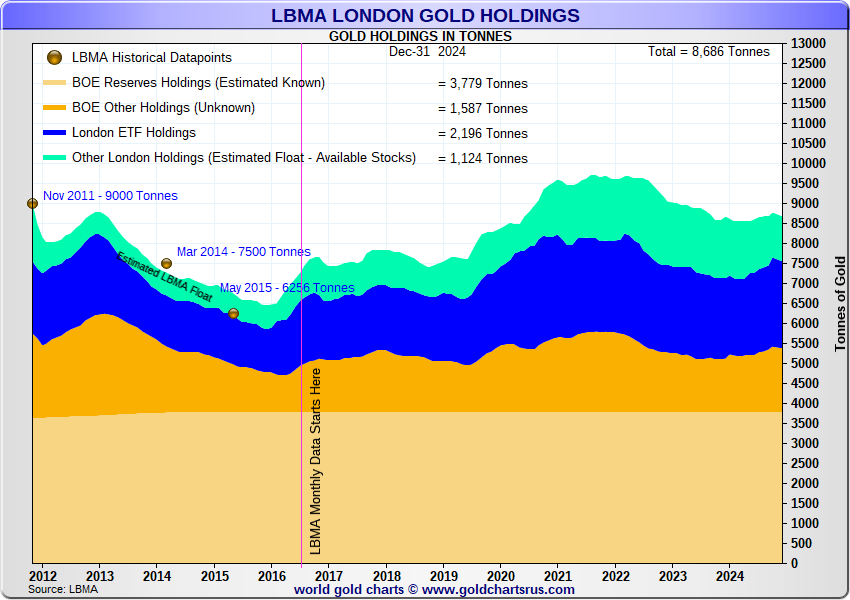
Source: www.goldchartsrus.com
Silver stocks are also being depleted. Again, only the green area is available for delivery. The rest is held in ETFs.
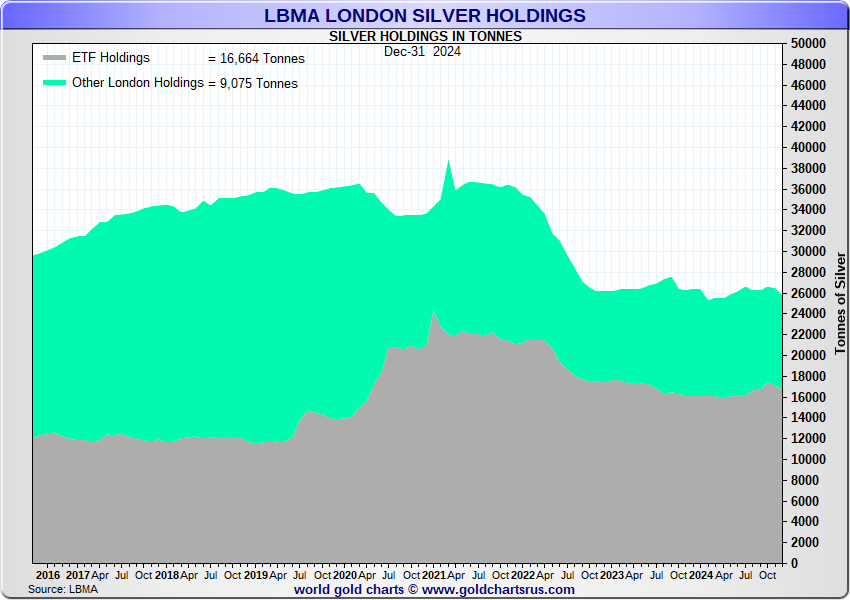
Source: www.goldchartsrus.com
A better picture of the declining gold and silver stocks at the LBMA.
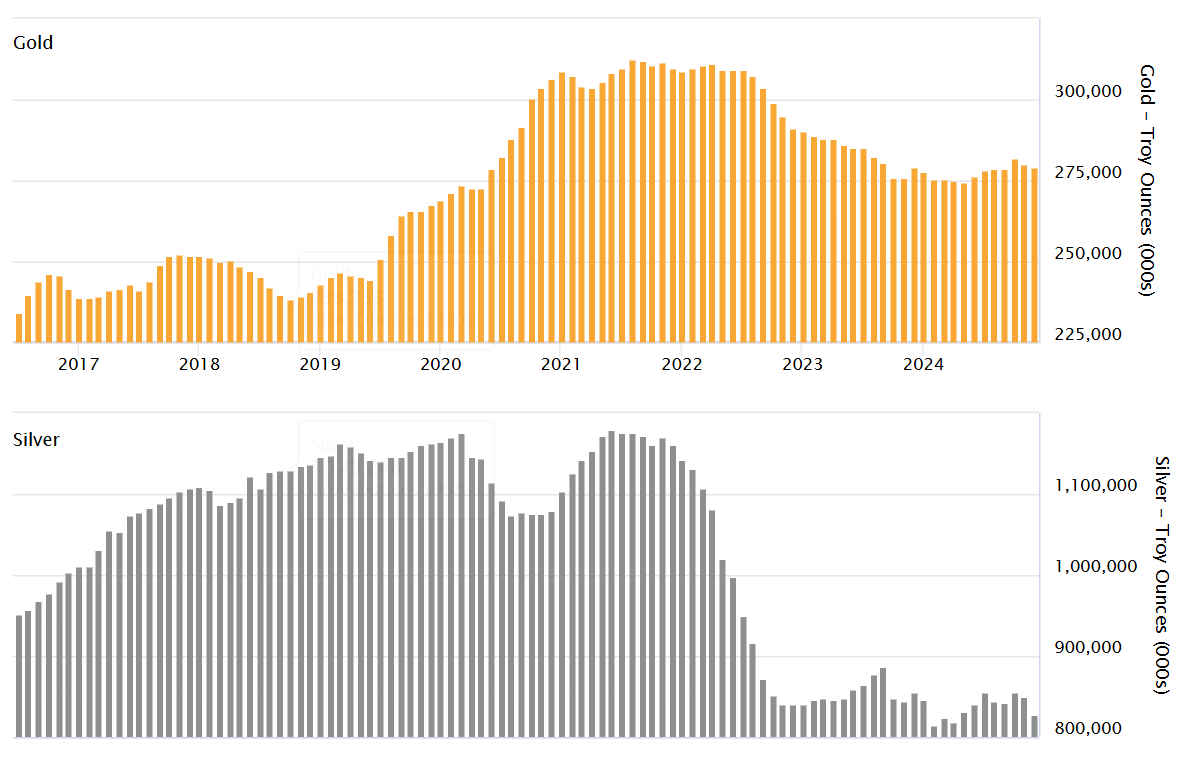
Source: www.lbma.org.uk
Revaluation of Gold Upward?
There has been talk of late of revaluing gold. With geopolitical tensions rising, domestic political tensions also rising with the surge of right-wing groups, including neo-Nazis, and the U.S. dollar’s dominance under attack, central banks have been stockpiling gold. Many believe it is not a question of if but when gold is revalued in order to monetize the debt. Fiat currencies are under attack. Russia and China and India have been stockpiling gold in order to back their currencies and make a move away from the U.S. dollar. All this has led to talks about a monetary reset and even a new global financial system. Bretton Woods 2? Or is it 3?
The U.S. has the world’s largest reserves of gold: 8,133.5 metric tonnes or 261,498,926.2 troy ounces. Many would be surprised to learn that the U.S. still carries this gold on its books at $42.20/ounce. That means it has a valuation of $11,041,059,957.90 or $11.0 billion. Based on today’s price of roughly $2,900/ounce, it should be worth $758,346,886,098.90 or $758.3 billion. That’s a long way from the U.S. federal debt of $36.5 trillion.
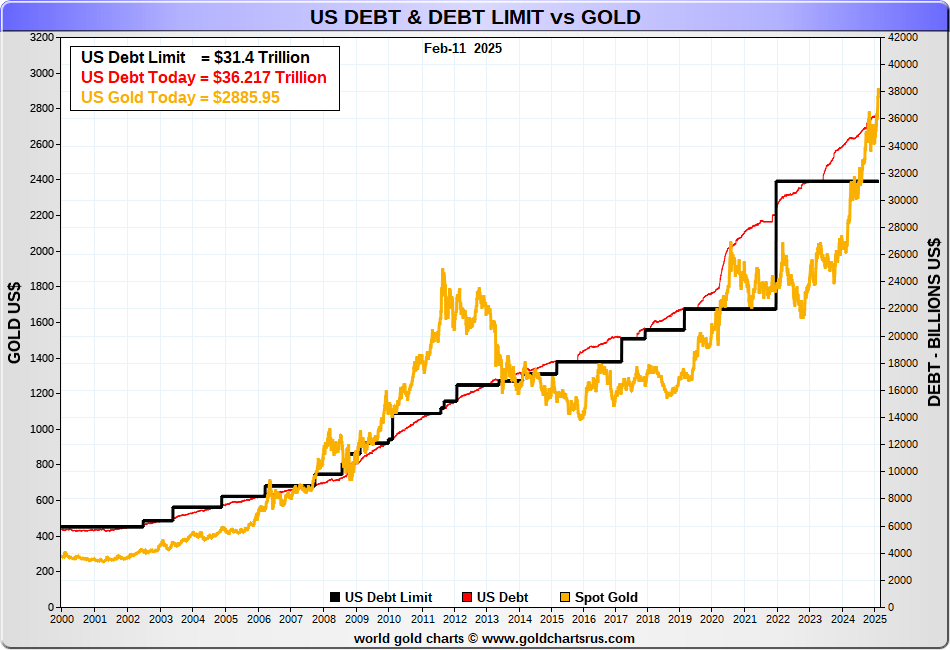
Source: www.goldchartsrus.com
It is highly unlikely the entire amount would be covered in any revaluation. That would require gold to be priced at over $139,000/ounce (effectively $36.5 trillion/261,498 thousand). More realistic would be to revalue it at 10% of the debt outstanding or $13,950/ounce. That’s a long distance from today’s $2,900.
It is not as if this hasn’t been done before. It happened in the 1930s when gold was revalued up to $35/ounce from $20.67. The gold standard had been abandoned and the world was in the midst of a depression. The Gold Reserve Act of 1934 revalued gold and made it illegal for private citizens, including businesses and banks, to hold gold. Coins were largely exempt. What it did was to devalue the U.S. dollar by increasing inflation. It also helped set off a mining boom of exploration and increasing production. A reminder that while the Dow Jones Industrials (DJI) was falling 89% from 1929–1932, Homestake Mining (later Barrick Gold) rose 400%. The $35/ounce was later used to peg the conversion of U.S. dollars to gold under Bretton Woods.
We can’t speculate as to whether this will happen. But in a world with growing inflation (stagflation?), tariffs, supply chain issues, currency wars, mining deficits, and central banks accumulating gold, particularly Russia and China, it is all a hedge against growing instability and potential economic chaos.
Is there any problem with this? Backing the U.S. dollar with gold has been done before. It’s the old gold standard. The trouble with that, however, is it makes it difficult to print more U.S. dollars when needed. That was always a constraint under the gold standard. Commercial banks and even central banks recognized its limitations and fought to end the constraints, thus ending the gold standard. Backing the debt could work as long as the price of gold rises with the debt. Since 2000 when that chart gets underway, gold is up 911%. The U.S. federal debt has leaped 538%. It seems that the gold community is already on the case. Too bad the U.S. GDP has gone up only 216% in the same time period.
For currencies the US$ Index fell 1.3% continuing its recent weakness. The euro jumped 1.6%, the Swiss franc was up 1.1%, the pound sterling up 1.4% and the Cdn$ gained 0.7%. Only the Japanese yen fell off 0.7%. Gold made all-time highs again up 0.5% despite Friday’s wipeout, silver led up 1.3%, while platinum fell down 0.2%. Palladium gained 2.7% while copper continued upward gaining 1.5%. WTI oil fell 0.4% while Brent crude was up a small 0.1%. Natural gas (NG) was up 12.7% thanks to snowy cold weather while NG at the Dutch Hub fell 10.2%.
Friday was a bit of wipeout for gold, gold stocks and silver. But it appeared to be driven by profit taking that snowballed. Is the gold upswing over? We don’t believe so but recovery this week would help. The stock markets still look iffy and topping but if new highs happen then we’d have to say we are headed higher.
Markets Continue
Selected Performance November 5, 2024–February 13, 2025
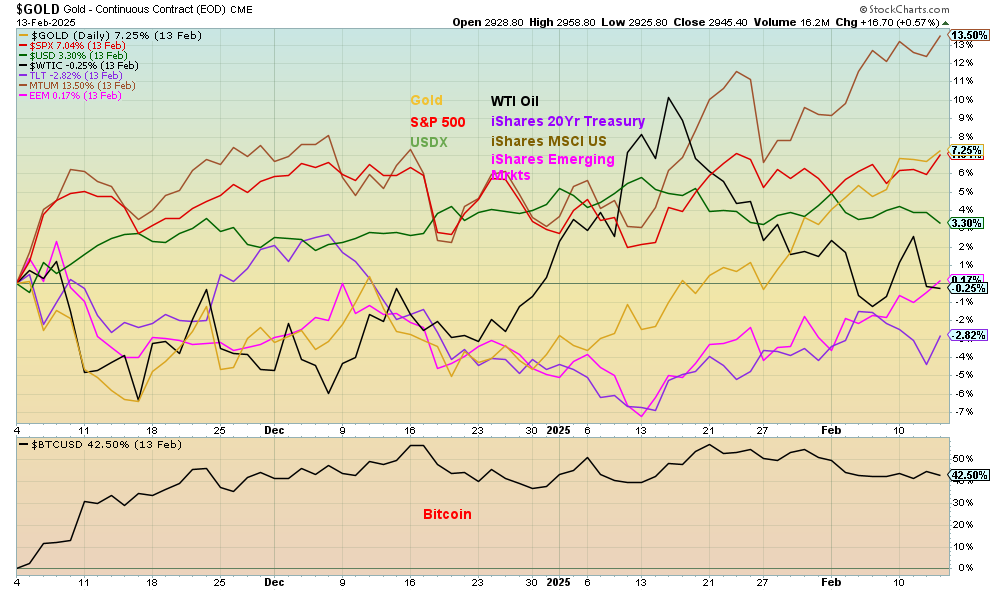
Source: www.stockcharts.com
Markets continue to be positive with stocks up, gold up, and Bitcoin up. Not doing as well are oil and bonds. The stock market continues to form what we believe is a distribution top pattern. A breakdown for the S&P 500 under 6,000 could prove fatal. But the real points to watch are under 5,700 and especially 5,400. Under 4,900 we officially enter a bear market. Naturally new highs will keep this market alive. The MAG7 are mixed, with some, including Meta and Netflix, doing well others, especially Tesla, not doing so well. Tesla is already in an official bear market.
Read the FULL report here: Technical Scoop: Gold Depletion, Trajectory Comparison, Languishing Oil
Disclaimer
David Chapman is not a registered advisory service and is not an exempt market dealer (EMD) nor a licensed financial advisor. He does not and cannot give individualised market advice. David Chapman has worked in the financial industry for over 40 years including large financial corporations, banks, and investment dealers. The information in this newsletter is intended only for informational and educational purposes. It should not be construed as an offer, a solicitation of an offer or sale of any security. Every effort is made to provide accurate and complete information. However, we cannot guarantee that there will be no errors. We make no claims, promises or guarantees about the accuracy, completeness, or adequacy of the contents of this commentary and expressly disclaim liability for errors and omissions in the contents of this commentary. David Chapman will always use his best efforts to ensure the accuracy and timeliness of all information. The reader assumes all risk when trading in securities and David Chapman advises consulting a licensed professional financial advisor or portfolio manager such as Enriched Investing Incorporated before proceeding with any trade or idea presented in this newsletter. David Chapman may own shares in companies mentioned in this newsletter. Before making an investment, prospective investors should review each security’s offering documents which summarize the objectives, fees, expenses and associated risks. David Chapman shares his ideas and opinions for informational and educational purposes only and expects the reader to perform due diligence before considering a position in any security. That includes consulting with your own licensed professional financial advisor such as Enriched Investing Incorporated. Performance is not guaranteed, values change frequently, and past performance may not be repeated.
Bonds are generally languishing with a slight downward bias (yield). The Friday, February 14 release of January’s retail sales was a bit of a shock as sales fell 0.9% when only a 0.1% drop was expected. That helped long bonds. But rising inflation keeps pressure on the Fed to not lower interest rates. Gold is continuing its upward march and we see no signs of a top forming. However, pullbacks, even steep ones, can occasionally be expected. That’s a sign of strength, not weakness. $2,900 is support, but under $2,700 we’d be concerned. $3,000 is in sight. Silver still languishes, as do gold stocks. However, we are seeing some buying coming into the junior gold mining market. That’s a potentially positive development. Oil prices are trying to find support in the $70 range. There remains the risk of accelerated tensions in the Middle East, particularly surrounding Iran.
About the author


Website: https://www.enrichedinvesting.com
Disclaimer: David Chapman is not a registered advisory service and is not an exempt market dealer (EMD) nor a licensed financial advisor. We do not and cannot give individualised market advice. David Chapman has worked in the financial industry for over 40 years including large financial corporations, banks, and investment dealers. The information in this newsletter is intended only for informational and educational purposes. It should not be considered a solicitation of an offer or sale of any security. The reader assumes all risk when trading in securities and David Chapman advises consulting a licensed professional financial advisor before proceeding with any trade or idea presented in this newsletter. David Chapman may own shares in companies mentioned in this newsletter. We share our ideas and opinions for informational and educational purposes only and expect the reader to perform due diligence before considering a position in any security. That includes consulting with your own licensed professional financial advisor.